1, What is jconsole
jconsole is the built-in Java performance analyzer of jdk, which is used to monitor the performance of Java applications and track the code in Java;
It has a close relative, that is, JVM;
2, How to use
1. It's very simple. On the command line of idea, enter:
D:\java\workspace\AS> jconsole
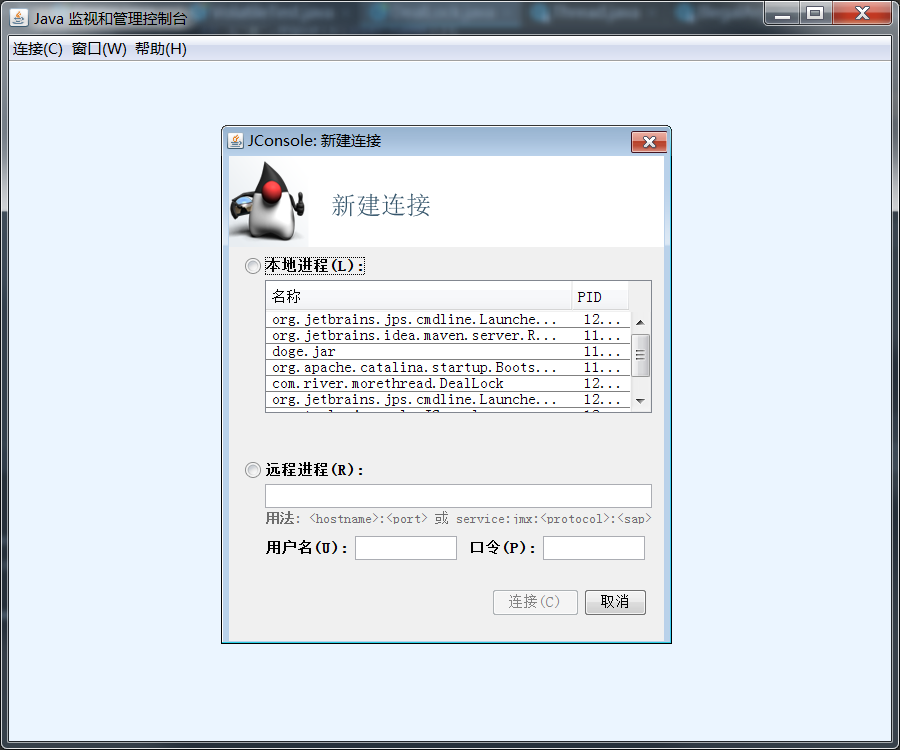
The GUI:
Here is a deadlock demo code:
package com.river.morethread;

public class DealLock implements Runnable{

    public String username;

    public Object lockOne = new Object();

    public Object lockSecond = new Object();

    public void serFlag(String username){
        this.username = username;
    }

    @Override
    public void run() {

        if ("a".equals(username)){
            synchronized (lockOne){
                try {
                    System.out.println("username -> " + username);
                    Thread.sleep(5000);
                } catch (InterruptedException e) {
                    e.printStackTrace();
                }
                synchronized (lockSecond){
                    System.out.println("lockOne -> lockSecond");
                }
            }
        }


        if ("b".equals(username)){
            synchronized (lockSecond){
                try {
                    System.out.println("username -> " + username);
                    Thread.sleep(5000);
                } catch (InterruptedException e) {
                    e.printStackTrace();
                }
                synchronized (lockOne){
                    System.out.println("lockSecond -> lockOne");
                }
            }
        }

    }


    public static void main(String[] args) throws InterruptedException {
        DealLock d1 = new DealLock();
        d1.serFlag("a");
        new Thread(d1).start();
        Thread.sleep(100);
        d1.serFlag("b");
        new Thread(d1).start();
    }
}
Therefore, Gui selects the process to view:
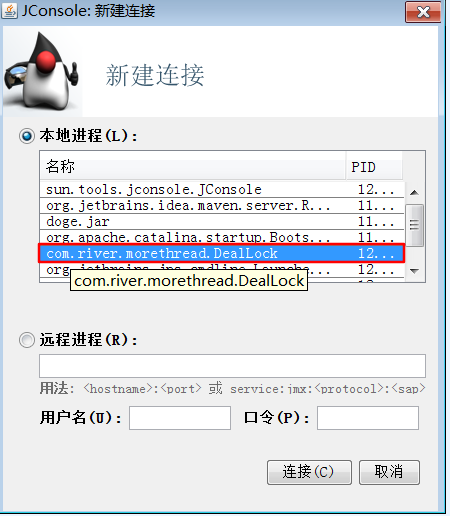
As can be seen here, jconsole supports both local and remote connections;
2. Click the link to enter the main page:
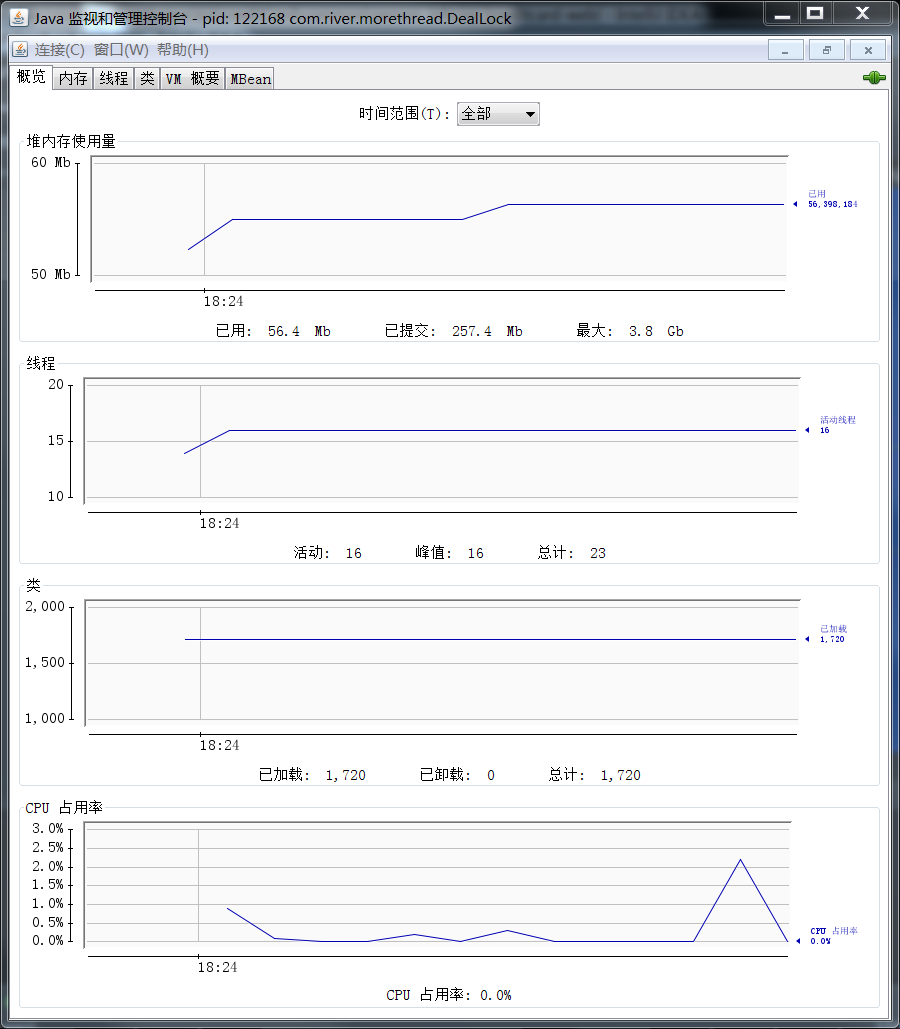
There are several tab s in the upper left corner that monitor different information

3. View thread deadlock, select thread tab, at the bottom
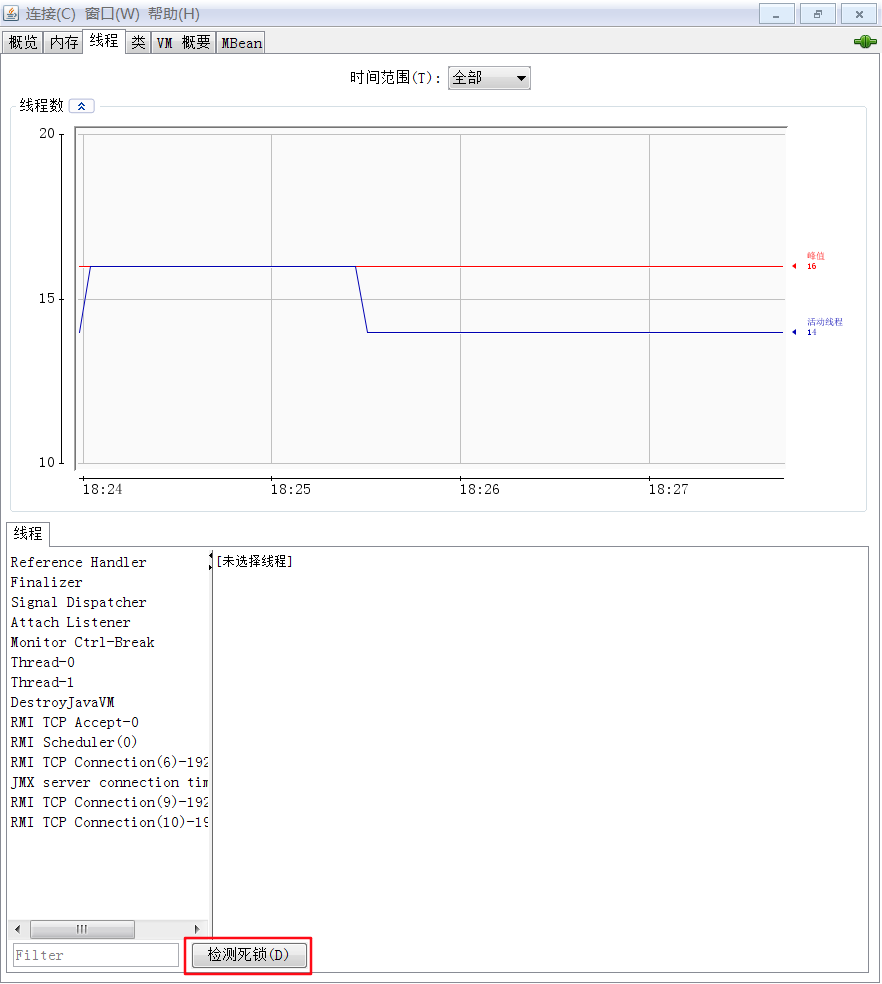
There is a deadlock detection, click:
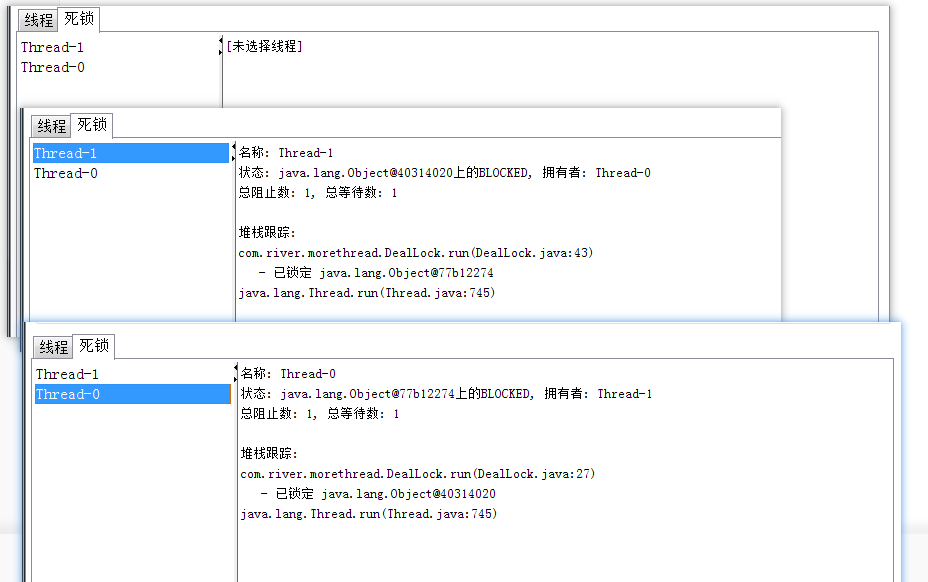
To be continued