Overall structure
Spring boot's actor provides the monitoring endpoint.
Prometheus is a monitoring system, which can obtain monitoring data from spring boot, store it in the form of time series data, and provide query service for monitoring data.
Grafana is a professional UI dashboard system, which supports a lot of data sources, including Prometheus. It can easily get data from it and display it with the dashboard.
micrometer is introduced in springboot 2, which can be more convenient for docking with various monitoring systems, including Prometheus.
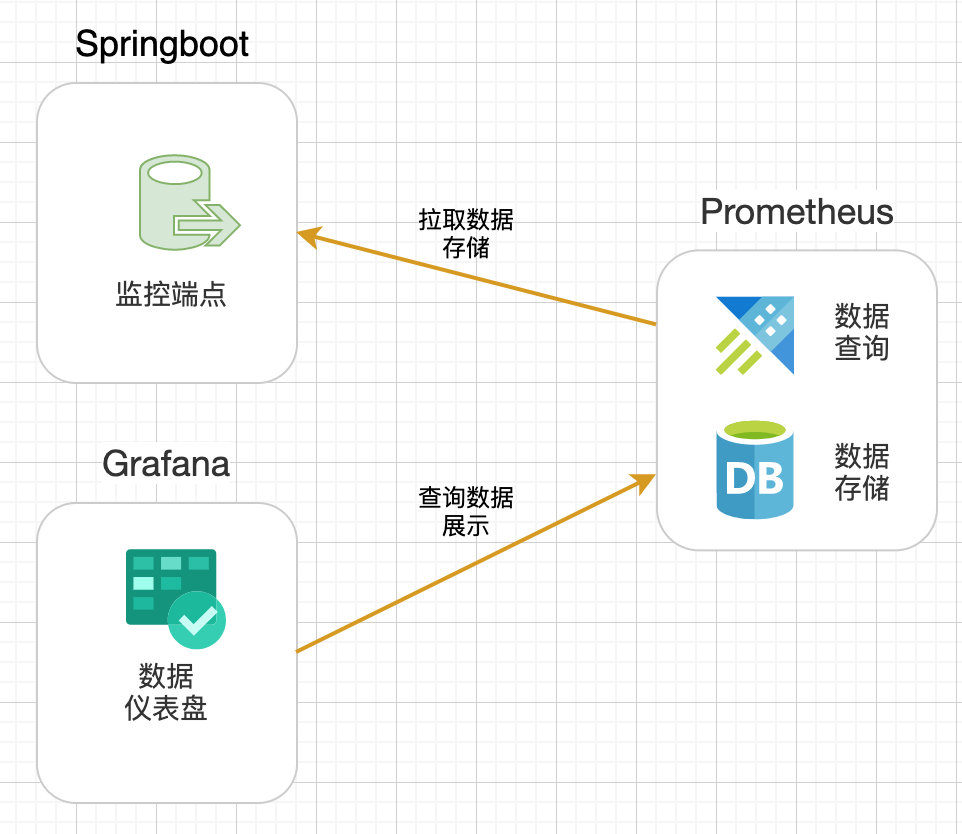
So the overall structure is:
- Spring boot (micrometer) generates monitoring data.
- Prometheus obtains the monitoring data of springboot application, stores it, and provides data query service.
- Grafana interfaces with Prometheus data source, invokes its data query service, and displays it with professional dashboard UI.
Practical steps
-
Create an application as a monitoring target to generate monitoring data.
-
Integrated measurement library micrometer -- for docking with the monitoring system Prometheus.
-
Deploy prometheus
-
Configure Prometheus -- monitor the springboot application created before to understand the query service of Prometheus.
-
Deploy Grafana
-
Add Prometheus data source
-
Add a JVM monitoring dashboard - shows the JVM status of the previous spring boot application.
-
User defined monitoring indicators - our own monitoring indicators are all the underlying basic data, and we need to write our own code for business related indicators.
-
Dynamic change monitoring target -- if the monitoring target changes, change the configuration file of Prometheus once and restart it. This is not suitable, and dynamic configuration is required.
1. Create application integration micrometer
Create the simplest spring boot application and add the micrometer dependency.
pom.xml :
<?xml version="1.0" encoding="UTF-8"?>
<project xmlns="http://maven.apache.org/POM/4.0.0" xmlns:xsi="http://www.w3.org/2001/XMLSchema-instance"
	xsi:schemaLocation="http://maven.apache.org/POM/4.0.0 https://maven.apache.org/xsd/maven-4.0.0.xsd">
	<modelVersion>4.0.0</modelVersion>
	<parent>
		<groupId>org.springframework.boot</groupId>
		<artifactId>spring-boot-starter-parent</artifactId>
		<version>2.2.4.RELEASE</version>
		<relativePath/> <!-- lookup parent from repository -->
	</parent>
	<groupId>com.example</groupId>
	<artifactId>springboot2demo</artifactId>
	<version>0.0.1-SNAPSHOT</version>
	<name>springboot2demo</name>
	<description>Demo project for Spring Boot</description>

	<properties>
		<java.version>1.8</java.version>
	</properties>

	<dependencies>
		<dependency>
			<groupId>org.springframework.boot</groupId>
			<artifactId>spring-boot-starter-actuator</artifactId>
		</dependency>
		<dependency>
			<groupId>org.springframework.boot</groupId>
			<artifactId>spring-boot-starter-web</artifactId>
		</dependency>
		<dependency>
			<groupId>io.micrometer</groupId>
			<artifactId>micrometer-registry-prometheus</artifactId>
			<version>1.1.4</version>
		</dependency>

		<dependency>
			<groupId>org.springframework.boot</groupId>
			<artifactId>spring-boot-starter-test</artifactId>
			<scope>test</scope>
			<exclusions>
				<exclusion>
					<groupId>org.junit.vintage</groupId>
					<artifactId>junit-vintage-engine</artifactId>
				</exclusion>
			</exclusions>
		</dependency>
	</dependencies>

	<build>
		<plugins>
			<plugin>
				<groupId>org.springframework.boot</groupId>
				<artifactId>spring-boot-maven-plugin</artifactId>
			</plugin>
		</plugins>
	</build>

</project>
application.properties
spring.application.name=springboot2demo
# Open all activator services
management.endpoints.web.exposure.include=*
# Add the application name to the tag of the meter
# So Prometheus can distinguish different services according to the application name
management.metrics.tags.application=${spring.application.name}
Add a Bean to the startup class to monitor the JVM performance metrics:
package com.example.springboot2demo;

import io.micrometer.core.instrument.MeterRegistry;
import org.springframework.beans.factory.annotation.Value;
import org.springframework.boot.SpringApplication;
import org.springframework.boot.actuate.autoconfigure.metrics.MeterRegistryCustomizer;
import org.springframework.boot.autoconfigure.SpringBootApplication;
import org.springframework.context.annotation.Bean;

@SpringBootApplication
public class Springboot2demoApplication {

    public static void main(String[] args) {
        SpringApplication.run(Springboot2demoApplication.class, args);
    }

    @Bean
    MeterRegistryCustomizer<MeterRegistry> configurer(
            @Value("${spring.application.name}") String applicationName) {
        return (registry) -> registry.config().commonTags("application", applicationName);
    }
}
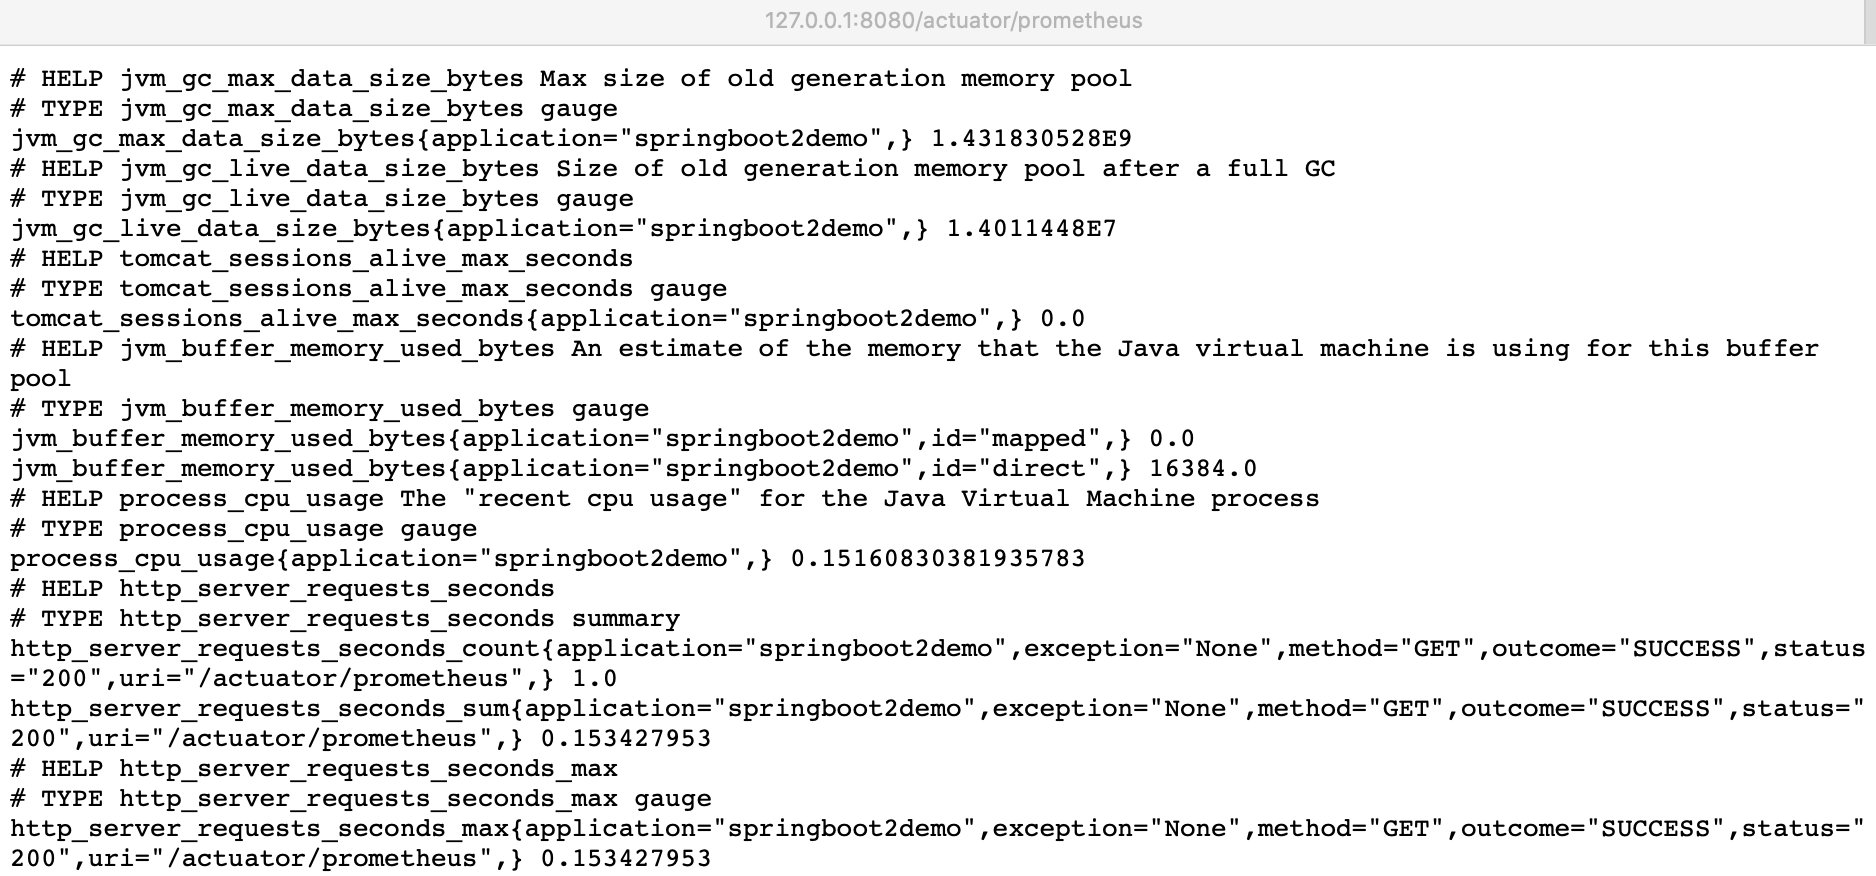
Start the service.
To view monitoring endpoint information:
2. Deploy Prometheus
Official website:
You can download the installation package to install it, but the download speed is extremely slow, and you can hardly download it.
Docker can be used for deployment, because there are docker images in China, so the speed is very fast.
docker mode start:
$ docker run --name prometheus -d -p 127.0.0.1:9090:9090 prom/prometheus
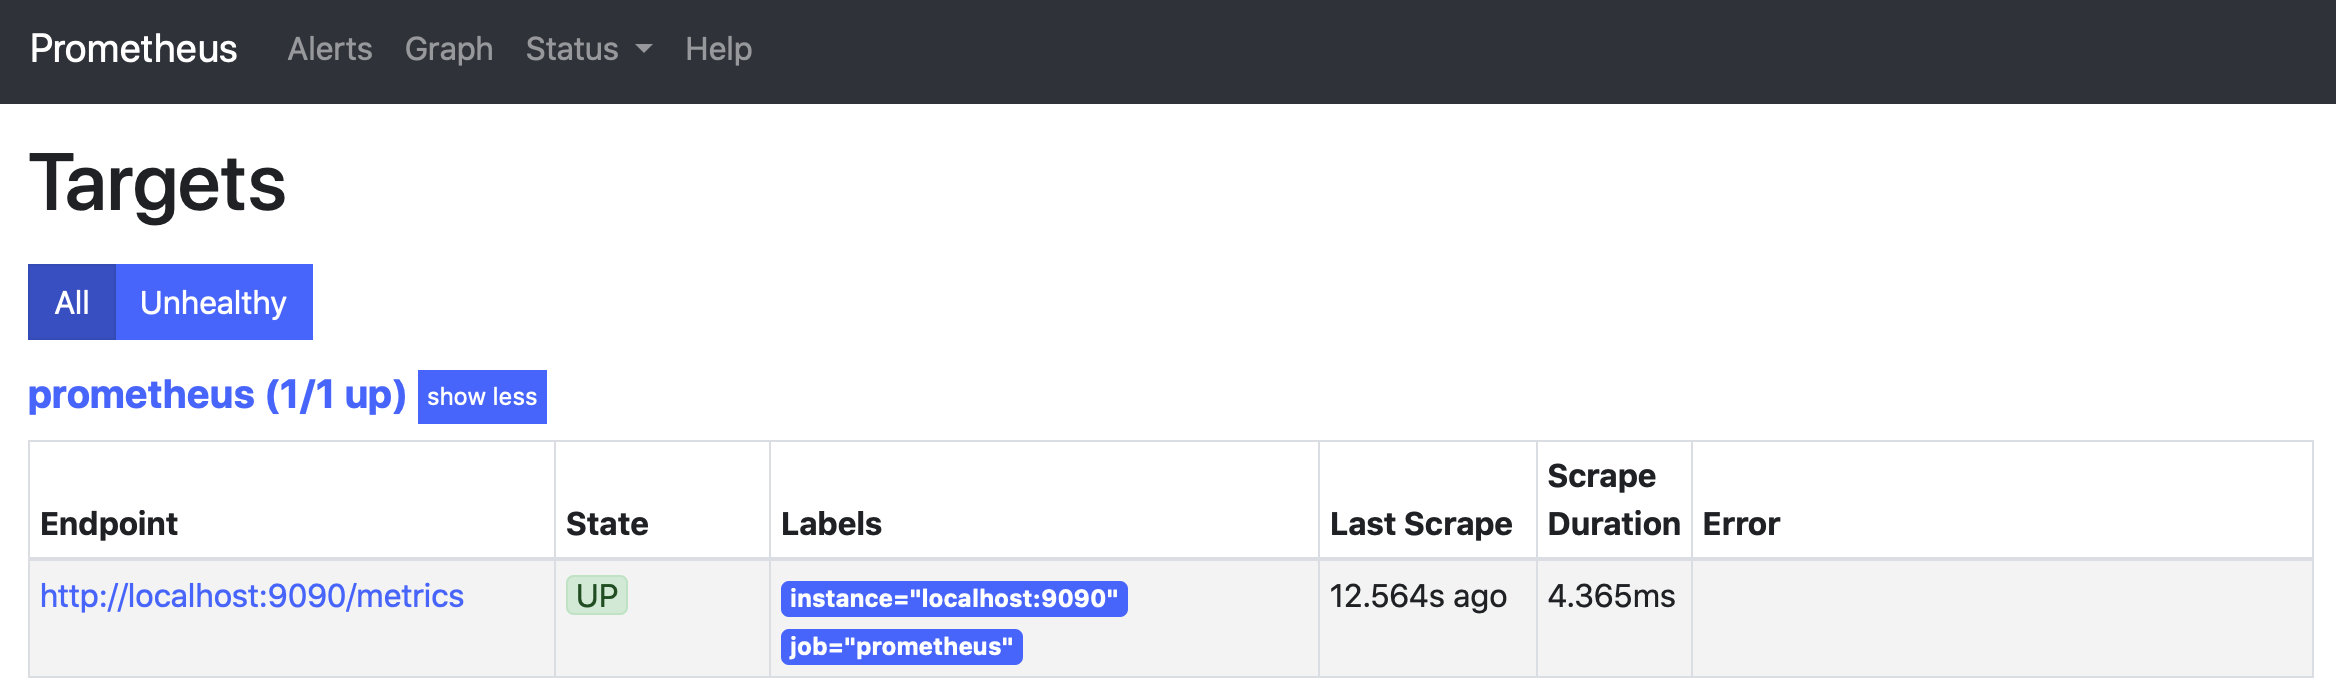
After execution, it is OK. You can see the Prometheus interface.
http://localhost:9090/targets Is the monitoring target list page:
http://localhost:9090/graph It is a query console and also has a simple chart display:
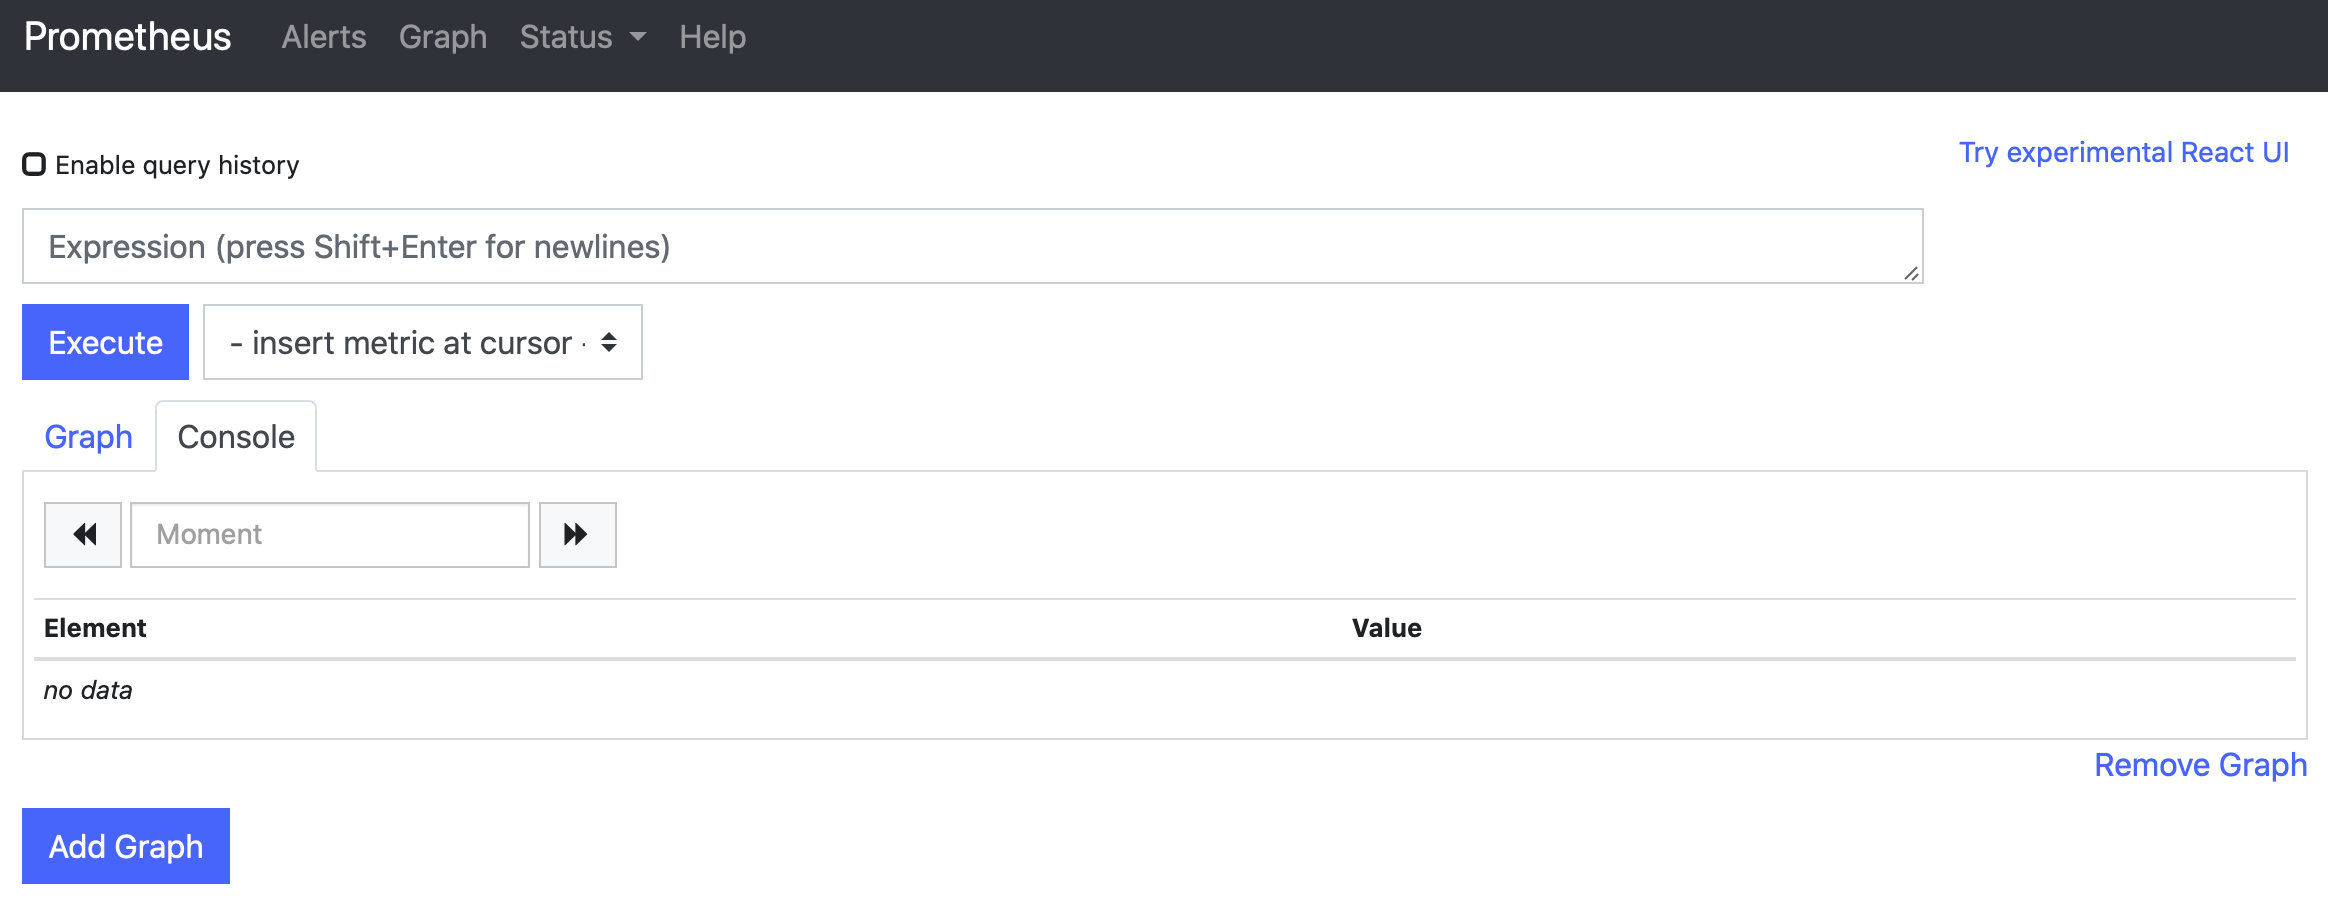
The application has not been docked yet. You can see the details after docking.
3. Prometheus + Springboot application
To monitor applications, you need to add application related information to the Prometheus configuration file.
The path of the configuration file in the container: / etc/prometheus.
View the default contents of the profile:
$ docker exec -it [container ID] cat /etc/prometheus/prometheus.yml
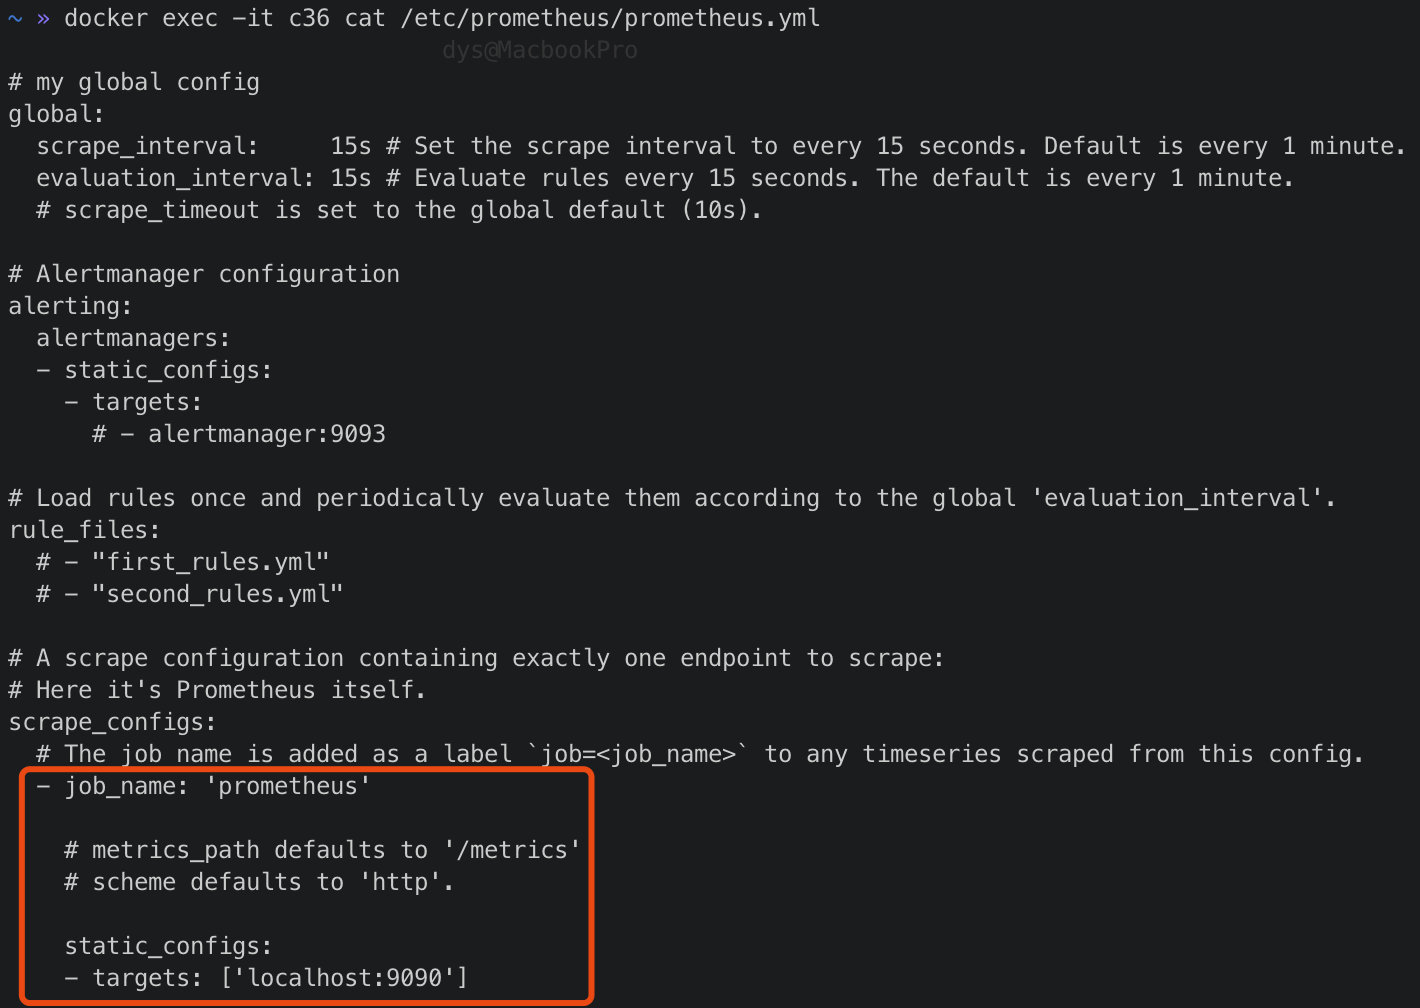
The red box is the part we want to focus on. Just add our application according to this form.
The content to be added is:
  - job_name: 'springboot_app'
    scrape_interval: 5s
    metrics_path: '/actuator/prometheus'
    static_configs:
      - targets: ['192.168.31.6:8080']
        "labels": {
            "instance": "springboot2-A",
            "service": "springboot2-A-service"
        }
Metrics > Path specifies the path to the monitoring endpoint.
targets specifies the IP port of the application. IP is used instead of localhost, because Prometheus is run by the container. If localhost is used, it will access the inside of the container.
Configuration is not modified directly inside the container. You can copy the configuration file inside the container. After modification, restart the container and mount the locally modified configuration file.
Copy profile in container:
$ docker cp [container ID]:/etc/prometheus/prometheus.yml .
Modify the configuration file, add the configuration, and the final content:
# my global config
global:
  scrape_interval:     15s # Set the scrape interval to every 15 seconds. Default is every 1 minute.
  evaluation_interval: 15s # Evaluate rules every 15 seconds. The default is every 1 minute.
  # scrape_timeout is set to the global default (10s).

# Alertmanager configuration
alerting:
  alertmanagers:
  - static_configs:
    - targets:
      # - alertmanager:9093

# Load rules once and periodically evaluate them according to the global 'evaluation_interval'.
rule_files:
  # - "first_rules.yml"
  # - "second_rules.yml"

# A scrape configuration containing exactly one endpoint to scrape:
# Here it's Prometheus itself.
scrape_configs:
  # The job name is added as a label `job=<job_name>` to any timeseries scraped from this config.
  - job_name: 'prometheus'

    # metrics_path defaults to '/metrics'
    # scheme defaults to 'http'.

    static_configs:
    - targets: ['localhost:9090']

  - job_name: 'springboot_app'
    scrape_interval: 5s
    metrics_path: '/actuator/prometheus'
    static_configs:
      - targets: ['192.168.31.6:8080']
        "labels": {
            "instance": "springboot2-A",
            "service": "springboot2-A-service"
        }
Stop the previous container and restart:
$ docker run --name prometheus -d \
    -p 9090:9090 \
    -v [PATH]/prometheus.yml:/etc/prometheus/prometheus.yml \
    prom/prometheus
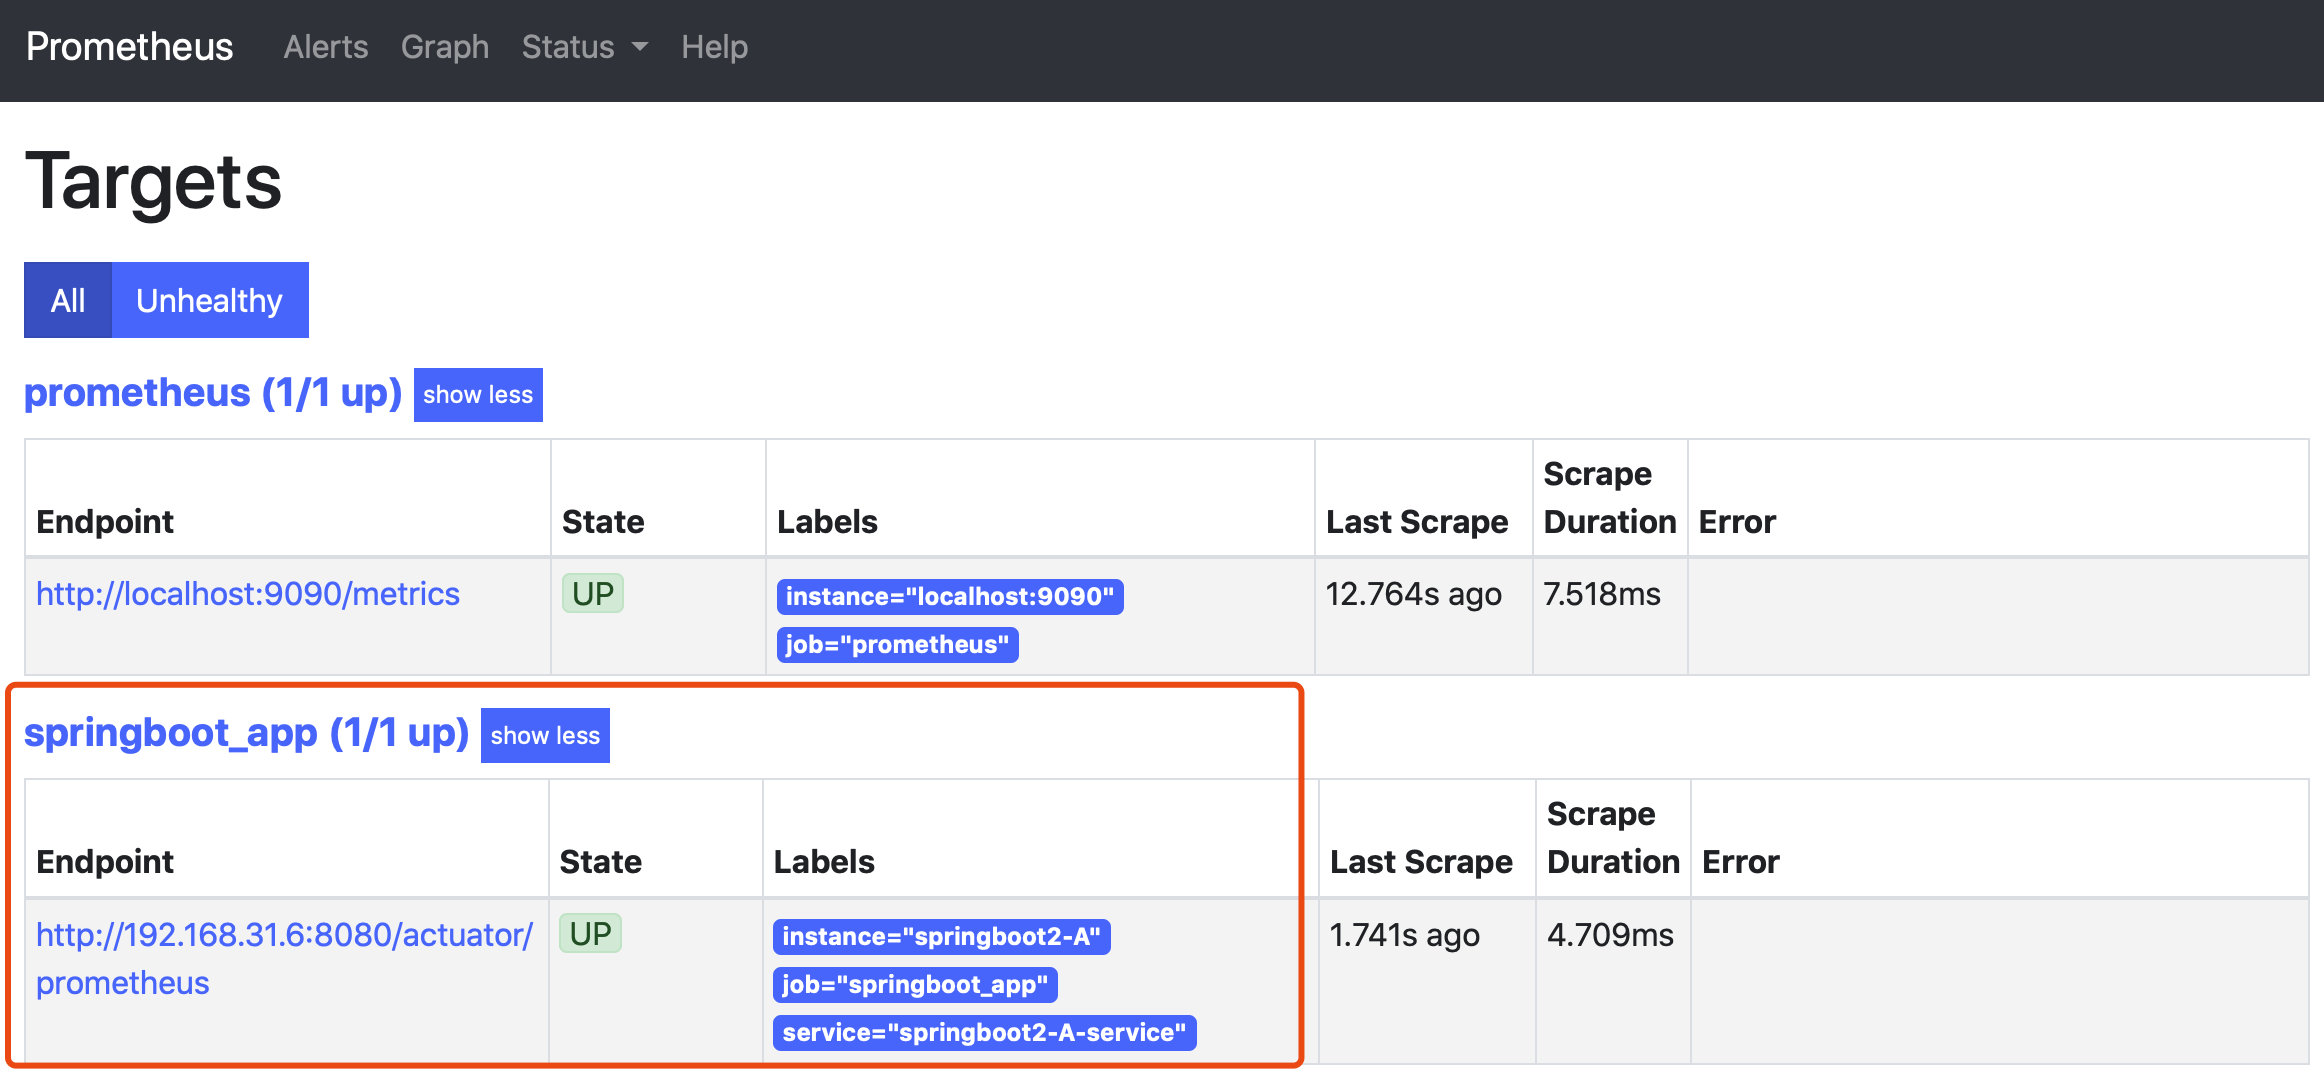
Access the monitoring list page http://localhost:9090/targets You can see our application:
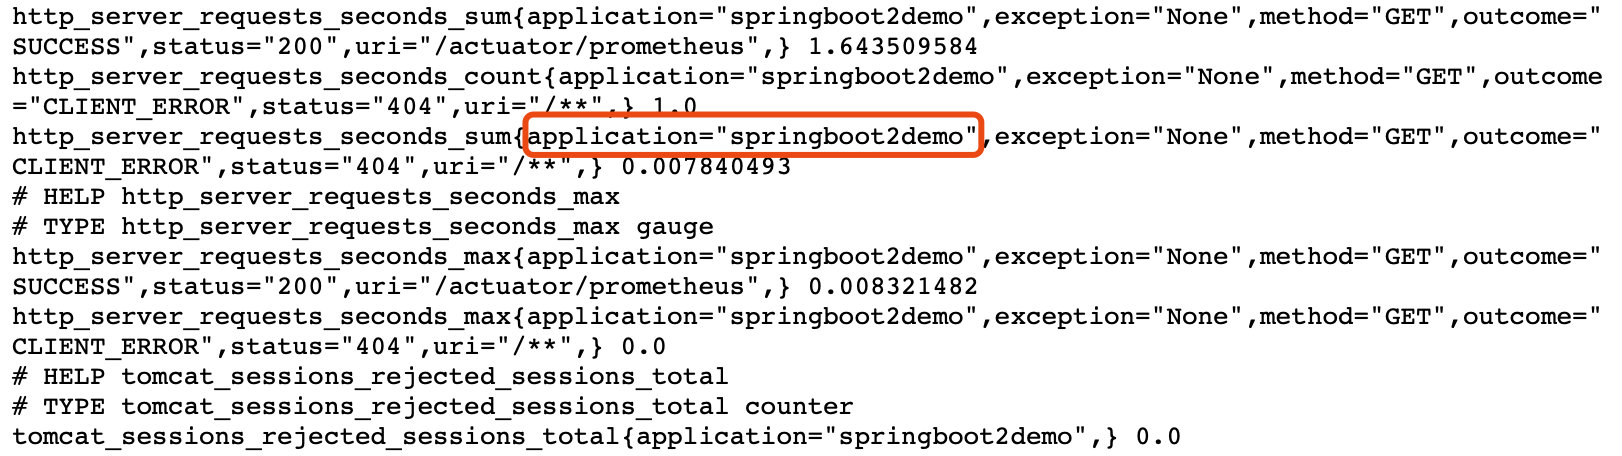
Click the endpoint link to see the monitoring data, for example:
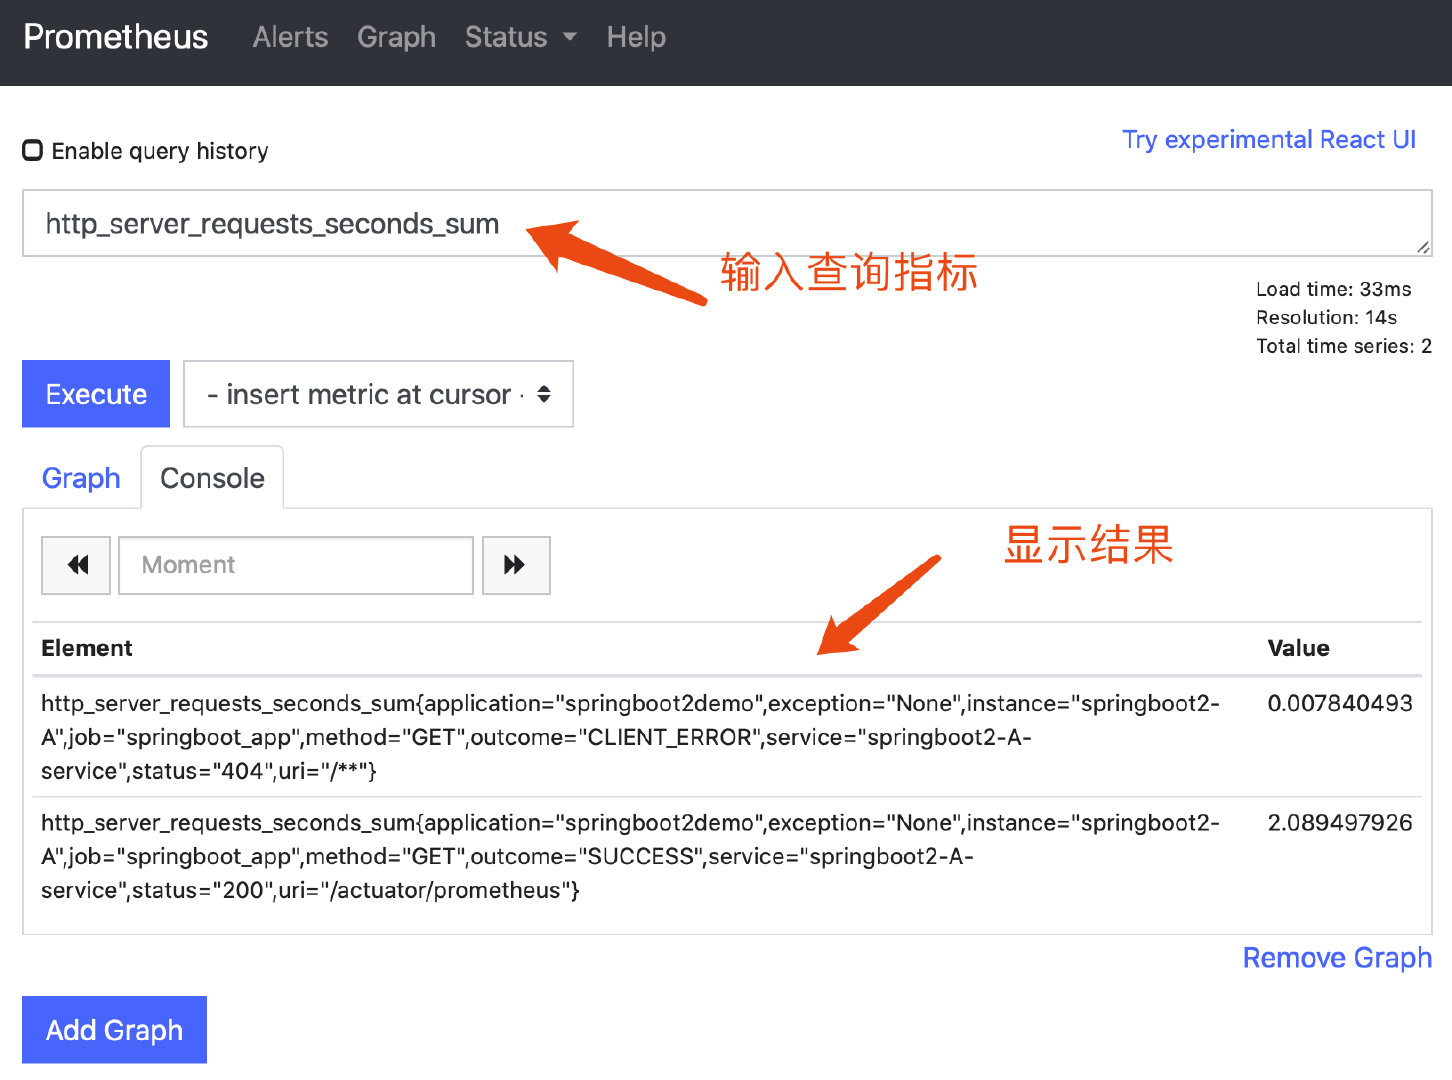
Enter the query console page http://localhost:9090/graph You can query an indicator, such as HTTP server requests seconds sum
4. Deploy Grafana
docker mode operation:
$ docker run -d \
    -p 3000:3000 \
    --name=grafana \
    grafana/grafana
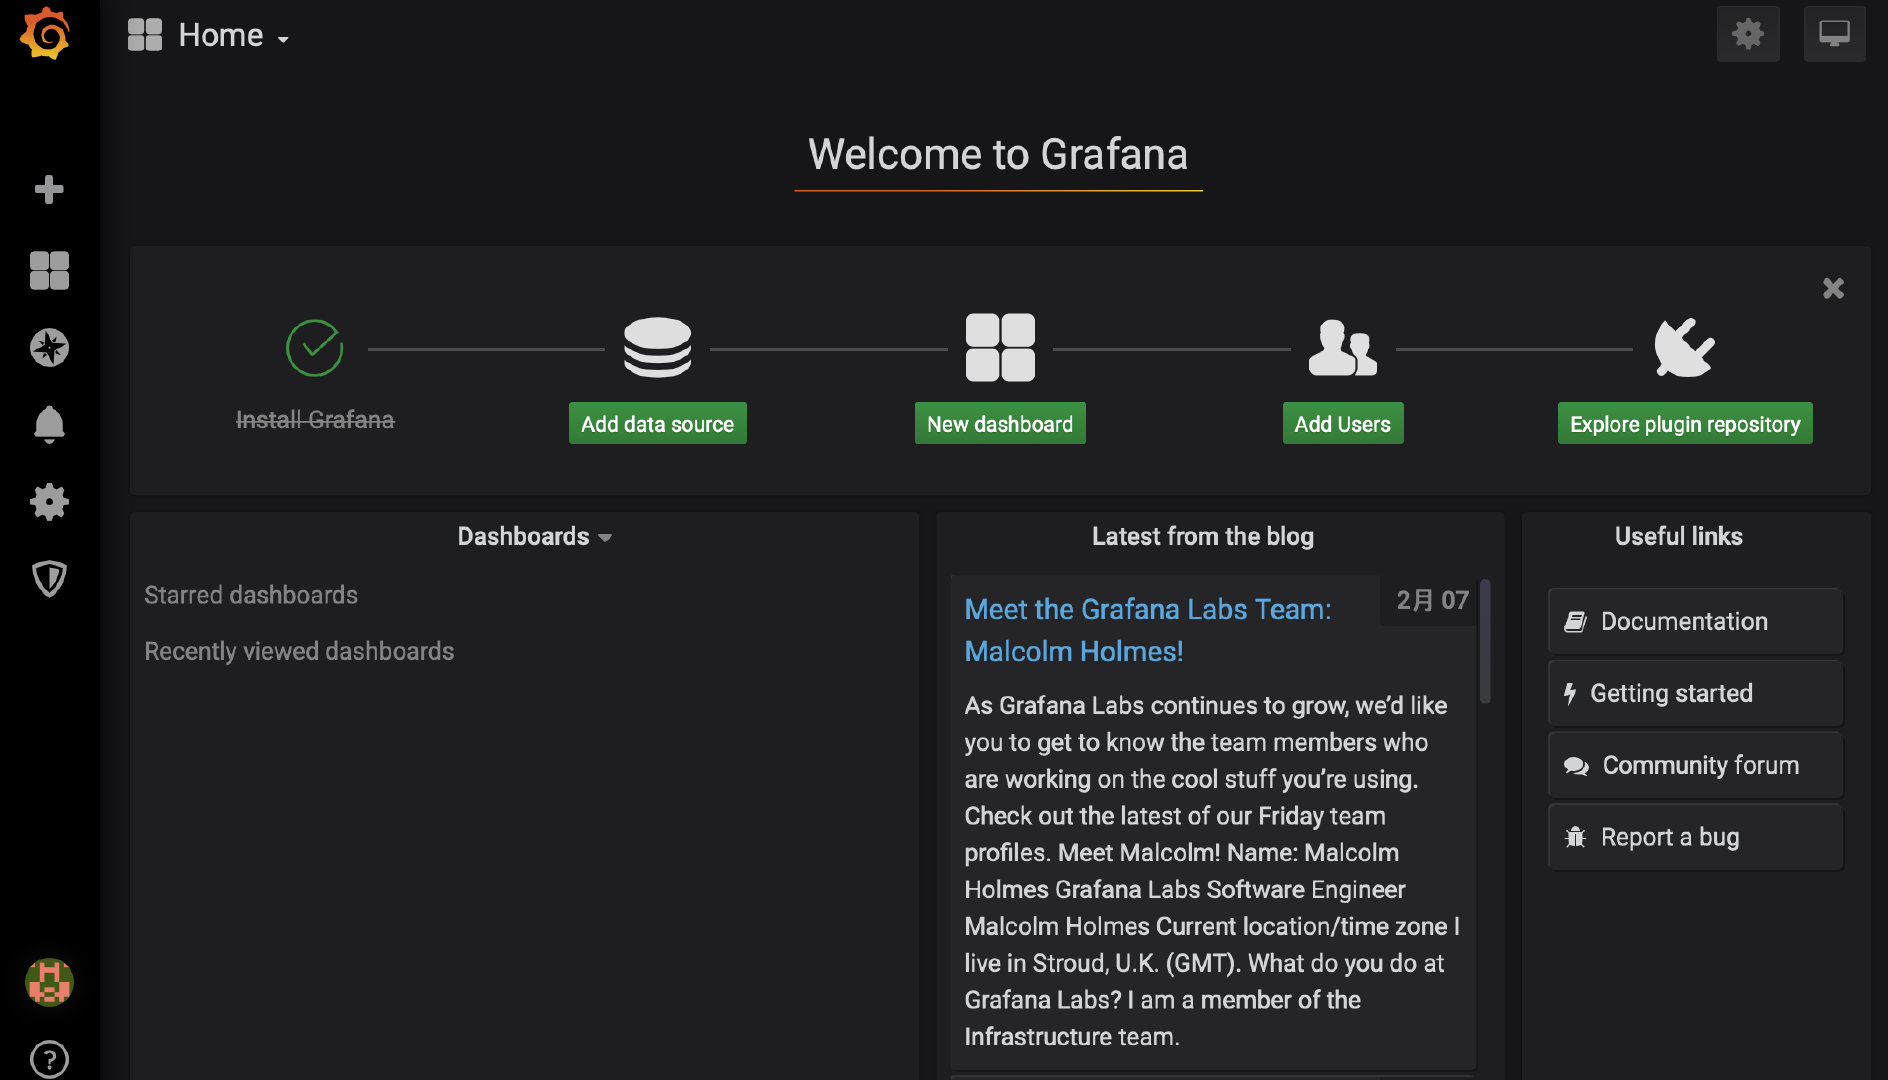
After startup, access: http://localhost:3000 , the default username password is admin/admin.
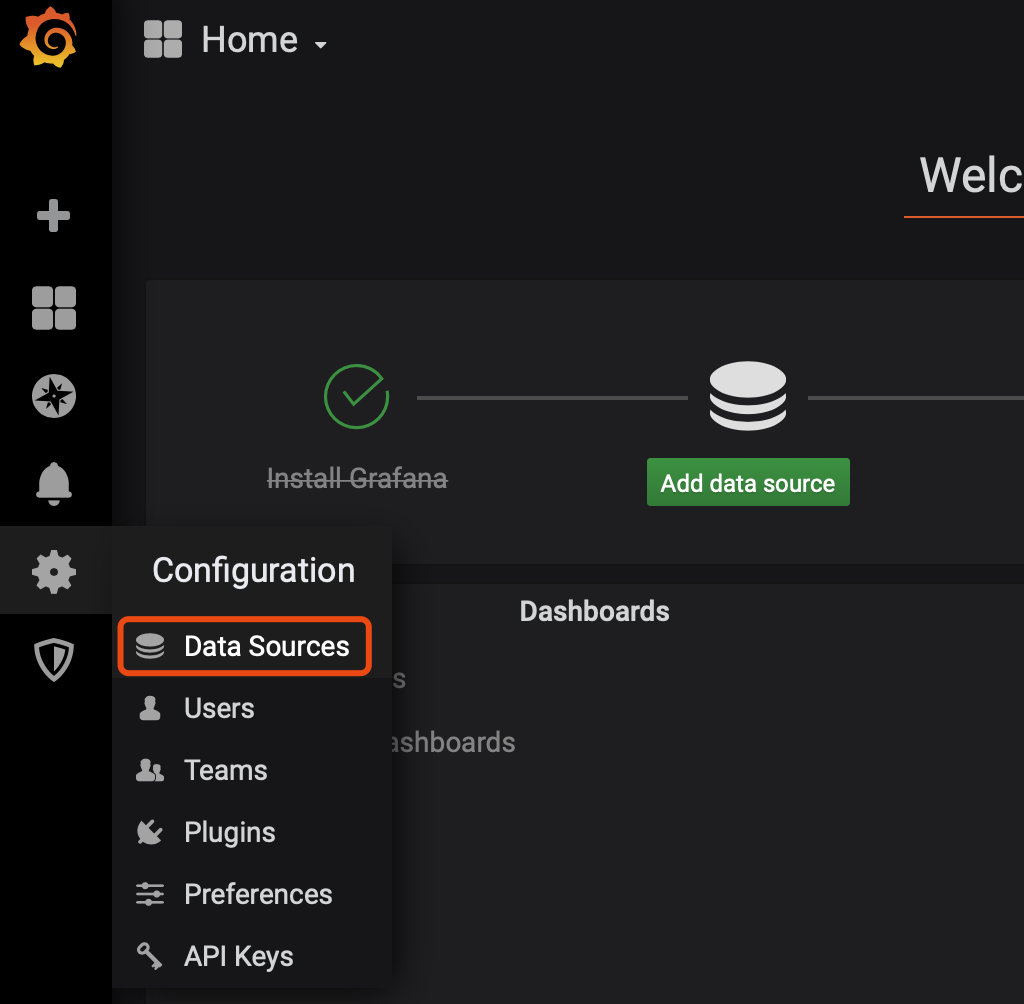
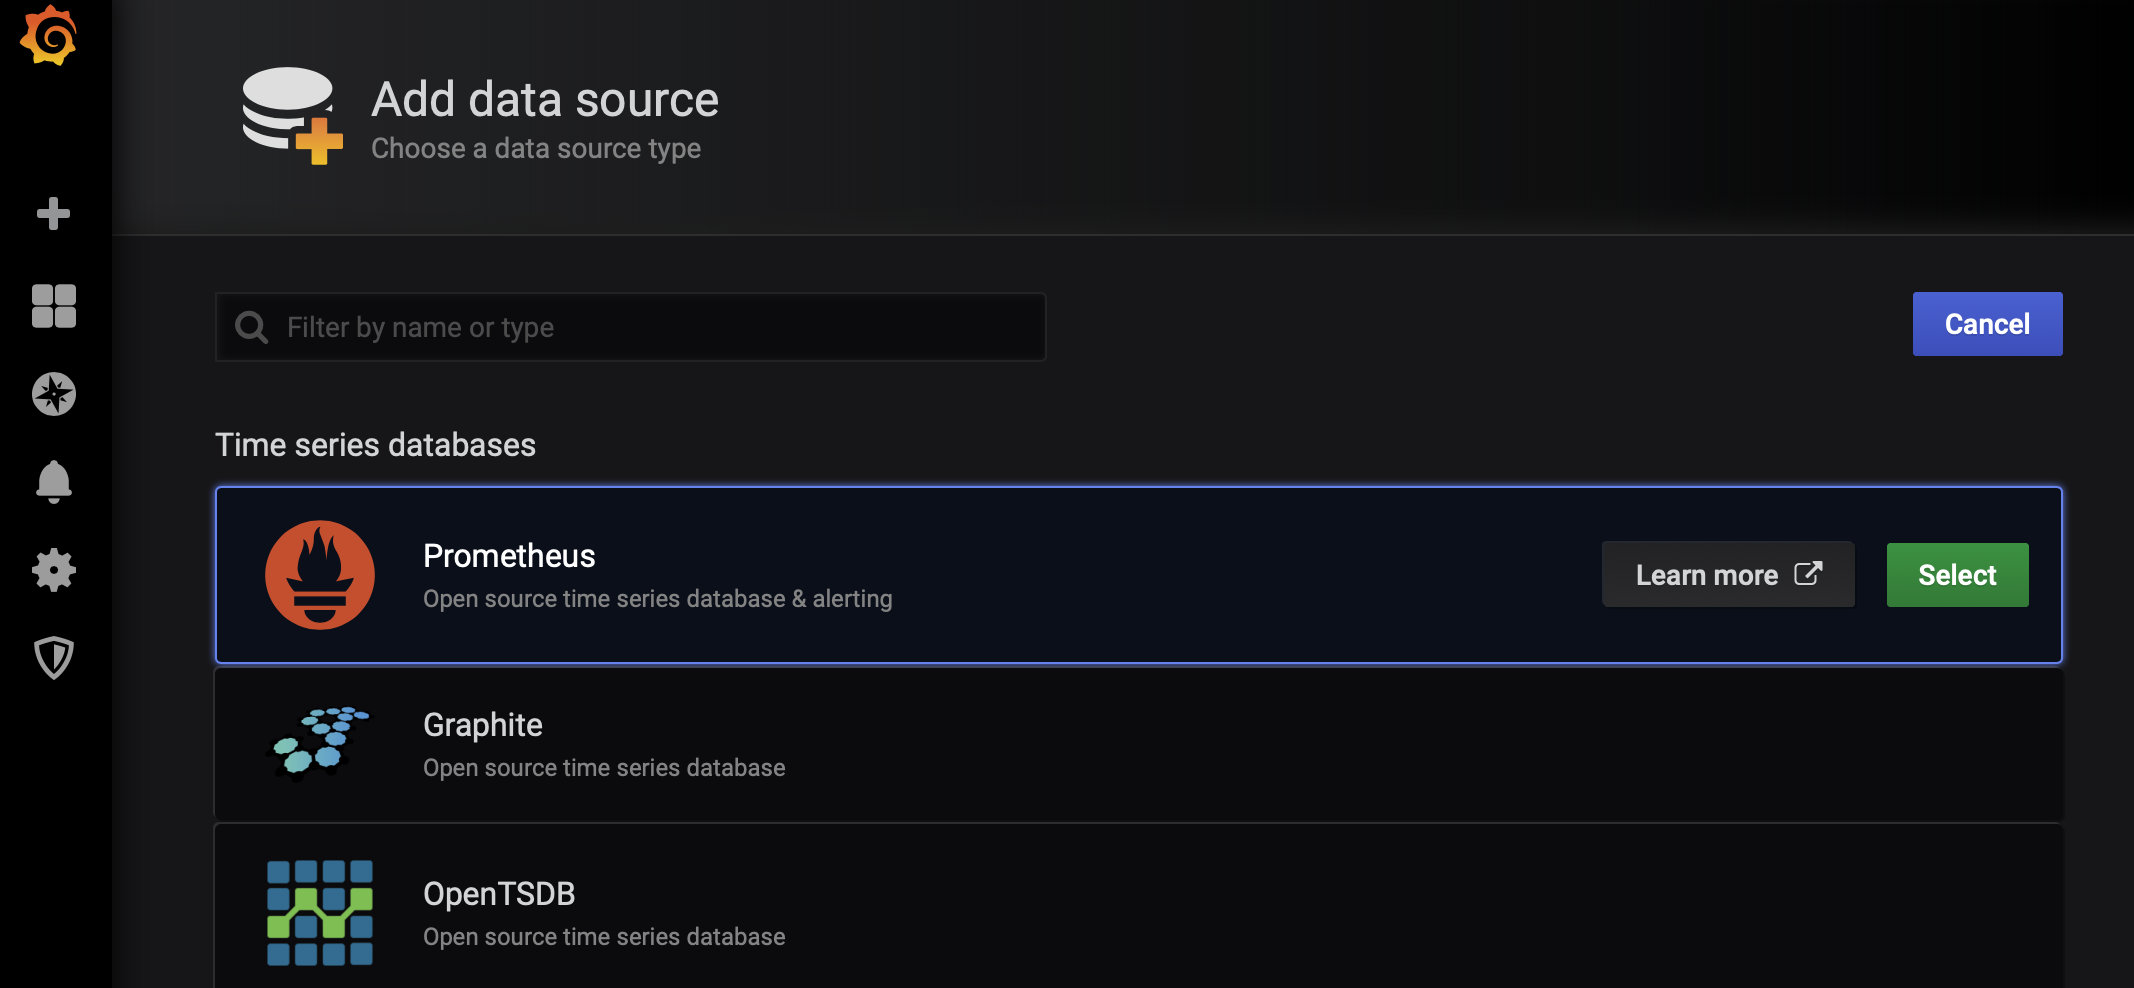
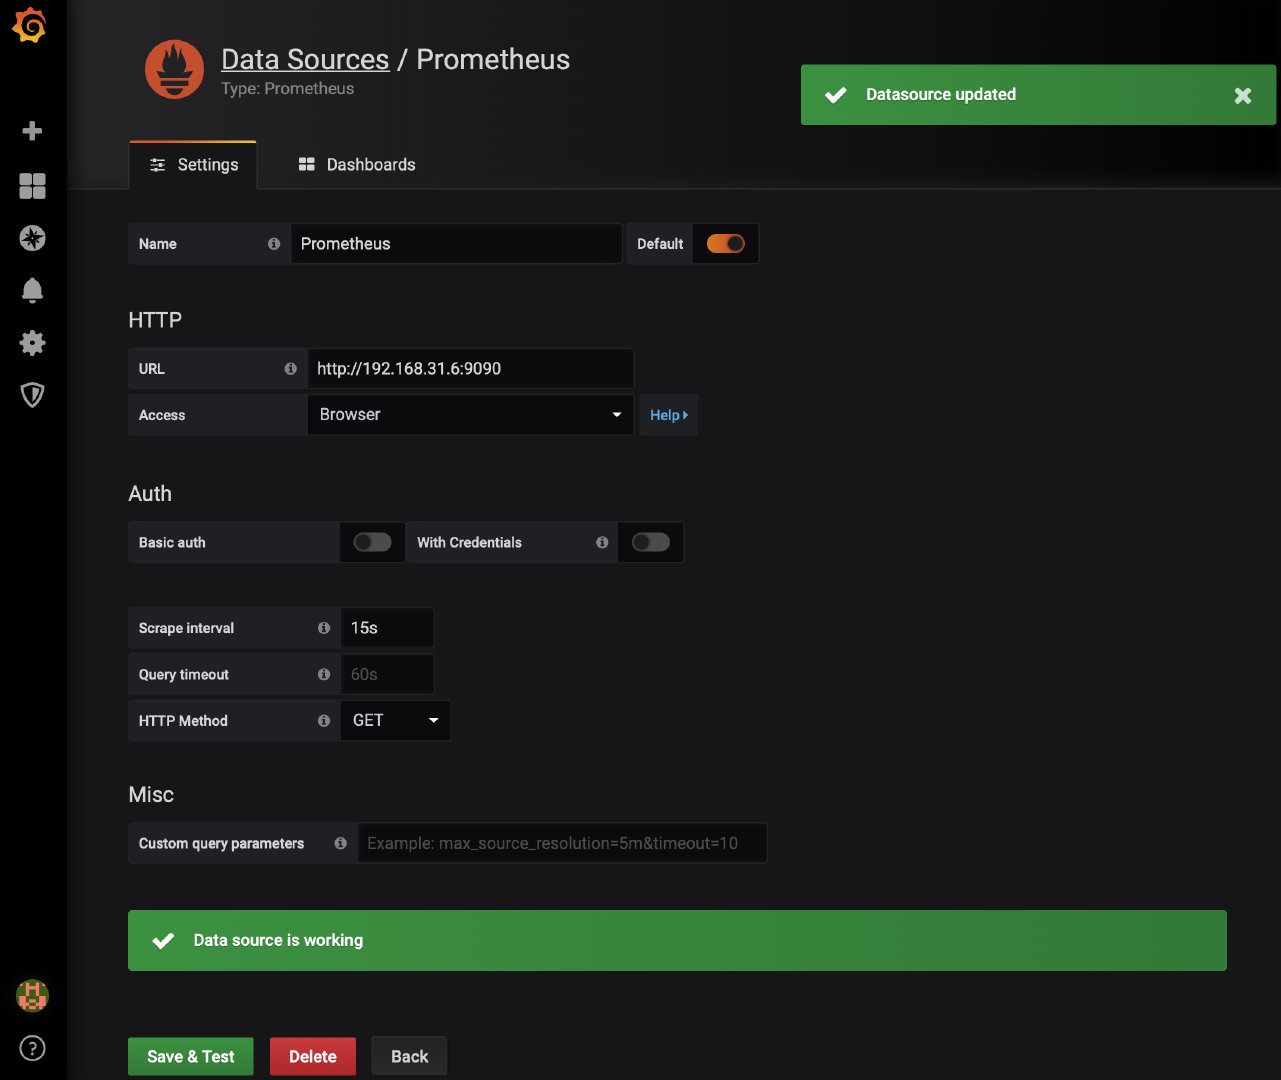
5. Add Prometheus data source
6. Display the JVM information of the application
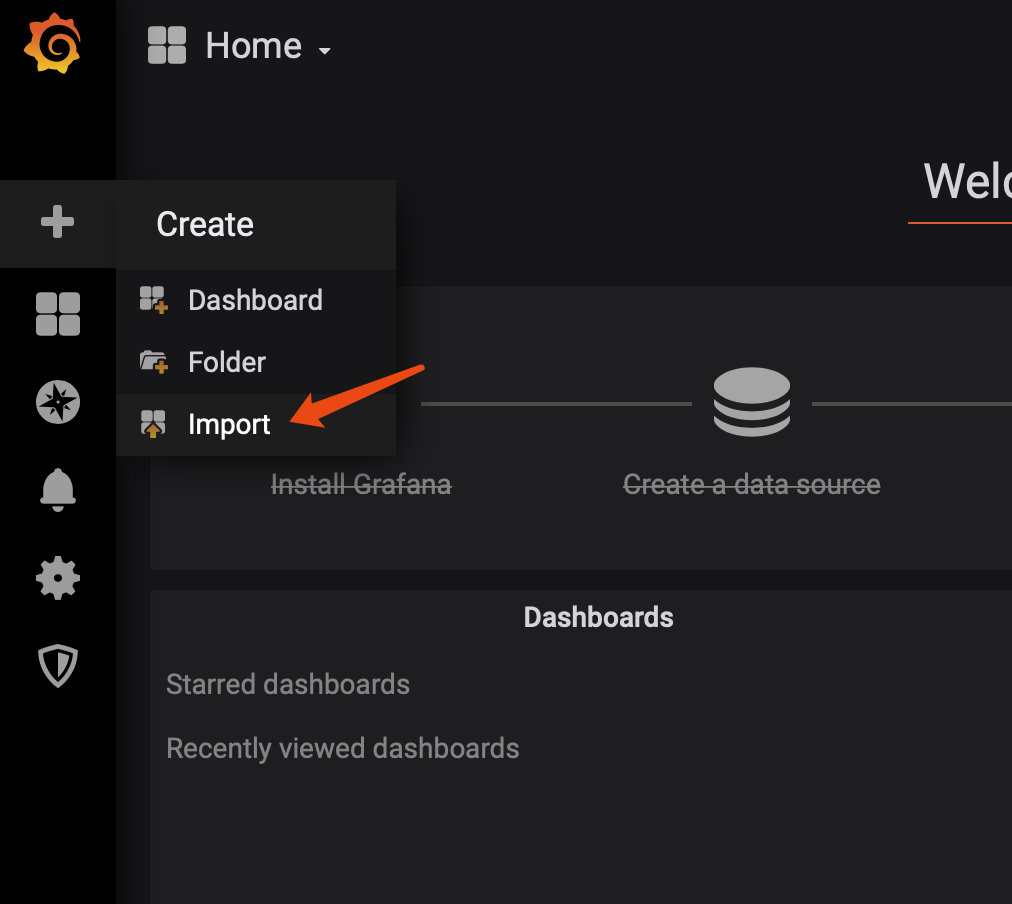
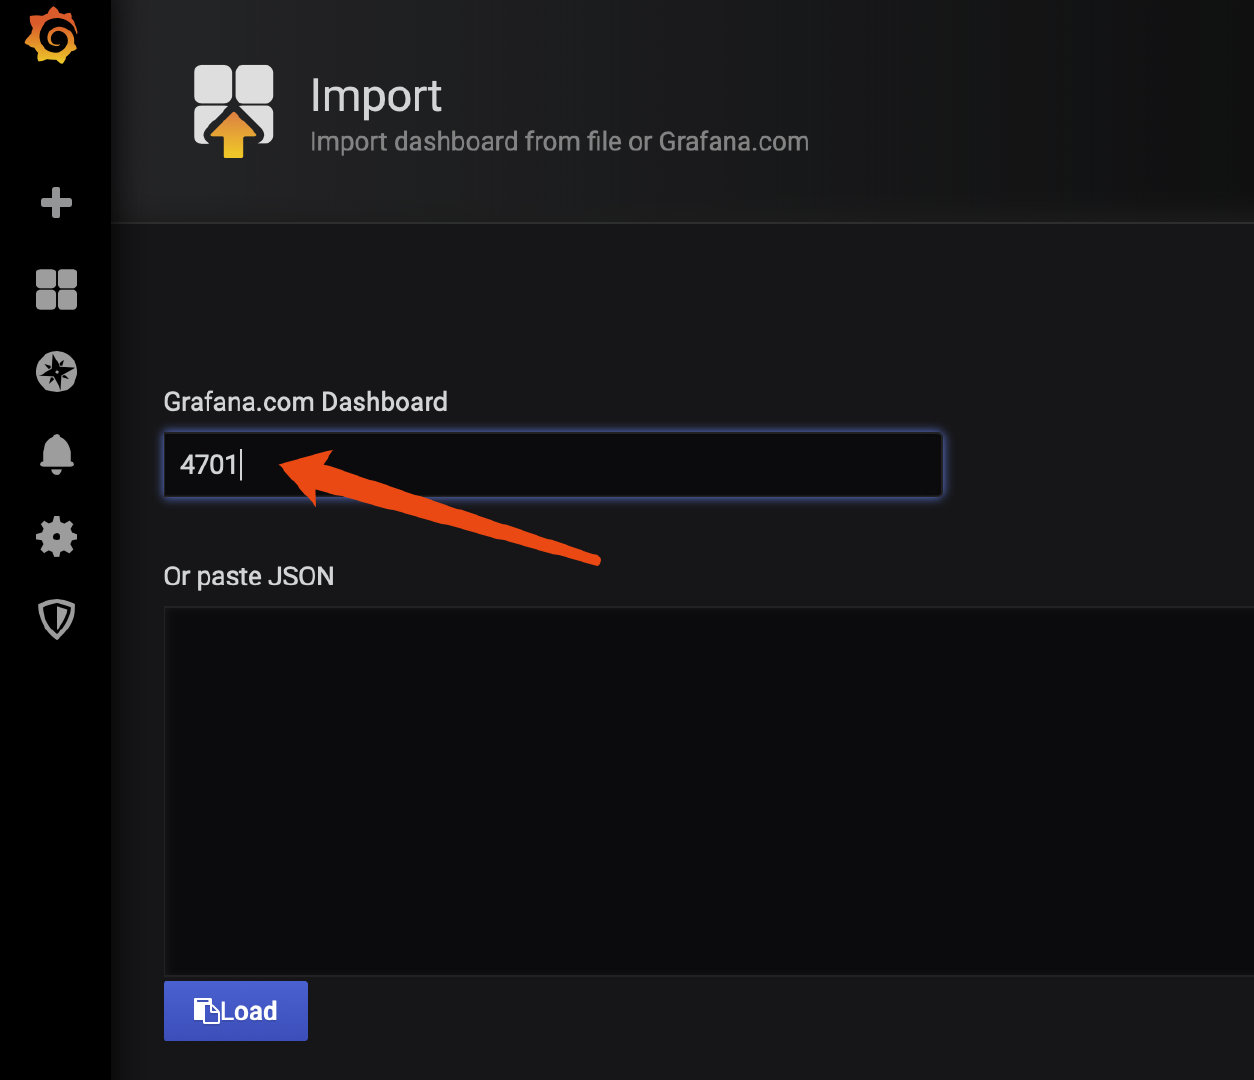
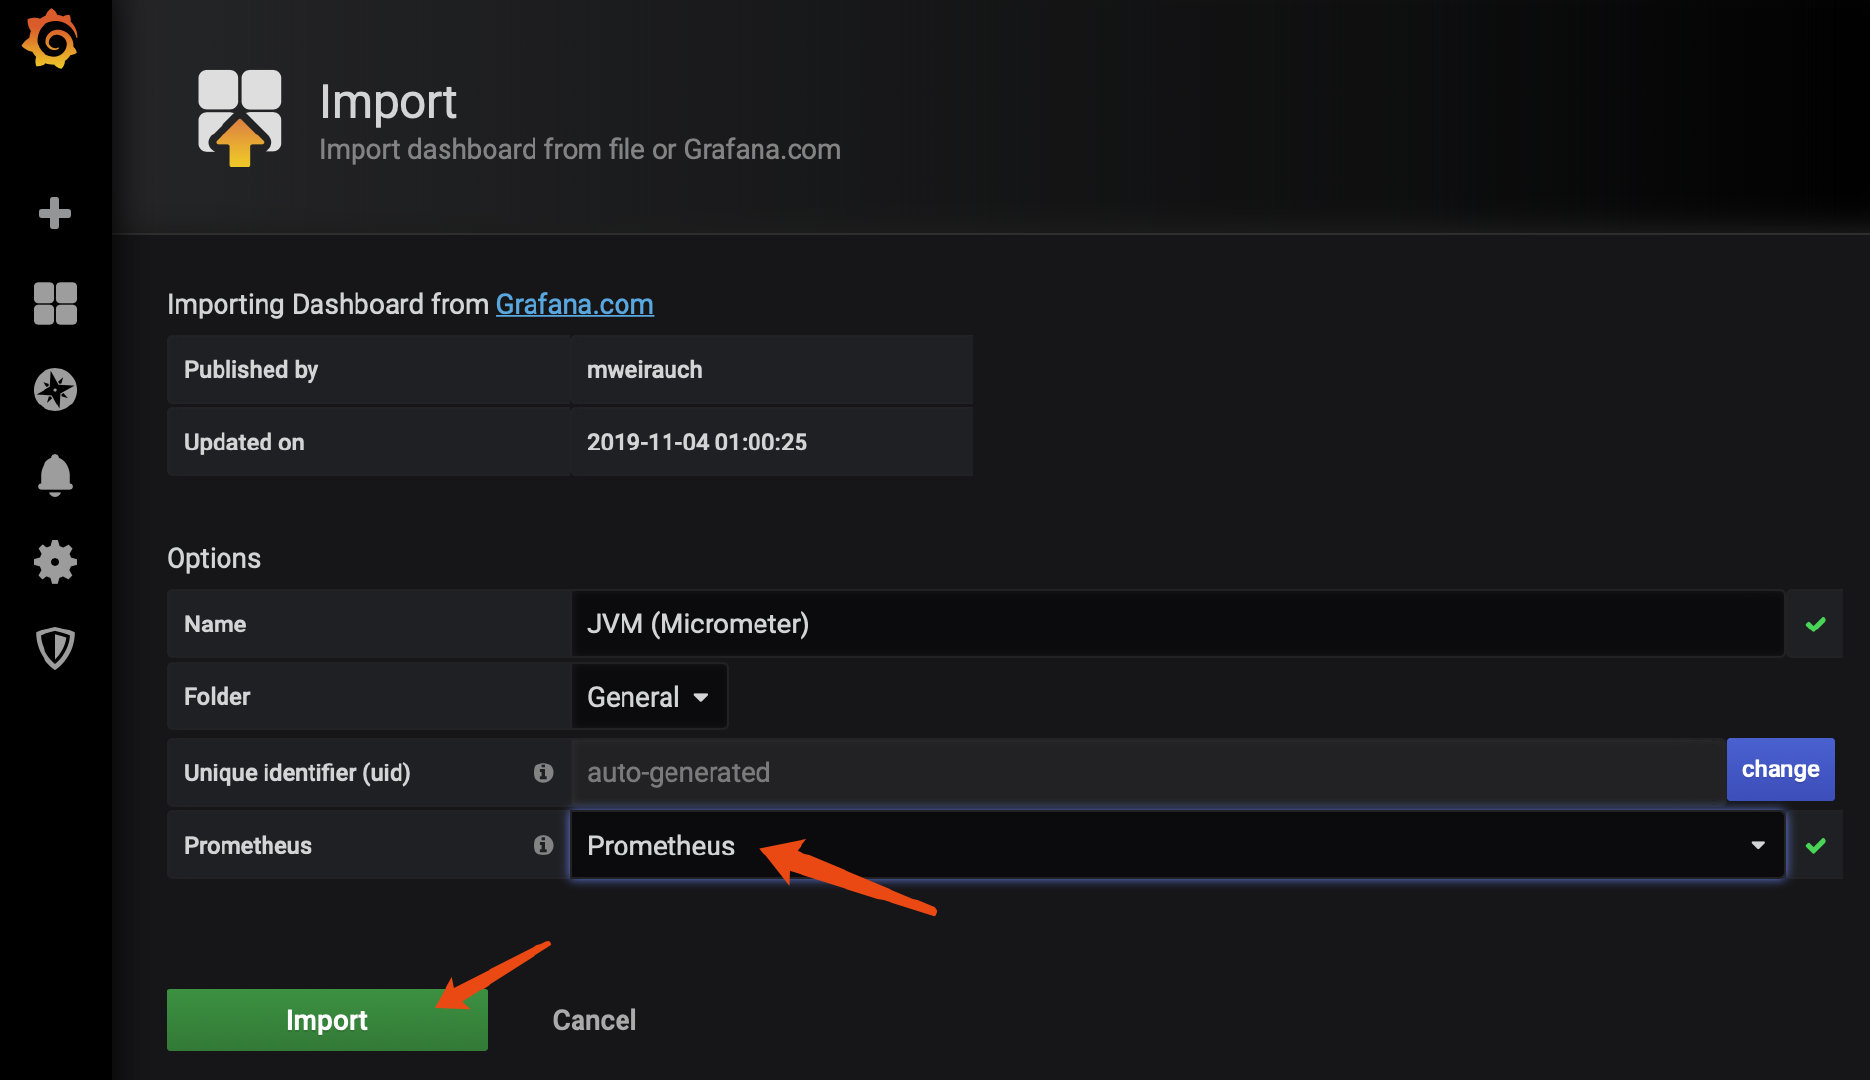
There are already JVM dashboards in Grafana. We can import them directly for use.
This dashboard is numbered 4701.
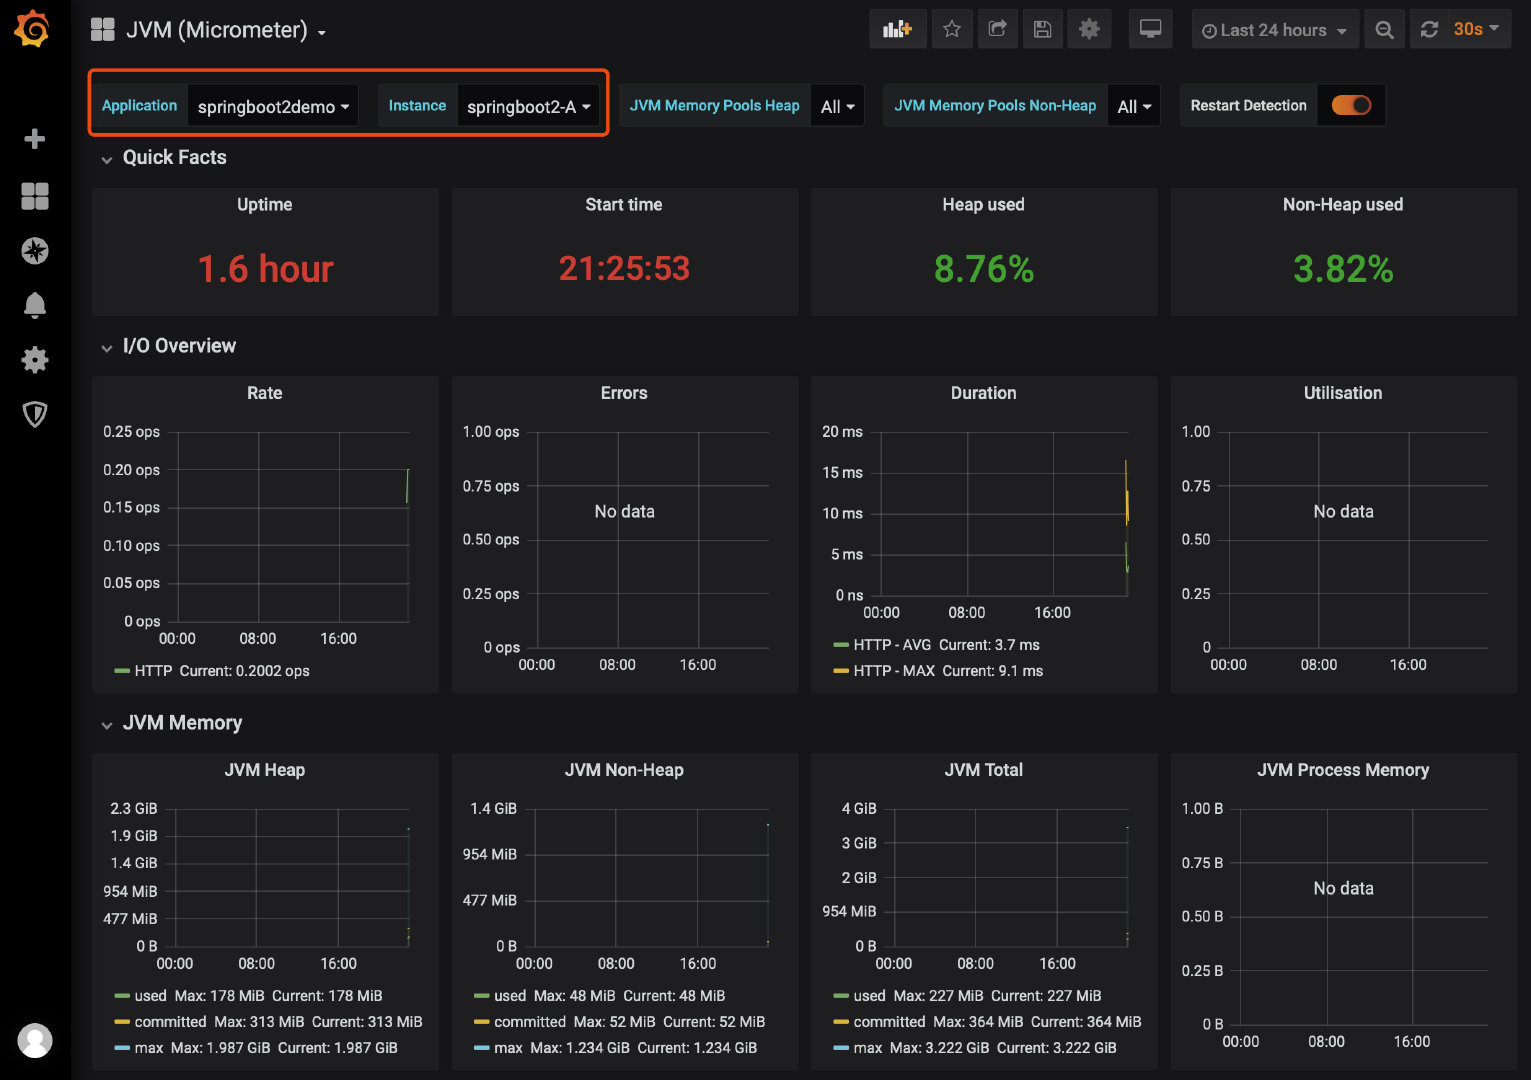
So far, the overall process of Prometheus + Grafana + Springboot has been completed.
However, these indicators are common indicators at the bottom. There must be individual needs at the business level. Let's define some monitoring indicators ourselves.
7. User defined monitoring indicators
Requirement: monitor the number of requests for all interfaces.
Add dependency in app:
		<dependency>
			<groupId>org.aspectj</groupId>
			<artifactId>aspectjrt</artifactId>
			<version>1.9.4</version>
		</dependency>
		<dependency>
			<groupId>org.aspectj</groupId>
			<artifactId>aspectjweaver</artifactId>
			<version>1.9.4</version>
		</dependency>
		<dependency>
			<groupId>cglib</groupId>
			<artifactId>cglib</artifactId>
			<version>3.2.12</version>
		</dependency>
Count interface requests using AOP mode:
package com.example.springboot2demo;

import io.micrometer.core.instrument.Counter;
import io.micrometer.core.instrument.MeterRegistry;
import org.aspectj.lang.JoinPoint;
import org.aspectj.lang.annotation.AfterReturning;
import org.aspectj.lang.annotation.Aspect;
import org.aspectj.lang.annotation.Before;
import org.aspectj.lang.annotation.Pointcut;
import org.springframework.beans.factory.annotation.Autowired;
import org.springframework.stereotype.Component;

import javax.annotation.PostConstruct;

@Component
@Aspect
public class APICounterAop {

    @Pointcut("execution(public * com.example.springboot2demo.*.*(..))")
    public void pointCut() {
    }

    ThreadLocal<Long> startTime = new ThreadLocal<>();

    @Autowired
    MeterRegistry registry;
    private Counter counter;

    @PostConstruct
    private void init() {
        counter = registry.counter("requests_total", "status", "success");
    }

    @Before("pointCut()")
    public void doBefore(JoinPoint joinPoint) throws Throwable {
        System.out.println("do before");
        counter.increment(); //Request count
    }

    @AfterReturning(returning = "returnVal", pointcut = "pointCut()")
    public void doAfterReturning(Object returnVal) {
        System.out.println("do after");
    }
}
Create a test interface:
package com.example.springboot2demo;

import org.springframework.web.bind.annotation.RequestMapping;
import org.springframework.web.bind.annotation.RestController;

@RestController
public class TestController {
    @RequestMapping("/hello")
    public String hello() {
        return "hello";
    }
}
Restart the application, visit the test interface several times, and then check the application monitoring endpoint page in Prometheus to see the monitoring results:
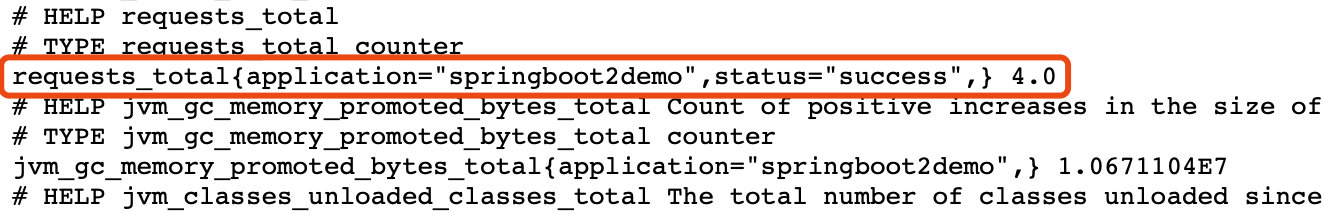
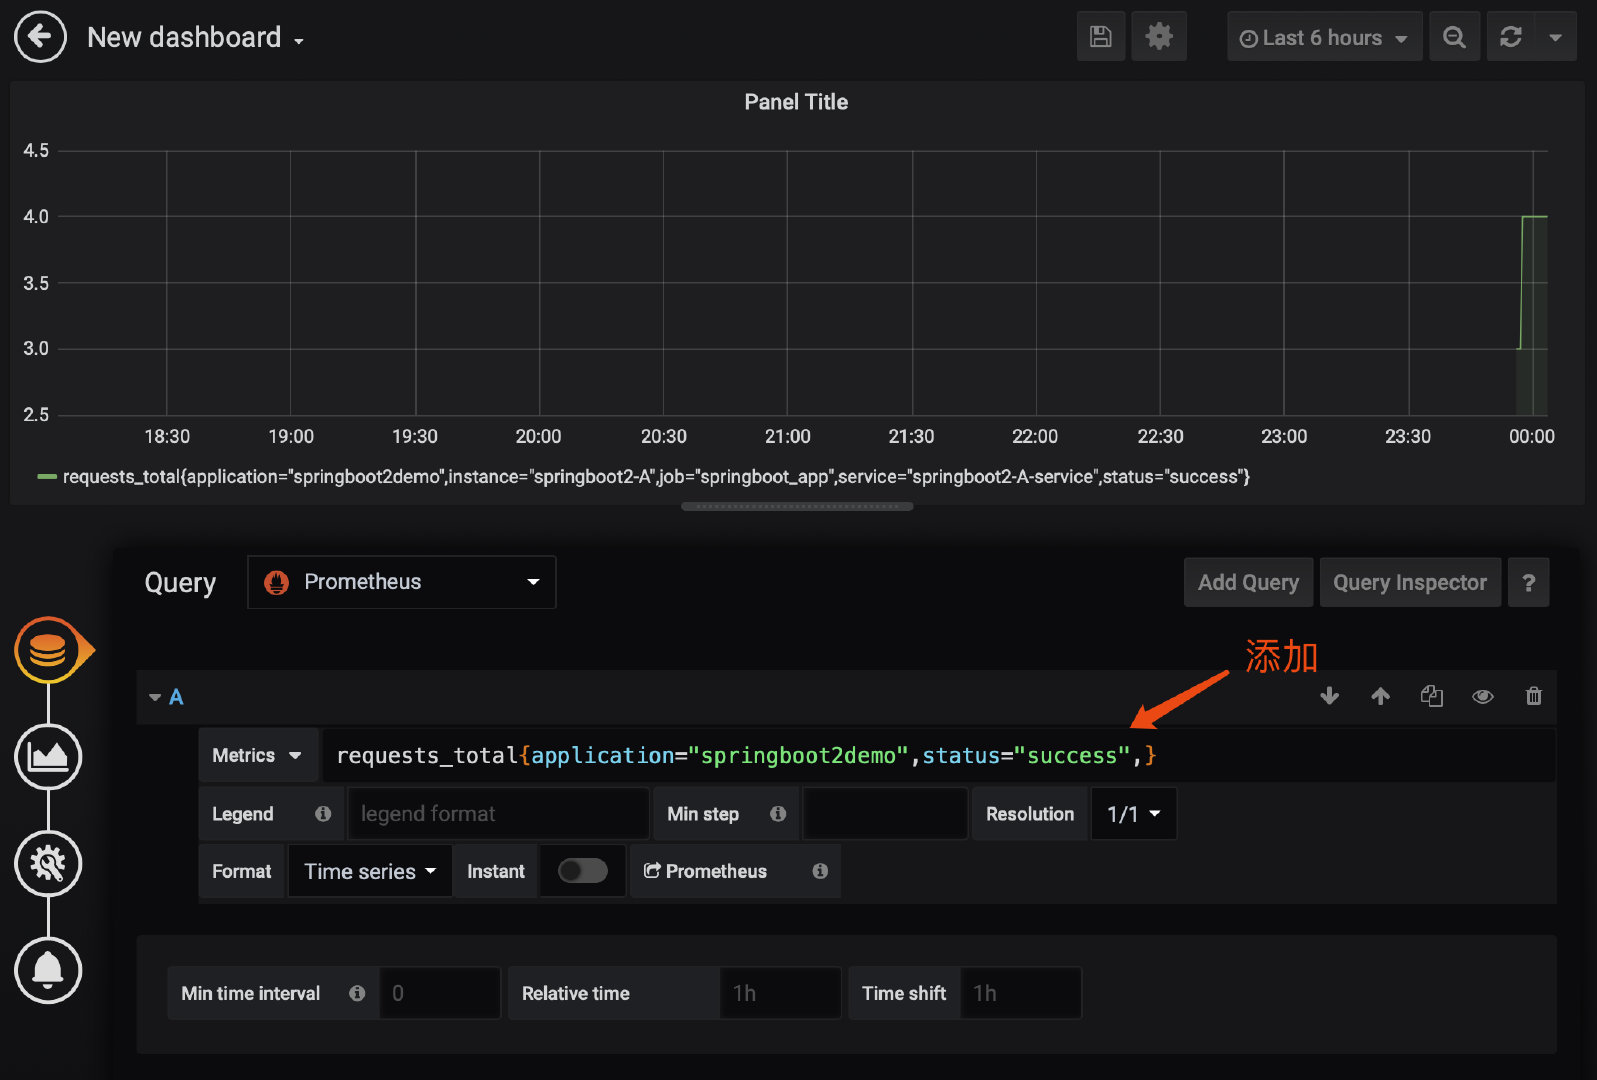
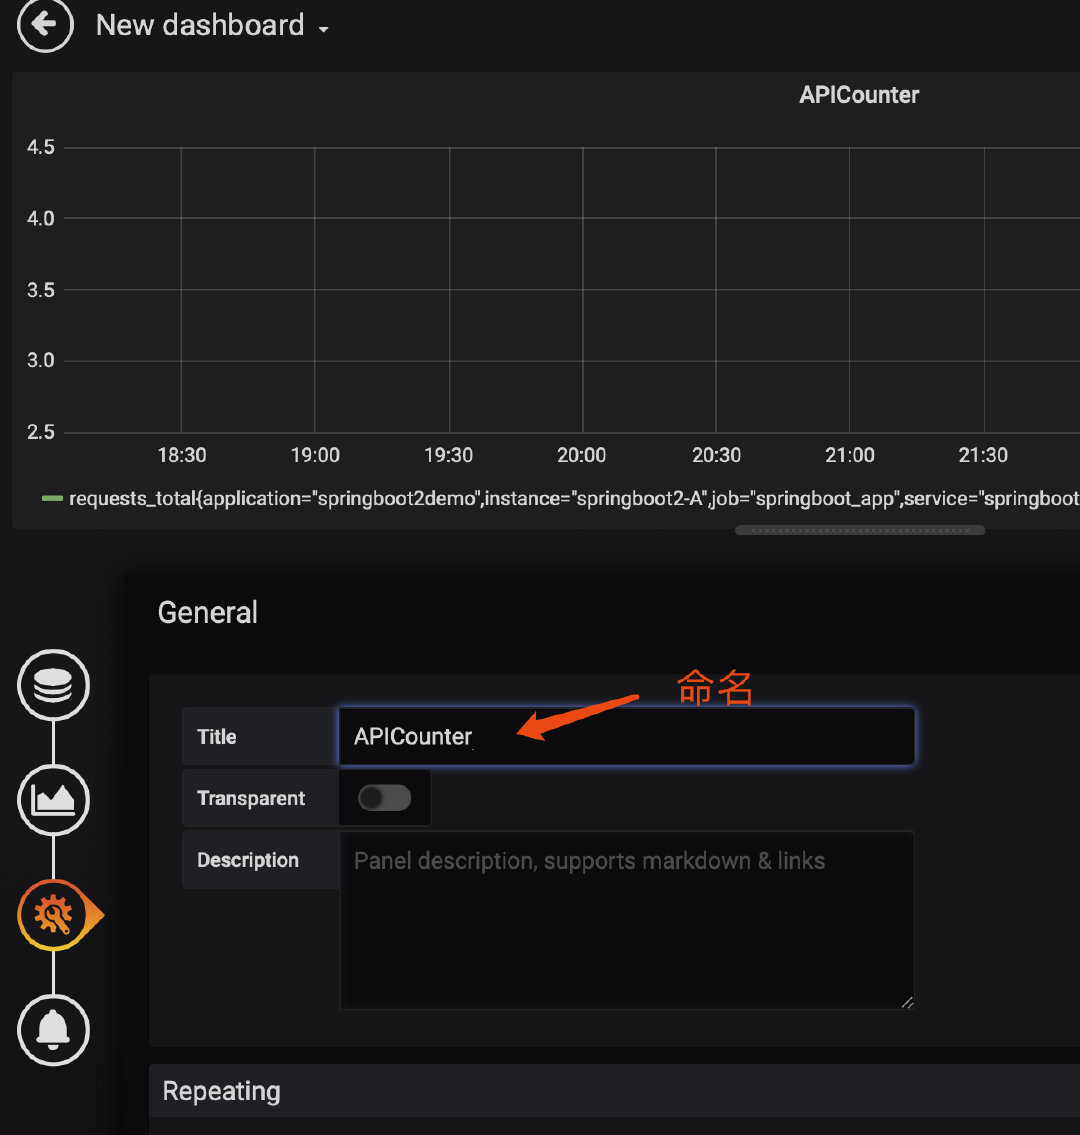
Then, we show this indicator in Grafana.
8. Dynamic change monitoring objectives
The monitoring target defined in the Prometheus configuration file above uses the static mode, and needs to be restarted after the configuration file is changed.
If the service is changed or added, it is not appropriate to restart Prometheus frequently.
Prometheus provides a way of dynamic loading. It puts the service information into a separate file. The external file is specified in Prometheus configuration. When the content changes, Prometheus will automatically reload.
Service information configuration file for example:
[
    {
        "targets": [
            "192.168.31.6:8080"
        ],
        "labels": {
            "instance": "springboot2-A",
            "service": "springboot2-A-service"
        }
    }
]
Write method in Prometheus configuration file:
...
  - job_name: 'springboot_app'
    scrape_interval: 5s
    metrics_path: '/actuator/prometheus'
    file_sd_configs:
    - files:
      - /home/*.json
      refresh_interval: 1m
The directory to mount the service information configuration file when starting the Prometheus container:
$ docker run --name prometheus -d -p 9090:9090 \
	-v [PATH]/prometheus.yml:/etc/prometheus/prometheus.yml \
	-v [PATH]:/home \
	prom/prometheus
Recommended reading:
- Multi activity structure in different places
- Using Canal to realize data heterogeneity
- How does MySQL order by work?
- Alibaba's open source distributed transaction framework, Seata
- Generation scheme of distributed unique ID