"🙊🙊🙊This tutorial is experimental and unsupported."
Classic Answer to Last Homework
- Question: What are the common garbage collectors in Java?
In fact, Garbage Collector is closely related to specific JVM implementations. Different vendors (IBM, Oracle) and different versions of JVM offer different choices. Next, let me talk about the most mainstream Oracle JDK.
- Serial GC, which is the oldest garbage collector, "Serial" is reflected in its single-threaded collection work, and in the process of garbage collection, will enter the notorious "Stop-The-World" state. Of course, its single-threaded design also means a streamlined GC implementation, no need to maintain complex data structures, and simple initialization, so it has always been the default option of JVM in Client mode. From the perspective of age, the old generation implementation is usually called Serial Old alone. It adopts Mark-Compact algorithm, which is different from the new generation replication algorithm.
-XX:UseSerialGC
- ParNew GC, apparently a new generation of GC implementation, is actually a multi-threaded version of Serial GC. The most common scenario is to work with CMS GC of the older generation. Here are the corresponding parameters
-XX:+UseConcMarkSweepGC -XX:+UseParNewGC
CMS (Concurrent Mark Sweep) GC, based on Mark-Sweep (Mark-Sweep) algorithm, is designed to minimize pause time, which is very important for Web and other time-sensitive applications. Until today, many systems still use CMS GC. However, the mark-sweep algorithm adopted by CMS has the problem of memory fragmentation, so it is difficult to avoid the occurrence of full GC under long running conditions, resulting in bad pause. In addition, since concurrency is emphasized, CMS will occupy more CPU resources and compete with user threads.
Parrallel GC, in earlier versions such as JDK 8, was the default GC choice for server mode JVM, also known as throughput-first GC. Its algorithm is similar to Serial GC, although its implementation is much more complex. Its characteristic is that both the new generation and the old generation GC are carried out in parallel and are more efficient in common server environments.
-XX:+UseParallelGC

// Parallel GC introduces a developer-friendly configuration item that allows us to set pause times or throughput targets directly.
-XX:MaxGCPauseMillis=value
-XX:GCTimeRatio=N // GC time to user time ratio = 1 / N + 1
- G1 GC is a GC implementation that takes into account both throughput and pause time. It is the default GC option after Oracle JDK 9. G1 can set the target of pause time intuitively. Compared with CMS GC, G1 may not be able to achieve the delayed pause of CMS in the best case, but the worst case is much better. G1 GC still has the concept of age, but its memory structure is not a simple strip division, but a chessboard-like Region. Regions are replication algorithms, but as a whole, they can be regarded as Mark-Compact algorithms, which can effectively avoid memory fragmentation, especially when the Java heap is very large, the advantage of G1 is more obvious.
Derived interview questions:
- What are the garbage collection algorithms? How to determine whether an object can be recycled?
- The basic process of garbage collector work.
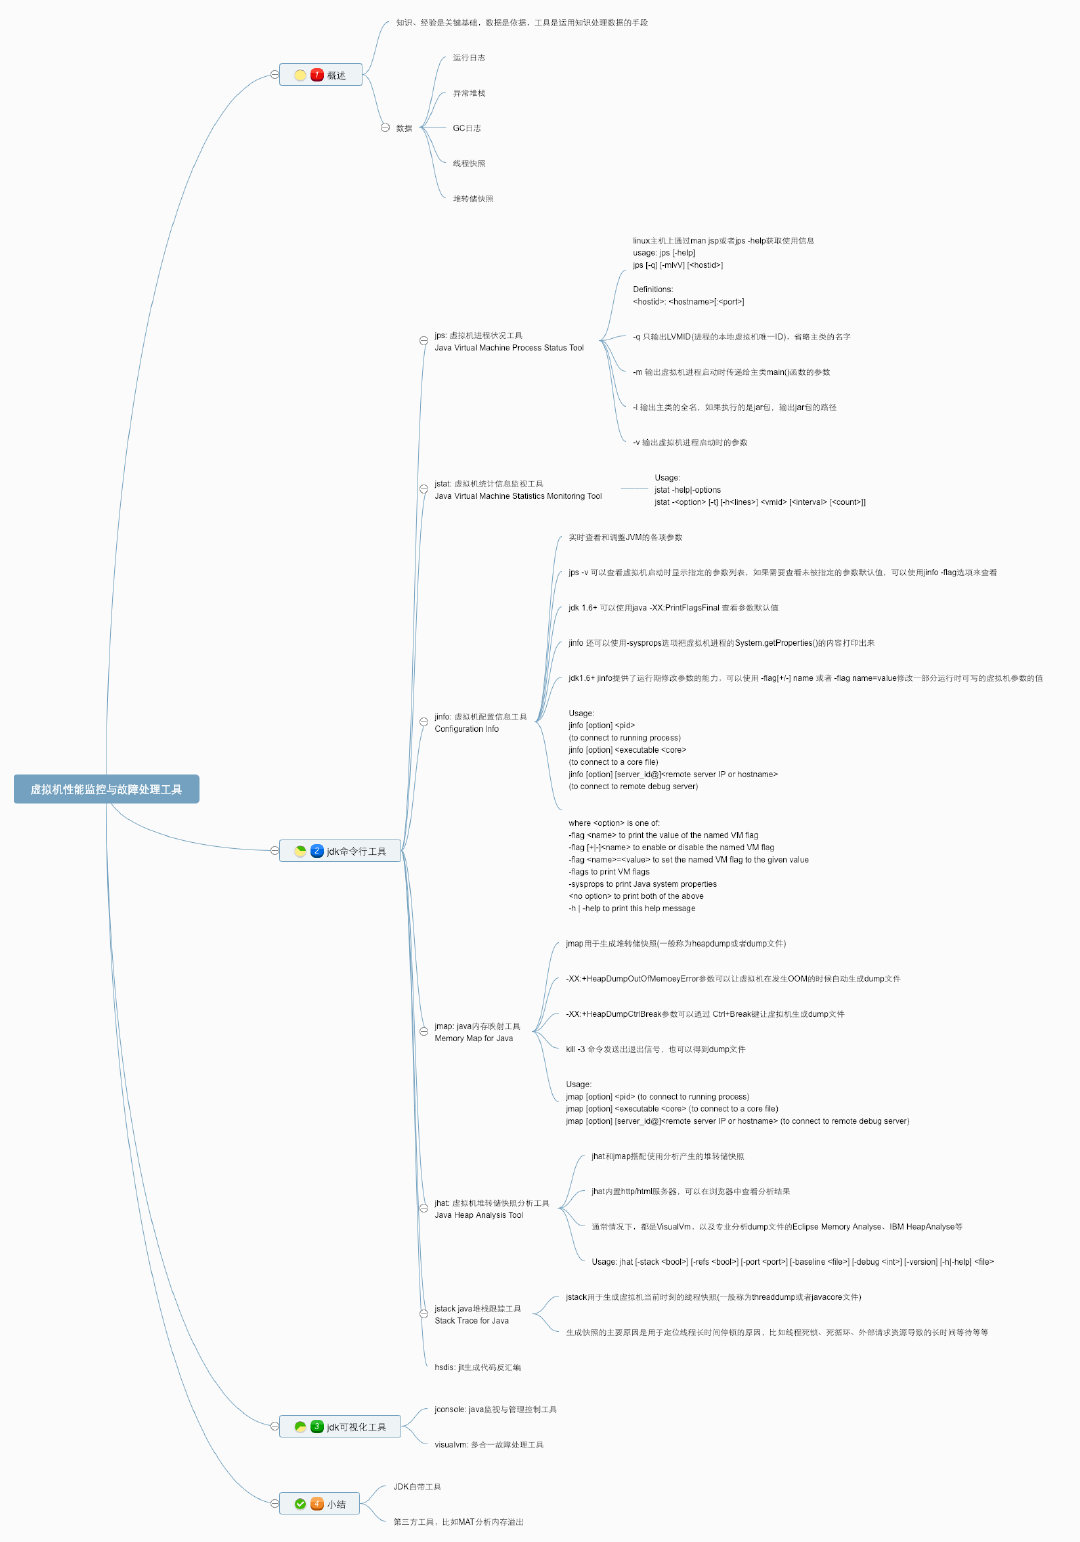
Outline-Mind Mapping
Summary
The first two articles summarize and record the two chapters of "Deep Understanding of Java Virtual Machine" about memory allocation and recovery technology of virtual machine, and have established a relatively complete theoretical basis. Next, we understand the memory management of virtual machines from a practical point of view. When locating problems, knowledge and experience are the key foundation, data is the basis, and tools are the means of using knowledge to process data.
The data mainly include:
- Operation log
- Abnormal stack
- GC log
- Thread snapshot (thread dump / javacore file)
- Heap dump snapshots (heapdump/hprof files), etc.
JDK Command Line Tool
There are many officially provided command-line programs in the Java Installation Directory bin directory. Today, we'll learn about virtual machine performance monitoring and troubleshooting tools.
| Name | Main function |
|---|---|
| jps | JVM Process Status Tool, which displays all HotSpot virtual machine processes in the specified system |
| jstat | JVM Statistics Monitoring Tool for collecting running data from various aspects of HotSpot |
| jinfo | Configuration Info for Java, displaying configuration information for virtual machines |
| jmap | Memory Map for Java to generate Java memory dump snapshots (dump files) |
| jhat | JVM Heap Dump Browser, used to analyze dump files, creates HTTP/HTML servers that can be browsed on browsers |
| jstack | Stack Trace for Java, showing thread snapshots of virtual machines |
jps: Virtual Machine Process Status Tool
Not only does it have a name like the ps command of the lunix host, but it also has similar functions. The jps command in JDK( Help document ) You can enumerate the running virtual machine processes and display the name of the main class (the class where the main function is located) and the unique local virtual machine ID (LVMID) of these processes.
The most frequently used JDK command-line tool, thinking that most of the other JDK tools need to input it to query LVMID to determine which virtual machine process to monitor. For local virtual machine processes, LVMID is consistent with the process ID (PID) of the operating system.
Syntax:
usage: jps [-help]
       jps [-q] [-mlvV] [<hostid>]

Definitions:
    <hostid>:      <hostname>[:<port>]
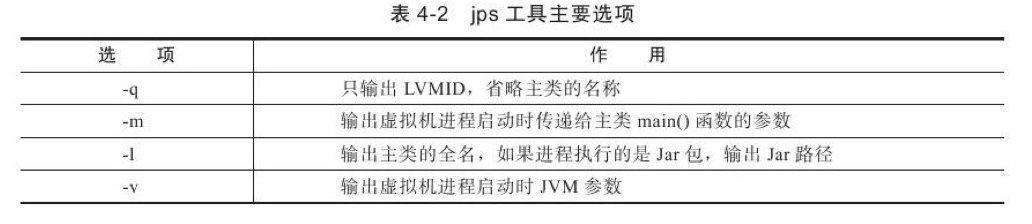
By default, the output information of jps includes the process ID of the Java process and the name of the main class. We can also print additional information by adding parameters. For example, - l prints the module name and package name; - v passes the print to the parameters of the Java virtual machine (e.g. - XX:+Unlock Experimental VMOptions-XX:+UseZGC); and - m passes the print to the parameters of the main class.
Note that if a Java process turns off the default Open UsePerfData parameter (even with the parameter - XX:-UsePerfData), the jps command (and the jstat described below) will not be able to detect the Java process.
Once we have the process ID of the Java process, we can invoke the monitoring and diagnostic tools described below.
jstat: Virtual Machine Statistics Tool Monitoring Tool
jstat (JVM Statistics Monitoring Tool)(Help document ) Command-line tools for monitoring various running status information of virtual machines. It can display class loading, memory, garbage search, JIT compilation and other running data in local or remote virtual machine processes.
On servers without graphical interfaces, it will be the preferred tool for locating performance problems of virtual machines at runtime.
The jstat command format is:
Usage: jstat -help|-options
       jstat -<option> [-t] [-h<lines>] <vmid> [<interval> [<count>]]

Definitions:
  <option>      An option reported by the -options option
  <vmid>        Virtual Machine Identifier. A vmid takes the following form:
                     <lvmid>[@<hostname>[:<port>]]
                Where <lvmid> is the local vm identifier for the target
                Java virtual machine, typically a process id; <hostname> is
                the name of the host running the target Java virtual machine;
                and <port> is the port number for the rmiregistry on the
                target host. See the jvmstat documentation for a more complete
                description of the Virtual Machine Identifier.
  <lines>       Number of samples between header lines.
  <interval>    Sampling interval. The following forms are allowed:
                    <n>["ms"|"s"]
                Where <n> is an integer and the suffix specifies the units as
                milliseconds("ms") or seconds("s"). The default units are "ms".
  <count>       Number of samples to take before terminating.
  -J<flag>      Pass <flag> directly to the runtime system.
A few notes:
- For VMID and LVMID in command format, if they are local virtual machine processes, they are identical. If it is a remote virtual machine process, the VMID format is [protocol:][/] lvmind [@hostname [:port]/servername]
- Interval: Query interval
- Count: Query times only once if interval and count are omitted
Assuming that it takes 250 milliseconds to query the garbage collection status of process 3245, a total of 20 queries are made.
jstat -gc 3245 250 20
The main options for jstat are:
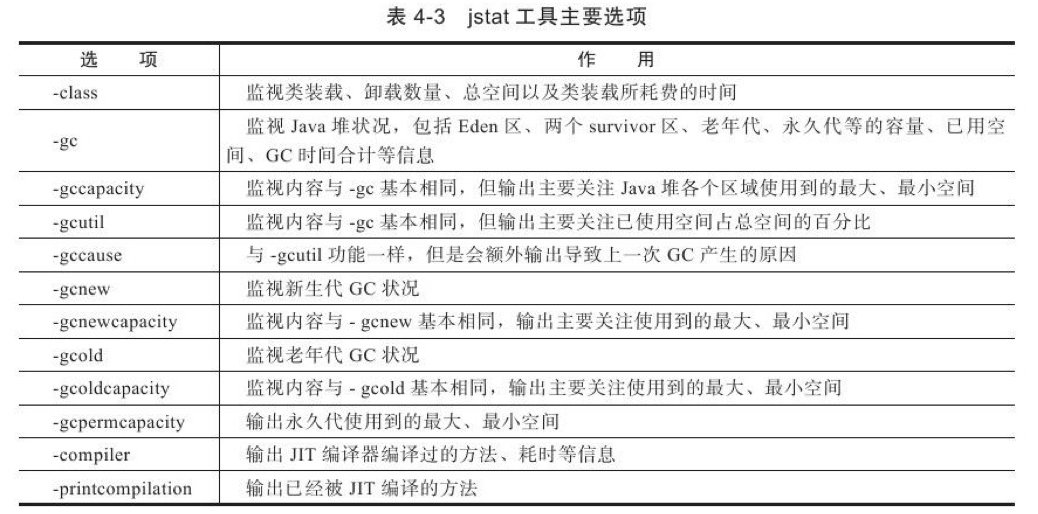
Examples are given to illustrate:
[dashu@*** ~]$ sudo jstat -gcutil 26096 1000 10
  S0     S1     E      O      M     CCS    YGC     YGCT    FGC    FGCT     GCT
  0.00  48.00  17.05   7.22  94.77  91.65    515    8.555     3    0.652    9.207
  0.00  48.00  17.69   7.22  94.77  91.65    515    8.555     3    0.652    9.207
  0.00  48.00  18.84   7.22  94.77  91.65    515    8.555     3    0.652    9.207
  0.00  48.00  19.99   7.22  94.77  91.65    515    8.555     3    0.652    9.207
  0.00  48.00  20.59   7.22  94.77  91.65    515    8.555     3    0.652    9.207
  0.00  48.00  21.20   7.22  94.77  91.65    515    8.555     3    0.652    9.207
  0.00  48.00  21.84   7.22  94.77  91.65    515    8.555     3    0.652    9.207
  0.00  48.00  23.10   7.22  94.77  91.65    515    8.555     3    0.652    9.207
  0.00  48.00  25.04   7.22  94.77  91.65    515    8.555     3    0.652    9.207
  0.00  48.00  27.28   7.22  94.77  91.65    515    8.555     3    0.652    9.207
- S0: Survivor0 is empty
- S1:Survivor1 uses 48% of the space
- E: Eden uses 17.05% of the space.
- O: The elderly use 7.22% of the space.
- M: Permanent generation?
- CCS: ?
- YGC: Minor GC indicates that 515 Minor GC events have occurred since the program was started.
- YGCT: Young GC Time takes 8.555 seconds
- FGC: Full GC indicates that three Minor GC events have occurred since the program was started.
- FGCT: Full GC Time takes 0.652 seconds
- GCT: Represents GC Time. All GC takes 8.555 seconds.
Using jstat tool to monitor the changes of virtual machine state in the pure text state is not as intuitive as the visual monitoring tools such as Visual VM, which will be mentioned later, which are shown directly in charts. However, many server administrators are accustomed to working in the text console, and using jstat commands directly in the console is still a common way of monitoring.
jinfo: Java Configuration Information Tool
jinfo(Configuration Info for Java)(Help document ) Its function is to view and adjust the parameters of virtual machine in real time.
The command grammar format is:
Usage:
    jinfo [option] <pid>
        (to connect to running process)
    jinfo [option] <executable <core>
        (to connect to a core file)
    jinfo [option] [server_id@]<remote server IP or hostname>
        (to connect to remote debug server)

where <option> is one of:
    -flag <name>         to print the value of the named VM flag
    -flag [+|-]<name>    to enable or disable the named VM flag
    -flag <name>=<value> to set the named VM flag to the given value
    -flags               to print VM flags
    -sysprops            to print Java system properties
    <no option>          to print both of the above
    -h | -help           to print this help message
Use examples:
[root@*** ~]# jinfo -flag MaxPermSize 5653
-XX:MaxPermSize=85983232
jmap: Java Memory Mapping Tool
jmap(Memory Map for Java)(Help document ) Commands are used to generate heap dump snapshots (commonly referred to as heapdump or dump files). If you don't use the jmap command, there are some more "violent" ways to get a snapshot of the Java heap dump: for example, the - XX:+HeapDumpOnOutOfMemoryError parameter used in Chapter 2 allows the virtual machine to automatically generate dump files after the OOM exception occurs, and the - XX:+HeapDumpOnCtBreak parameter allows the virtual machine to generate dump files using the [Ctrl]+[Break] key, or Under the Linux system, the dump file can also be obtained by sending a process exit signal "to frighten" the virtual machine through the Kill-3 command.
The command grammar format is:
Usage:
    jmap [option] <pid>
        (to connect to running process)
    jmap [option] <executable <core>
        (to connect to a core file)
    jmap [option] [server_id@]<remote server IP or hostname>
        (to connect to remote debug server)

where <option> is one of:
    <none>               to print same info as Solaris pmap
    -heap                to print java heap summary
    -histo[:live]        to print histogram of java object heap; if the "live"
                         suboption is specified, only count live objects
    -clstats             to print class loader statistics
    -finalizerinfo       to print information on objects awaiting finalization
    -dump:<dump-options> to dump java heap in hprof binary format
                         dump-options:
                           live         dump only live objects; if not specified,
                                        all objects in the heap are dumped.
                           format=b     binary format
                           file=<file>  dump heap to <file>
                         Example: jmap -dump:live,format=b,file=heap.bin <pid>
    -F                   force. Use with -dump:<dump-options> <pid> or -histo
                         to force a heap dump or histogram when <pid> does not
                         respond. The "live" suboption is not supported
                         in this mode.
    -h | -help           to print this help message
    -J<flag>             to pass <flag> directly to the runtime system
The main options of jmap are:
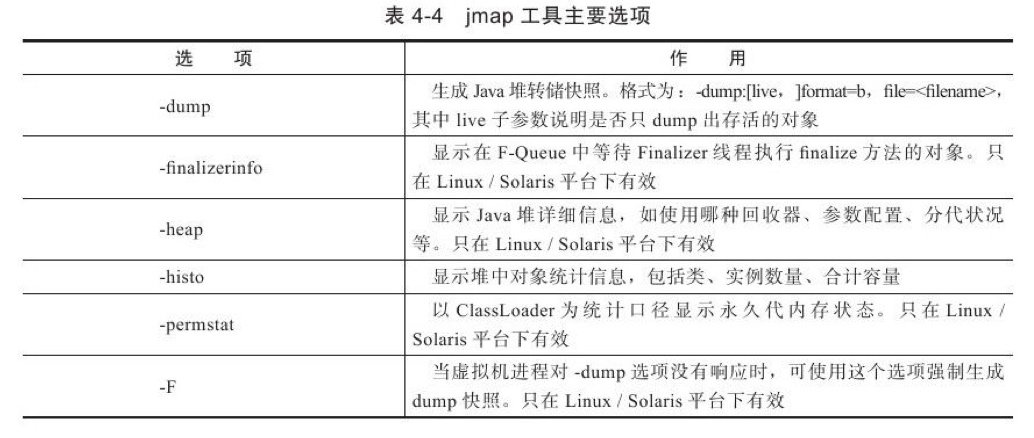
Using an example, dump information is output to the pid=19935 process:
[root@*** ~]# jmap -dump:format=b,file=test.bin 19935
Dumping heap to /root/test.bin ...
Heap dump file created
jhat: Virtual Machine heap dump snapshot analysis tool
Sun JDK provides jhat (JVM Heap Analysis Tool) Help document ) Commands are used in conjunction with jmap to analyze the heap dump snapshots generated by jmap. jhat has a miniature HTTP/HTML server built in. After the analysis results of dump files are generated, they can be viewed in the browser.
Command grammar format:
Usage:  jhat [-stack <bool>] [-refs <bool>] [-port <port>] [-baseline <file>] [-debug <int>] [-version] [-h|-help] <file>

        -J<flag>          Pass <flag> directly to the runtime system. For
                  example, -J-mx512m to use a maximum heap size of 512MB
        -stack false:     Turn off tracking object allocation call stack.
        -refs false:      Turn off tracking of references to objects
        -port <port>:     Set the port for the HTTP server.  Defaults to 7000
        -exclude <file>:  Specify a file that lists data members that should
                  be excluded from the reachableFrom query.
        -baseline <file>: Specify a baseline object dump.  Objects in
                  both heap dumps with the same ID and same class will
                  be marked as not being "new".
        -debug <int>:     Set debug level.
                    0:  No debug output
                    1:  Debug hprof file parsing
                    2:  Debug hprof file parsing, no server
        -version          Report version number
        -h|-help          Print this help and exit
        <file>            The file to read

For a dump file that contains multiple heap dumps,
you may specify which dump in the file
by appending "#<number>" to the file name, i.e. "foo.hprof#3".

All boolean options default to "true"
For example:
- step 1. Command operation
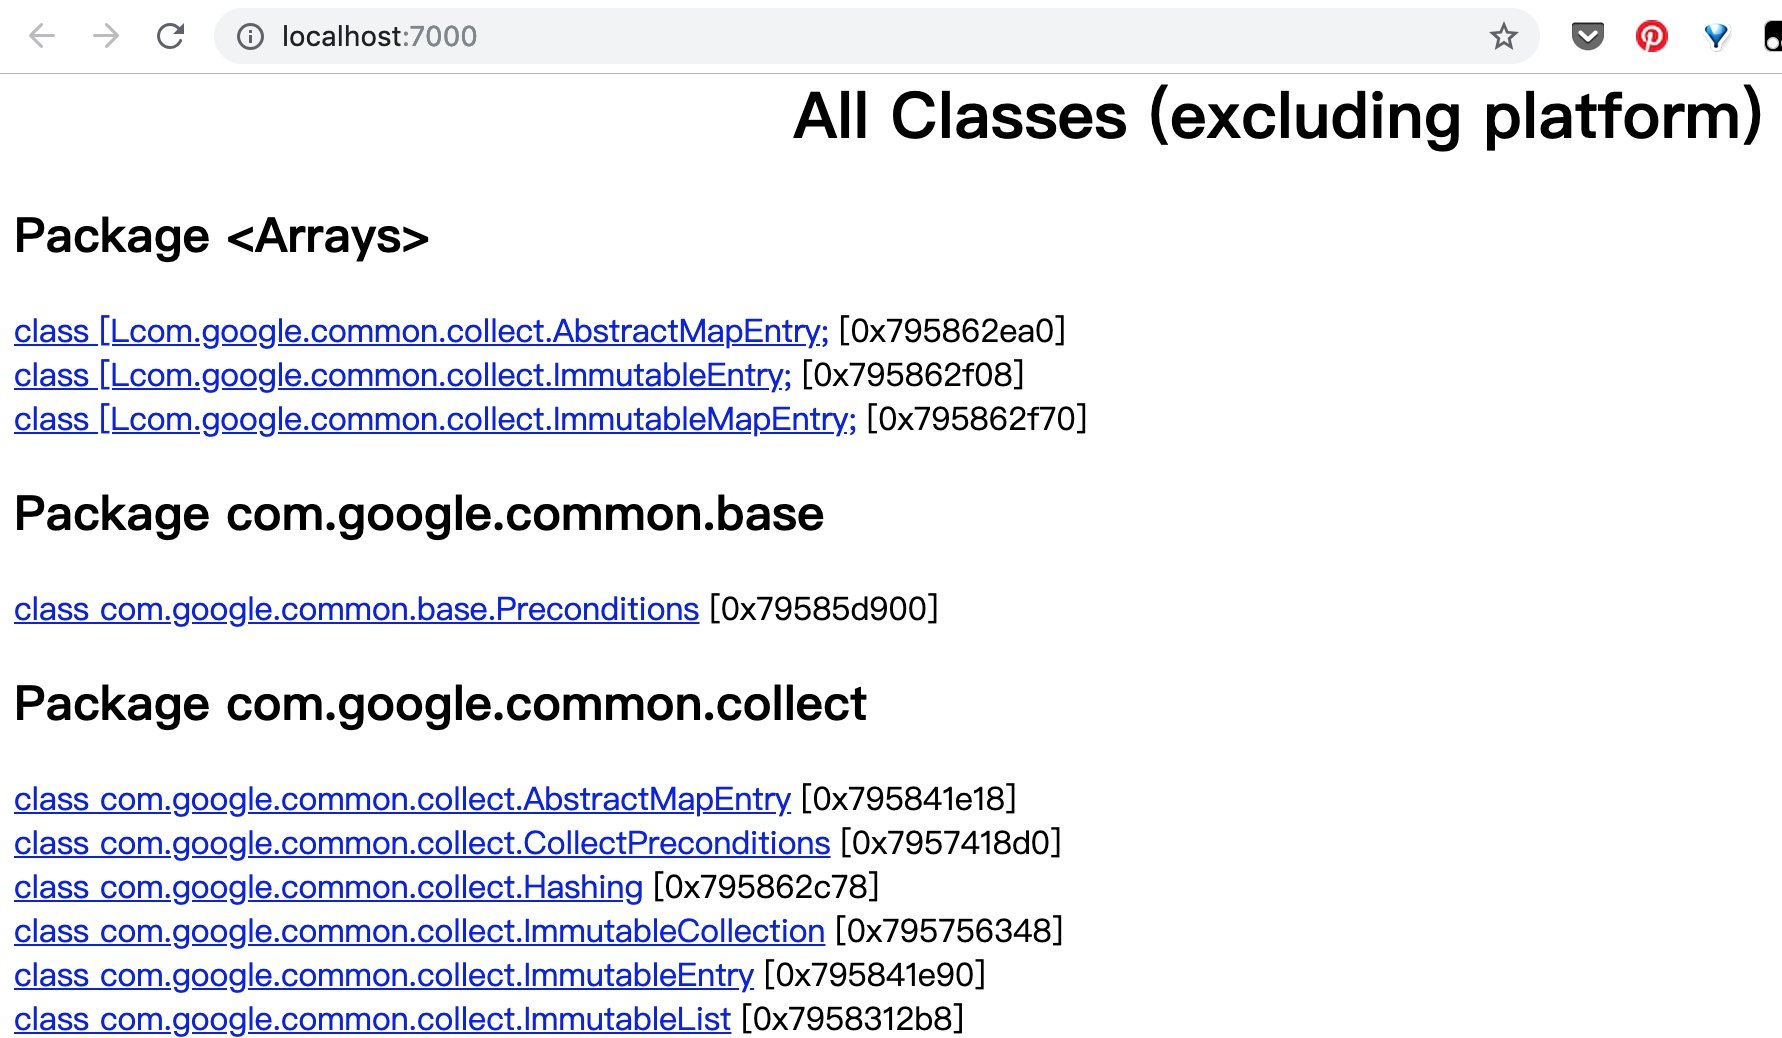
Lin@****:~/tmp|⇒  jmap -dump:format=b,file=test.bin 99022
Dumping heap to /Users/Lin/tmp/test.bin ...
Heap dump file created
Lin@****:~/tmp|⇒  jhat test.bin
Reading from test.bin...
Dump file created Wed Feb 20 07:56:38 CST 2019
Snapshot read, resolving...
Resolving 21672 objects...
Chasing references, expect 4 dots....
Eliminating duplicate references....
Snapshot resolved.
Started HTTP server on port 7000
Server is ready.
- Browser Open http://localhost:7000/
jstack: Java Stack Tracking Tool
jstack(Stack Trace for Java)(Help document ) Commands are used to generate thread snapshots of the virtual machine's current time (commonly referred to as threaddump or javacore files). Thread snapshots are the collection of method stacks that are being executed by each thread in the current virtual machine. The main purpose of generating thread snapshots is to locate the causes of long thread pauses, such as deadlocks between threads, deadlocks, long waiting caused by requesting external resources and so on. When a thread pauses, you can look through the call stack of each thread through jstack to see what the unresponsive thread is doing in the background or waiting for what resources.
Command grammar format:
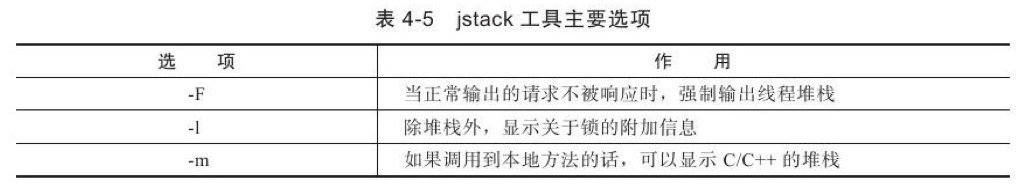
Usage:
    jstack [-l] <pid>
        (to connect to running process)
    jstack -F [-m] [-l] <pid>
        (to connect to a hung process)
    jstack [-m] [-l] <executable> <core>
        (to connect to a core file)
    jstack [-m] [-l] [server_id@]<remote server IP or hostname>
        (to connect to a remote debug server)

Options:
    -F  to force a thread dump. Use when jstack <pid> does not respond (process is hung)
    -m  to print both java and native frames (mixed mode)
    -l  long listing. Prints additional information about locks
    -h or -help to print this help message
The main options of jstack are:
For example:
Lin@***:~/tmp|⇒  jstack -l 99022
2019-02-20 08:02:55
Full thread dump Java HotSpot(TM) 64-Bit Server VM (25.74-b02 mixed mode):

"Attach Listener" #10 daemon prio=9 os_prio=31 tid=0x00007fb2aa872000 nid=0xe07 waiting on condition [0x0000000000000000]
   java.lang.Thread.State: RUNNABLE

   Locked ownable synchronizers:
        - None

"Monitor Ctrl-Break" #9 daemon prio=5 os_prio=31 tid=0x00007fb2aa86f800 nid=0x4503 runnable [0x000070000e987000]
   java.lang.Thread.State: RUNNABLE
        at java.net.PlainSocketImpl.socketAccept(Native Method)
        at java.net.AbstractPlainSocketImpl.accept(AbstractPlainSocketImpl.java:409)
        at java.net.ServerSocket.implAccept(ServerSocket.java:545)
        at java.net.ServerSocket.accept(ServerSocket.java:513)
        at com.intellij.rt.execution.application.AppMain$1.run(AppMain.java:90)
        at java.lang.Thread.run(Thread.java:745)

   Locked ownable synchronizers:
        - None

"Service Thread" #8 daemon prio=9 os_prio=31 tid=0x00007fb2ab013000 nid=0x4703 runnable [0x0000000000000000]
   java.lang.Thread.State: RUNNABLE
   ...
   .....
HSDIS:JIT Generation Code Disassembly
HSDIS is a disassembly plug-in for the JIT compiled code of the HotSpot Virtual Machine, which is officially recommended by Sun. It is included in the source code of the HotSpot Virtual Machine, but no compiled program is provided.
A separate source code can also be downloaded from Project Kenai's website. Its function is to let HotSpot's - XX:+PrintAssembly instruction call it to restore the dynamically generated local code to assembly code output, while generating a large number of very valuable annotations, so that we can analyze the problem through the output code.
JDK Visualization Tool
In addition to providing a large number of command-line tools, there are two powerful visualization tools in JDK: JConsole and Visual VM, which are formal members of JDK and are not labeled "unsupported and experimental".
The above comprehensive description of JDK command-line tools, can easily analyze the status of JVM directly on the server, but to be honest, in practice, we need to use visual tools to query and analyze the JVM situation, especially for JVM stack snapshot analysis which is not likely to directly use jhat, unless there are really no other tools available, one is because the analysis work is a one. The time-consuming and resource-consuming thing is not necessarily limited by command-line tools since there are visualization tools. The second is that the analysis of command-line tools is simple and not intuitive. The Visual VM introduced later and Eclipse Memory Analyzer and IBM HeapAnalyzer, which are specialized in analyzing dump files, have more powerful and professional analysis functions.
JConsole: Java Monitoring and Management Console
JConsole, a built-in Java performance analyzer, has been introduced since Java 5. You can easily use JConsole (or its more advanced "close relative" jvisual vm) to monitor Java application performance and track code in Java. (It is recommended to use an upgraded version of JConsole, jvisual vm.)
Start the program:
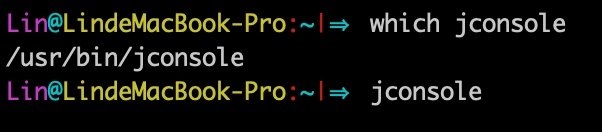
First, look at the tool's interface:
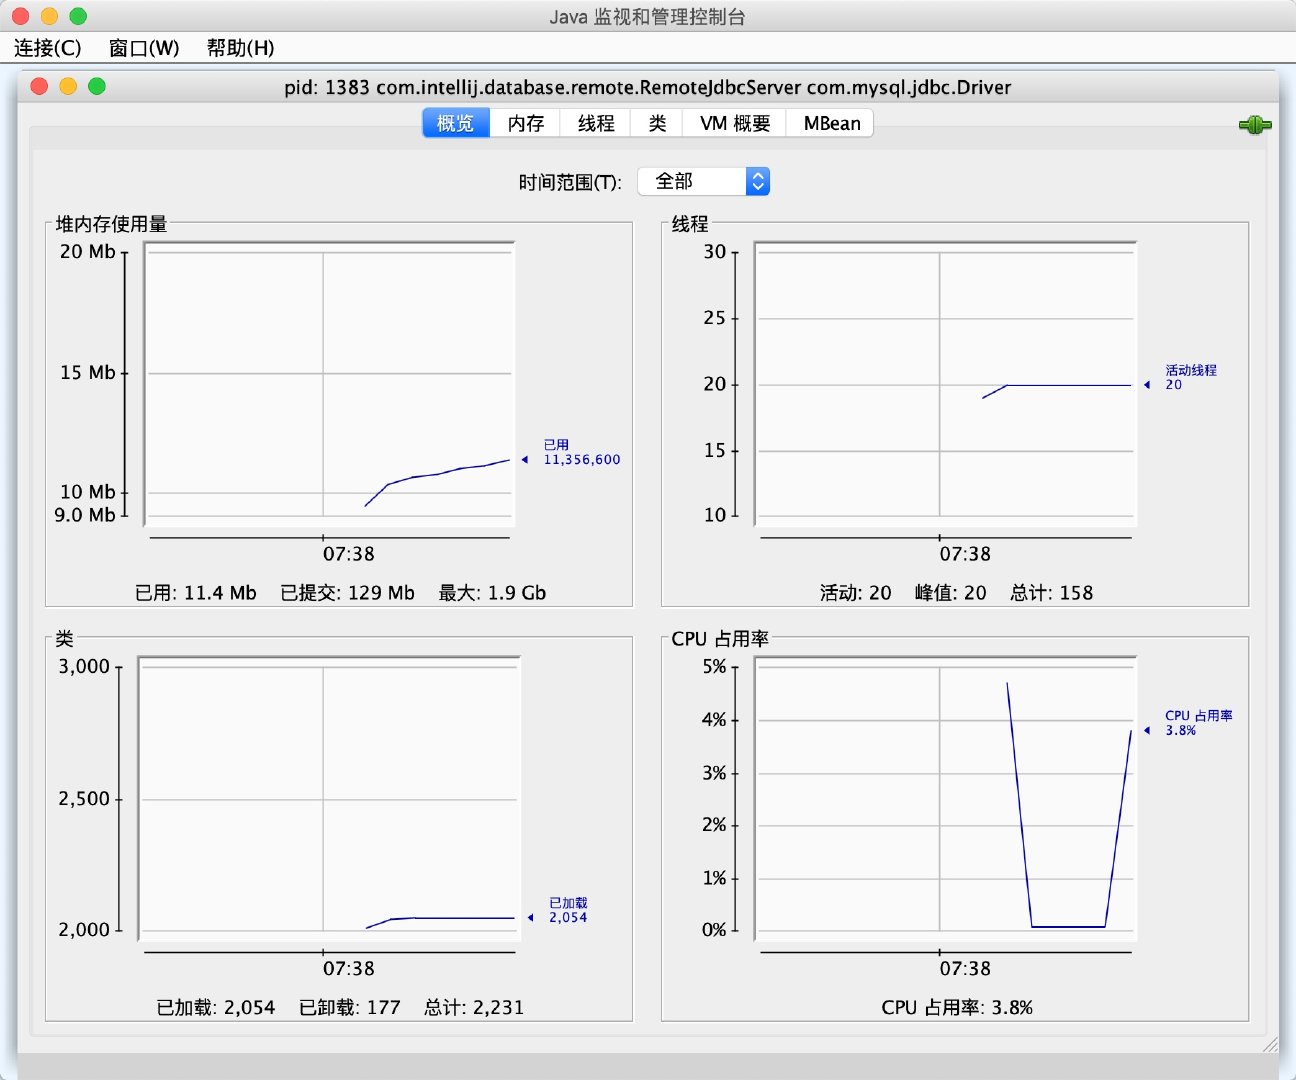
JConsole main interface, you can see that the main interface includes "overview", "memory", "thread", "class", "VM summary", "MBean" 6 tabs.
Next, the author creates a "Monitor Test" reverse textbook code to introduce several tab pages of JConsole.
- Memory monitoring
Code List:
/**
 * -Xms100m -Xmx100m -XX: +UseSerialGC
 * Fill the Java heap with data at 64KB/50 ms for 1000 times
 * Created by Lin on 2019/2/21.
 */
public class MonitorTest {

    /**
     * Memory placeholder object, an OOMObject accounts for about 64KB
     */
    static class OOMObject {
        public byte[] placeholder = new byte[64 * 1024];
    }

    public static void fillHeap(int num) throws InterruptedException {
        List<OOMObject> list = new ArrayList<>();

        for (int i=0; i< num; i++) {
            Thread.sleep(50);
            list.add(new OOMObject());
        }
        System.gc();
    }

    public static void main(String[] args) throws Exception{
        fillHeap(1000);
    }

}
Observing memory Tab
Memory tab is equivalent to a visual jstat command, which monitors the trend of virtual machine memory (Java heap and permanent generation) managed by the collector. We run the above code to experience its monitoring function:
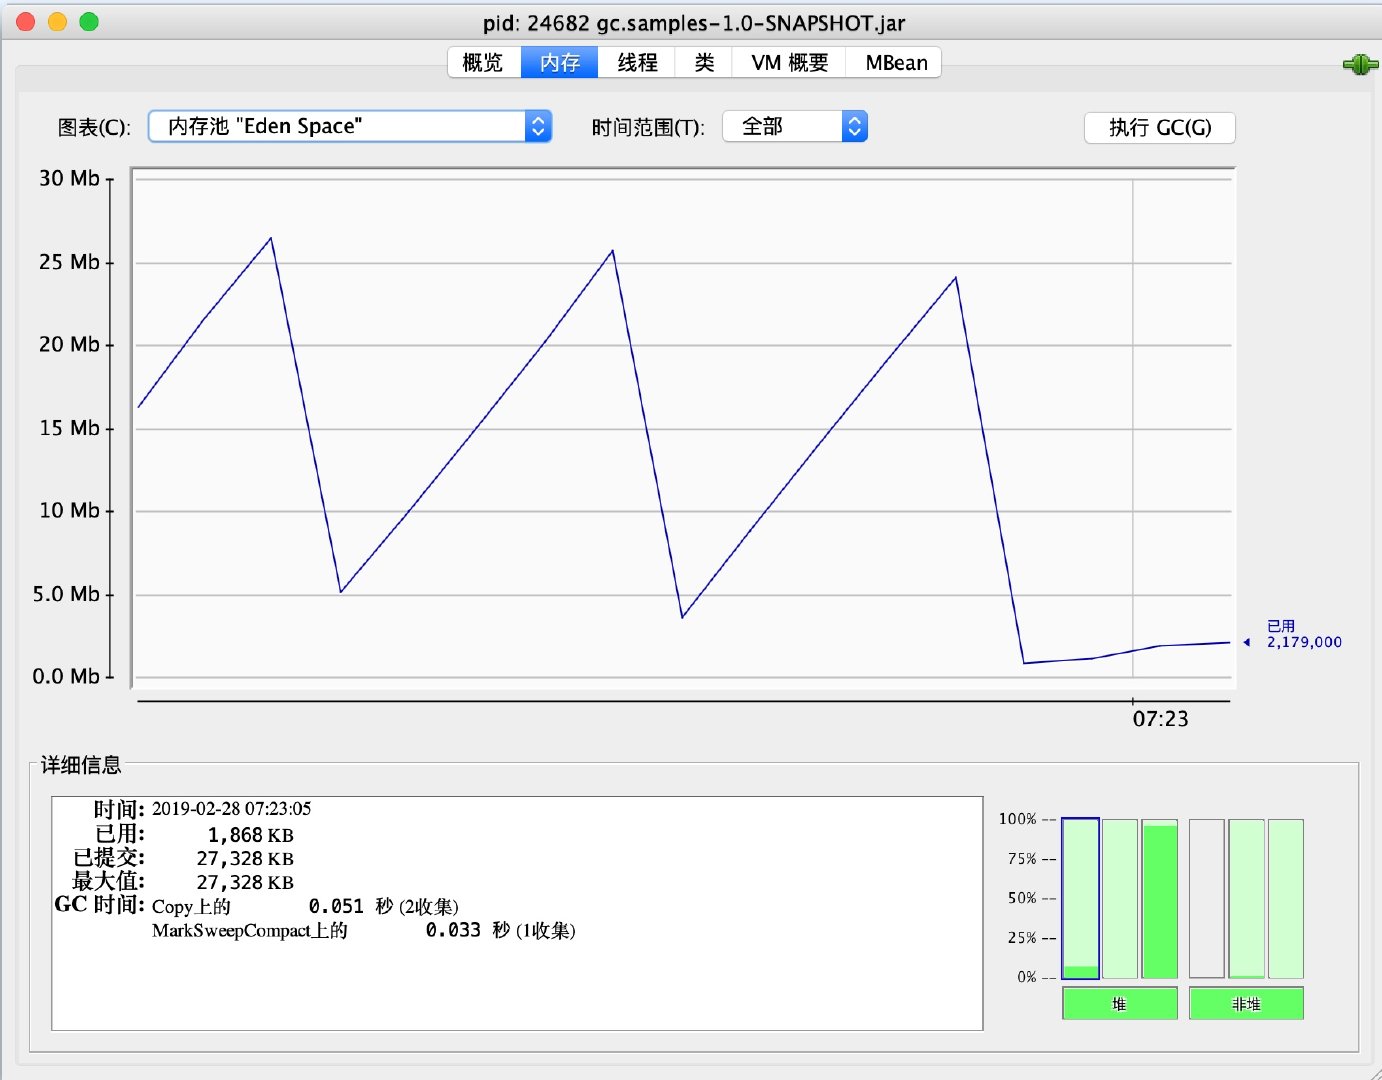
The parameters of virtual machine set up at run time are: - Xms100m - Xmx100m - XX:+UseSerial GC, filling data into Java heap at 64KM/50 ms speed, a total of 1000 times, using JConsole's memory tab to monitor and observe the changes of curves and histograms. In the "memory" tab, we can see that the trend of Eden area in the memory pool is polygonal. When the monitoring scope is extended to the whole heap, we can find that the curve is a smooth upward growth curve. From the bar chart, the whole Cenozoic Eden and Survivor area is basically emptied at the end of 1000 cycles, but the peak state is still maintained in the old generation. The following two minor questions:
- Virtual machine startup parameters limit the Java heap to 100MB without specifying - Xmn parameters. Can you estimate the size of the new generation?
- Why did System.gc(); after that, the histogram of the older generation still shows the peak state?
Answer:
Question 1: The figure shows that the Eden space is 27328KB. Because the - XX:SurvivorRadio parameter is not set, the ratio of Eden to Survivor space defaults to 8:1. The whole Cenozoic space is about 27328KB*125%=34160KB.
Question 2: After the execution of System.gc (), the space cannot be recovered because the List < OOMObject > list object is still alive and the fillHeap () method is still not exited, so the list object is still in scope when System.gc () is executed. If you move System.gc () to a call outside the fillHeap () method, you can reclaim all memory.
Thread monitoring
The "thread" tab functions as a visual jstack command, which can be used for monitoring and analysis when a thread stalls. The main reasons for long thread pauses are:
- Waiting for external resources (database connection, network resources, device resources, etc.)
- Dead cycle
- lock
- ...
Thread Waiting Demonstration Code:
    /**
     * Thread Dead Loop Simulation
     */
    public static void createBusyThread() {
        Thread thread = new Thread(new Runnable() {
            @Override
            public void run() {
                while (true){
                    ;
                }
            }
        }, "testBusyThread");
        thread.start();
    }

    public static void createLockThread(final Object lock) {
        Thread thread = new Thread(new Runnable() {
            @Override
            public void run() {
                synchronized (lock) {
                    try {
                        lock.wait();
                    } catch (InterruptedException e) {
                        e.printStackTrace();
                    }
                }
            }
        }, "testLockThread");
        thread.start();
    }

    public static void main(String[] args) throws Exception{
        Thread.sleep(5000);

        BufferedReader bufferedReader = new BufferedReader(new InputStreamReader(System.in));
        bufferedReader.readLine();
        System.out.println("create busy thread.");
        createBusyThread();
        bufferedReader.readLine();
        System.out.println("create lock thread.");
        createLockThread(new Object());
        bufferedReader.readLine();
    }
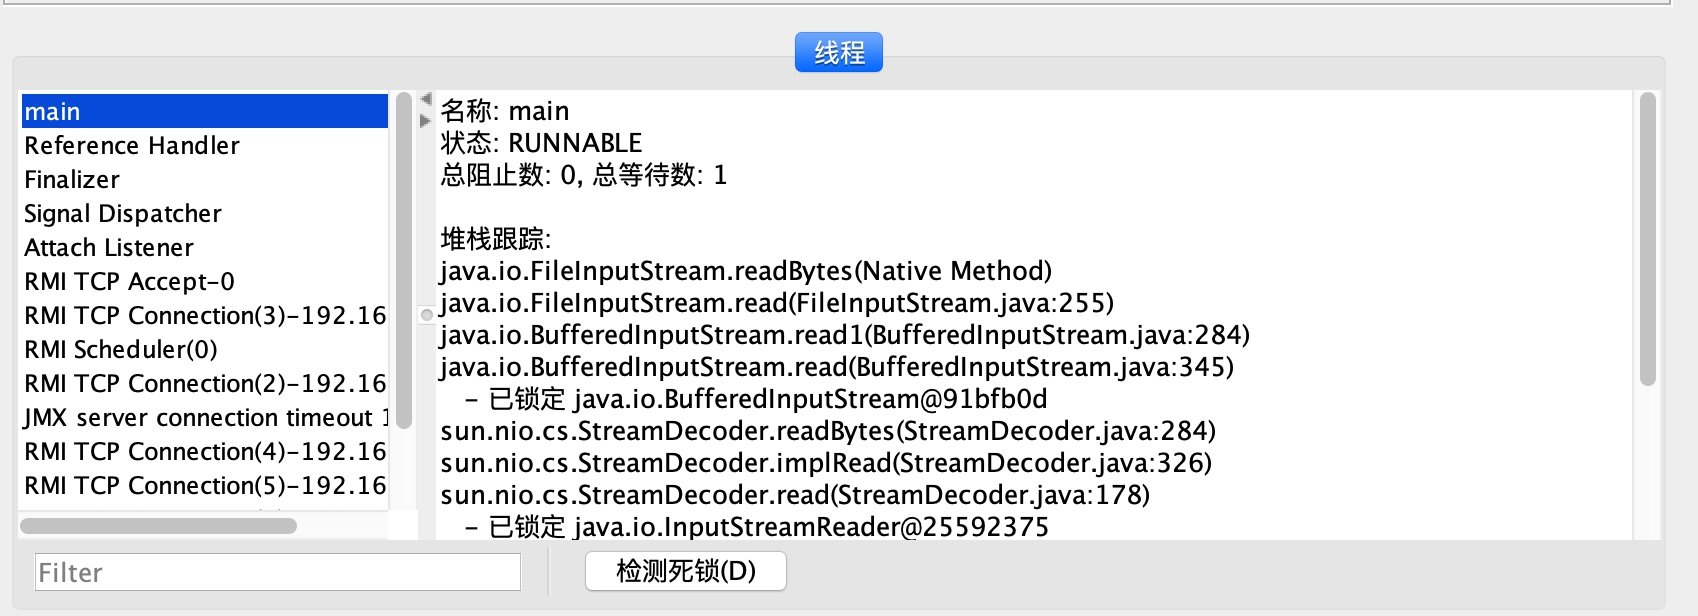
Run the above code and select the main thread in the "thread" tab. Stack tracking shows that BufferedReader waits for the keyboard input of System.in the readBytes method. The thread state is Runnable, and the thread in the Runnable state will be allocated the running time, but the readBytes method returns the execution token immediately when the stream is not updated, which consumes only a small amount of CPU resources.
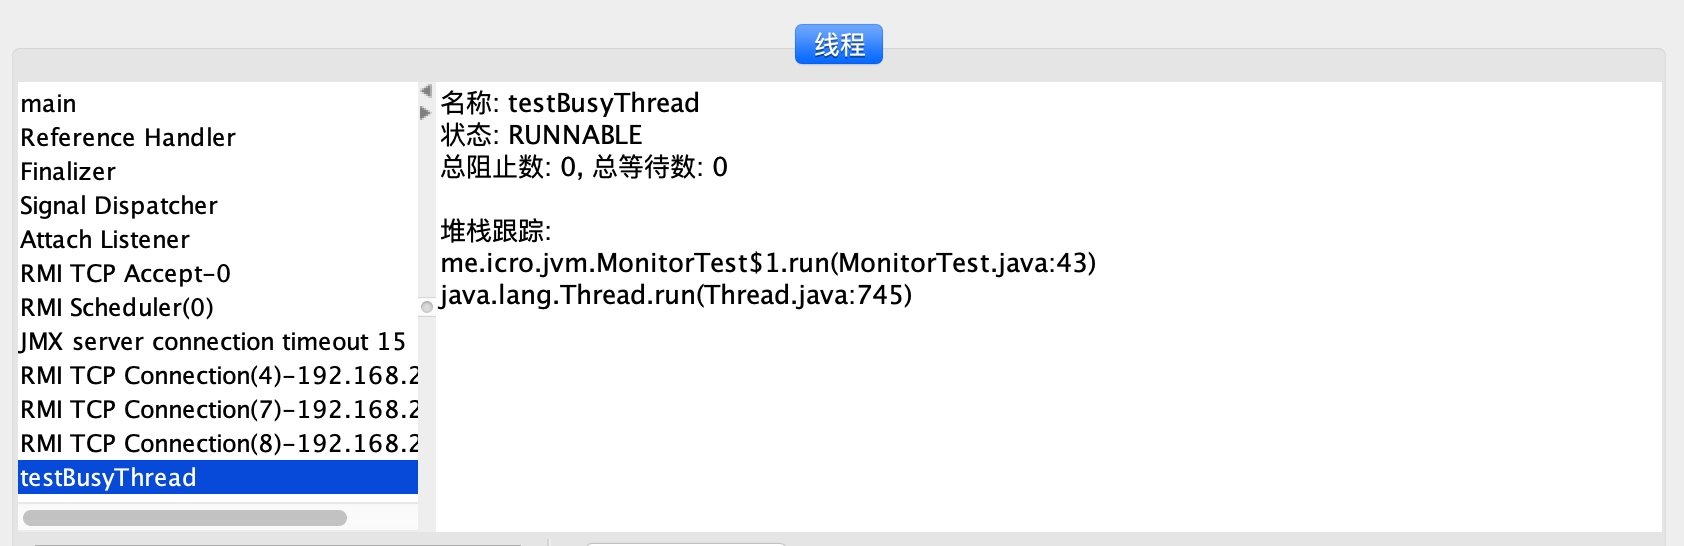
Then monitor the testBusyThread thread, which has been executing empty loops. From the stack trace, you can see that 41 lines of MonitoringTest.java code have been staying, 43 actions: while (true). At this time, the thread is in Runnable state, and without returning the thread execution token action, it will exhaust all execution time on the empty loop until the thread switch, which will consume more CPU resources.
The following figure shows that the testLockThread thread is waiting for the notify or notifyAll method of the lock object to appear. The thread is in the WAITING state and will not be allocated execution time until it is waked up.
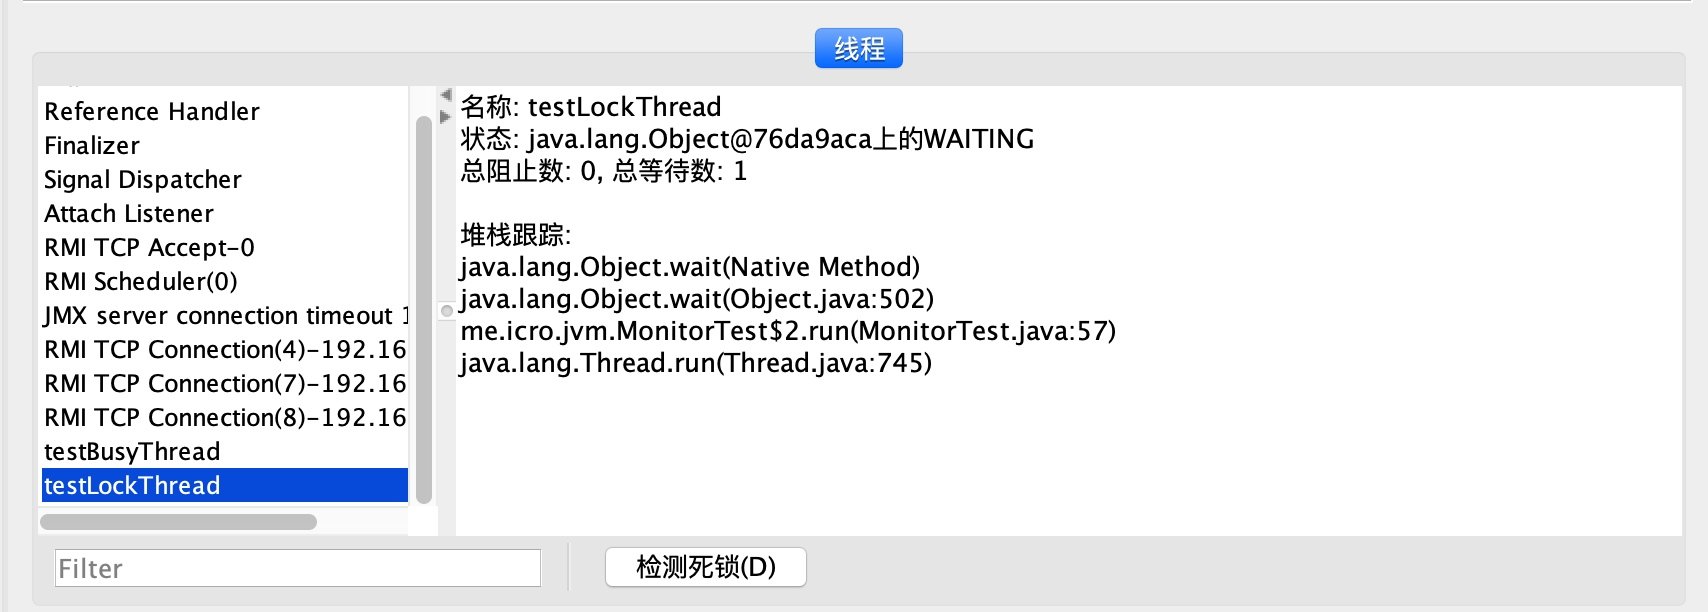
The testLockThread thread is waiting for a normal live lock, which can be activated to continue execution as long as the notify () or notifyAll () methods of the lock object are invoked. The following demonstrates a deadlock wait that cannot be activated again.
Deadlock code:
public class SynAddRunnable implements Runnable {

    int a, b;

    SynAddRunnable(int a, int b) {
        this.a = a;
        this.b = b;
    }

    @Override
    public void run() {
        synchronized (Integer.valueOf(a)) {
            synchronized ((Integer.valueOf(b))) {
                System.out.println(a + b);
            }
        }
    }

    public static void main(String[] args) {
        System.out.println("lock thread start");
        for (int i = 0; i < 100; i++) {
            new Thread(new SynAddRunnable(1, 2)).start();
            new Thread(new SynAddRunnable(2, 1)).start();
        }
    }
}
This code has 200 threads to calculate the value of 1 + 2 and 2 + 1 respectively. In fact, for loop can be omitted, and two threads may lead to deadlock, but the probability is too small, it needs to try many times to see the effect. Generally speaking, the version with for loop runs 2 to 3 times at most and will encounter thread deadlock, so the program can not be terminated.
After thread deadlock occurs, click the "Detecting deadlock" button of JConsole thread panel, and a new "deadlock" tab will appear, as shown in the figure:
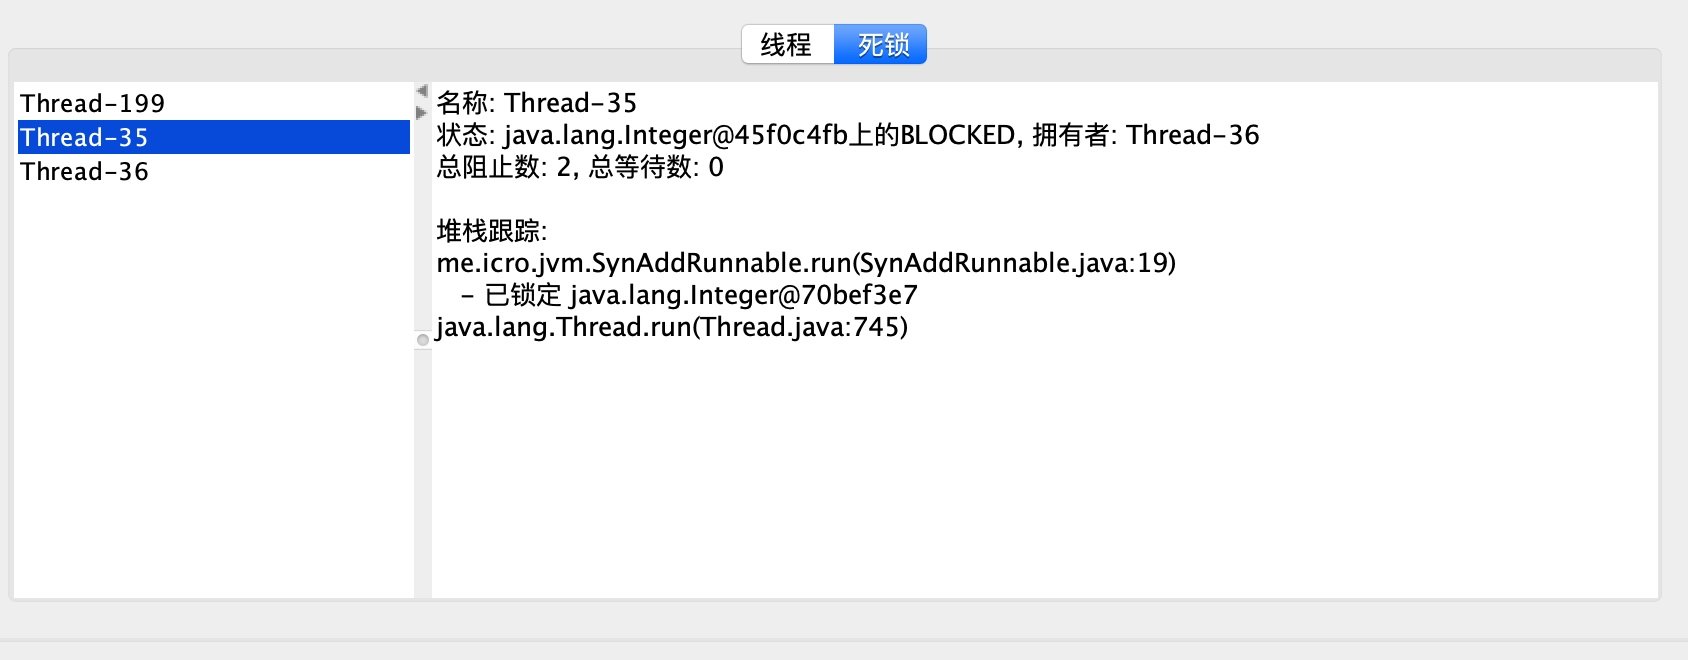
Thread-35 clearly shows that thread Thread-35 is waiting for an Integer object held by thread Thread-36, while thread Thread-36 shows that thread Thread-36 is also waiting for an Integer object held by thread Thread-35, so that both threads are stuck with each other and there is no hope of waiting for lock release.
4.3.2 Visual VM: Multi-in-one Fault Handling Tool
Visual VM (All-in-One Java Troubleshooting Tool) is the most powerful operation monitoring and fault handling tool released with JDK so far, and it can be foreseen that it will be the official main development of virtual machine fault handling tools in the future.
The following exercises show how to use Visual VM to perform JAVA performance analysis and tuning.
- Install JVisual VM in Mac environment:
Installation is not much to say, please go to Official website Download and install by yourself.
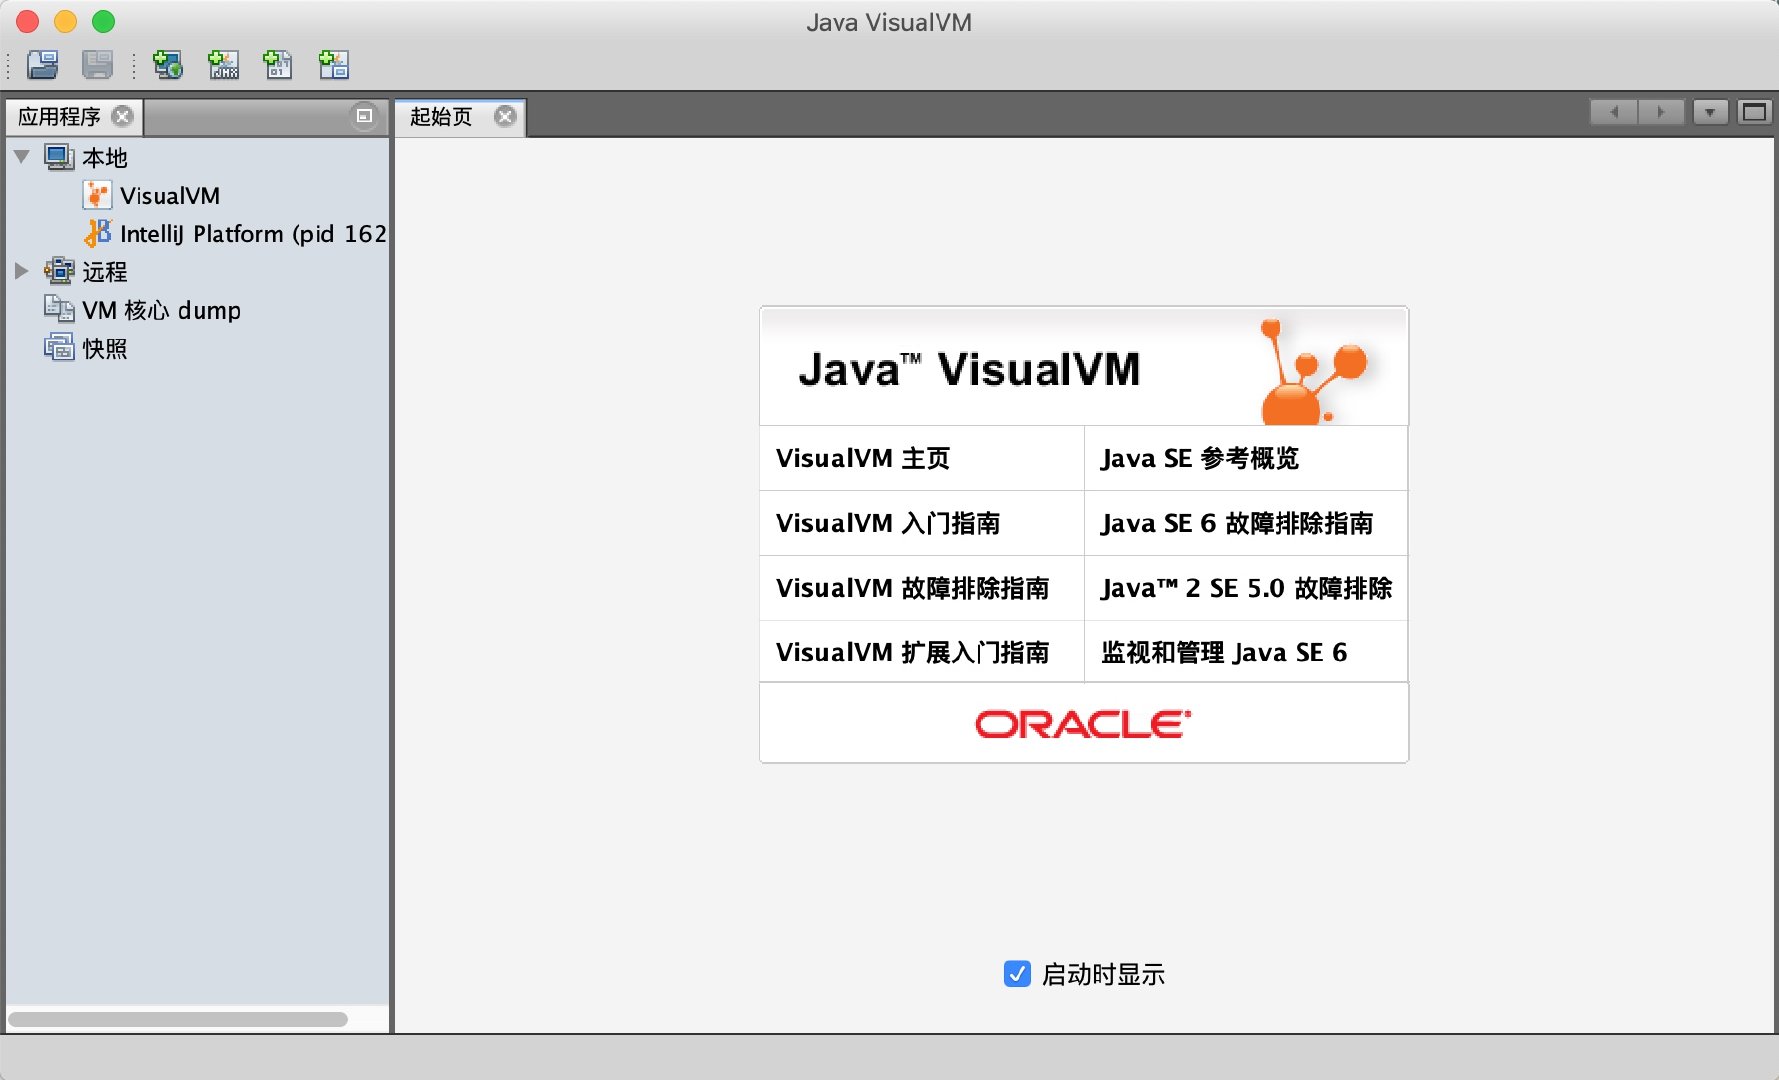
- Start JVisual VM
Terminal command: jvisual VM
- Plug-in unit
After starting VisualVM for the first time, readers do not need to rush to find the application to monitor, because VisualVM has not loaded any plug-ins. Although the main functions of the basic monitoring and thread panel functions are provided in the form of default plug-ins, it is equivalent to giving up the most essential functions without installing any extensions for VisualVM, and not installing any application software. The system is similar.
At present, Visual VM has been developed by visualvm.java.net Moved to visualvm.github.io So if you use jvisual VM under JDK and you fail to install plug-ins, you can add the latest plug-in centers such as Tools - > Plugins - > Settings: https://visualvm.github.io/uc/release139/updates.xml.gz
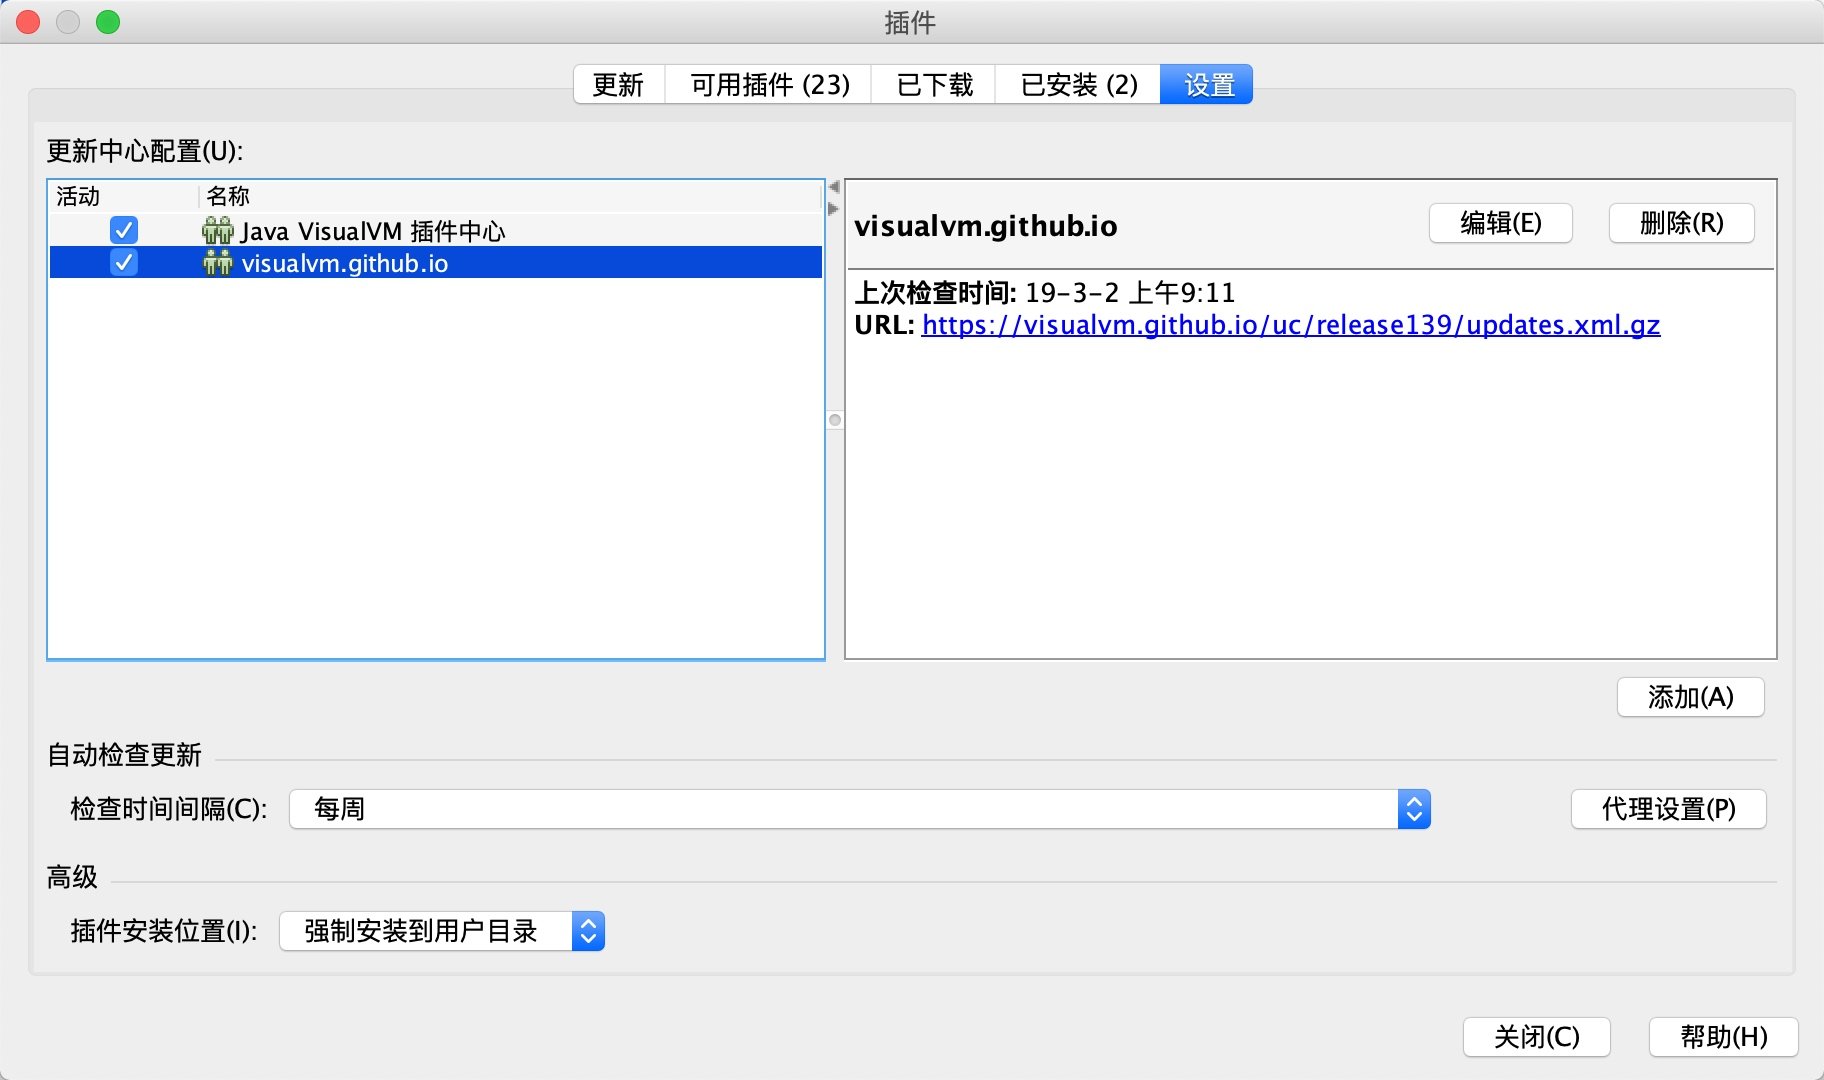
The latest plug-in centers for each version can be viewed here: https://visualvm.github.io/pluginscenters.html
- JVisual VM automatically detects local java applications using Visual GC.
After adding the latest plug-in center, you can see that there are more Tools in "Available Plug-ins", including "Visual GC", which is recommended for installation.
Let's monitor the previous Monitor Test.
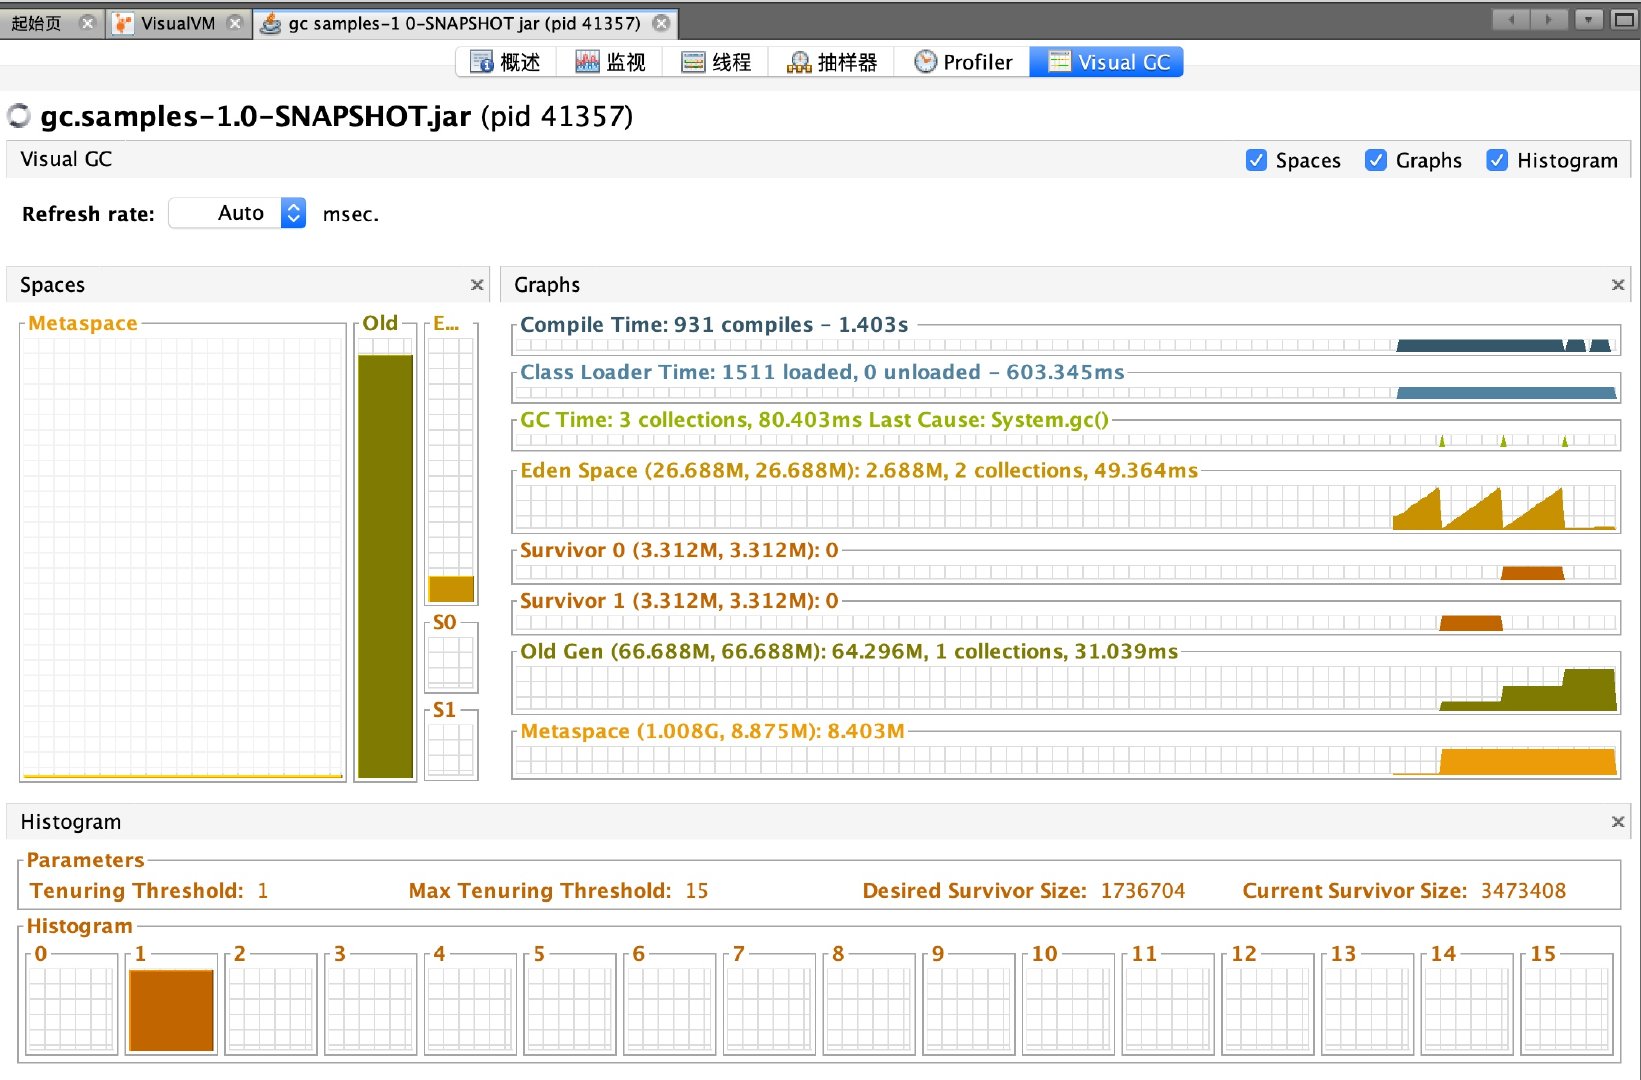
Adjust System.gc(); to fill Heap (1000); after that,
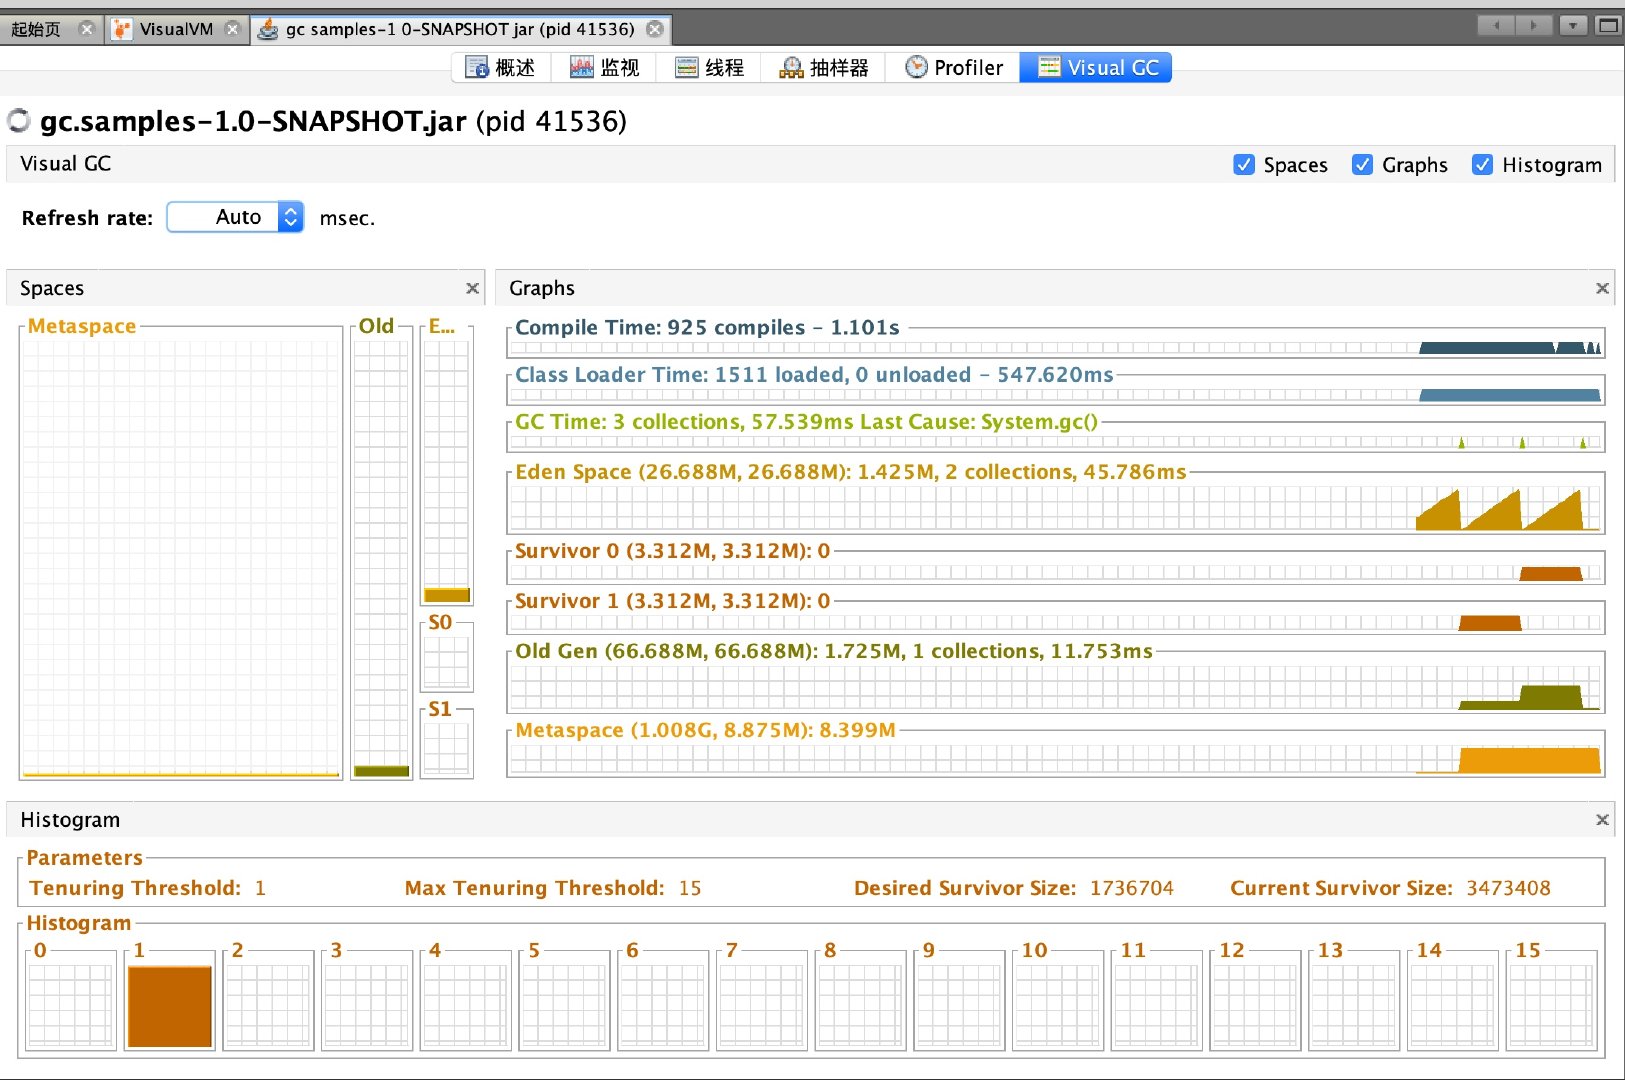
It's much more beautiful than jconsole.
homework
Classic Interview Question: How to monitor and diagnose JVM in-heap and out-of-heap memory usage?
Reference resources
Deep Understanding of Java Virtual Machines: JVM Advanced Features and Best Practices (2nd Edition)