This article is shared from Huawei cloud community< How to use SQL to analyze data? >, author: zuozewei.
preface
We process user data in real time through OLTP (online transaction processing) system, and we also need to analyze them in OLAP (online analytical processing) system. Today, let's see how to use SQL to analyze data.
Several ways of data analysis using SQL
In DBMS (database management system), some databases are well integrated with BI tools, which can facilitate our business analysis of the collected data.
For example, BI analysis tools are provided in SQL Server. We can complete data mining tasks by using Analysis Services in SQL Server. SQL Server has built-in various data mining algorithms, such as common EM, K-Means clustering algorithm, decision tree, naive Bayes, logistic regression and other classification algorithms, as well as neural network and other models. We can also visualize these algorithm models to help us optimize and evaluate the quality of algorithm models.
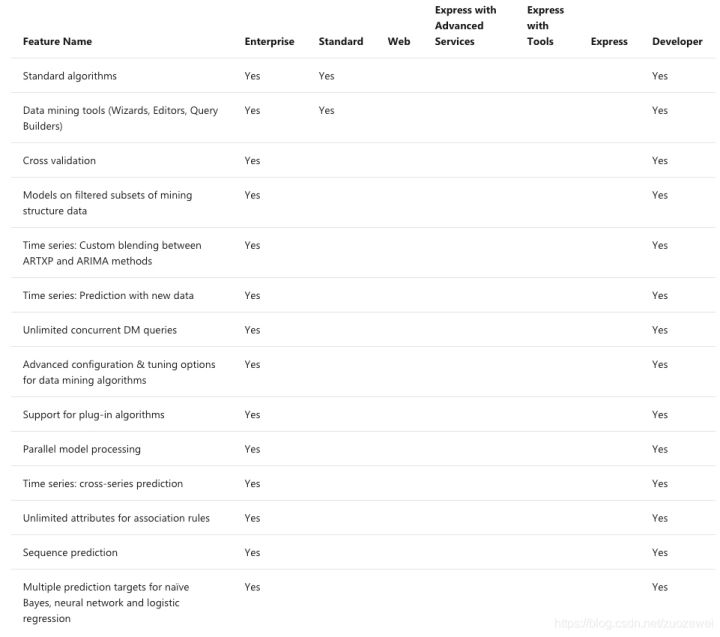
Image source: https://docs.microsoft.com/en-us/analysis-services/analysis-services-features-supported-by-the-editions-of-sql-server-2016
In addition, PostgreSQL is a free and open source relational database (ORDBMS). It is very stable and powerful, and performs very well on OLTP and OLAP systems. At the same time, in machine learning, combined with madlib project, PostgreSQL can be strengthened. Madlib includes a variety of machine learning algorithms, such as classification, clustering, text analysis, regression analysis, association rule mining and verification analysis. In this way, we can use SQL and various machine learning algorithm models in PostgreSQL to help us with data mining and analysis.
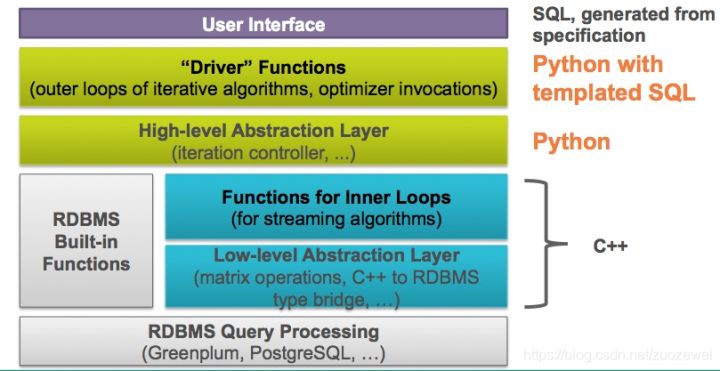
Image source: https://cwiki.apache.org/confluence/display/MADLIB/Architecture
In 2018, Google integrated Machine Learning tools into BigQuery and released BigQuery ML, so that developers can build and use Machine Learning models on large structured or semi-structured data sets. Through the BigQuery console, developers can complete the training and prediction of Machine Learning model like using SQL statements.
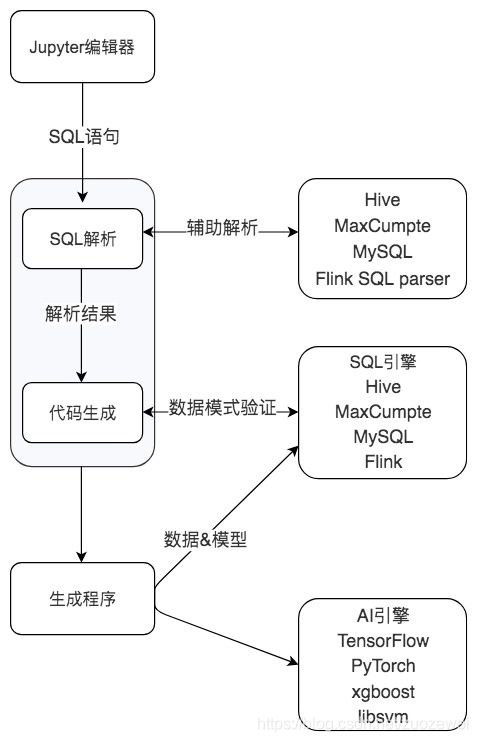
SQLFlow is an open source machine learning tool of ant financial services in 2019. We can call machine learning algorithms by using SQL. You can understand SQLFlow as a machine learning translator. We can complete the training of the machine learning model by adding the TRAIN clause after the SELECT statement, and we can use the model for prediction by adding PREDICT after the SELECT statement. These algorithm models include not only the traditional machine learning model, but also the deep learning model based on Tensorflow, PyTorch and other frameworks.
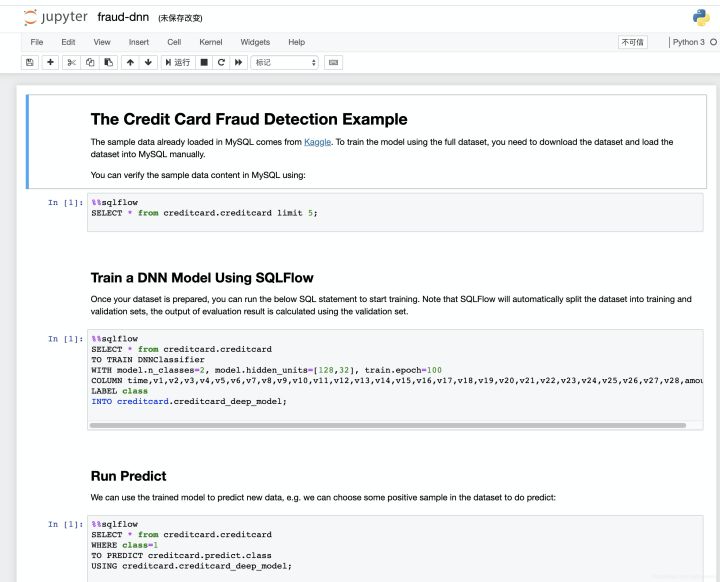
You can see the use process of SQLFlow from the above figure. First, we can complete the interaction of SQL statements through Jupiter notebook. SQLFlow supports a variety of SQL engines, including MySQL, Oracle, Hive, SparkSQL and Flink, so that we can extract data from these DBMS databases through SQL statements, and then select the desired machine learning algorithms (including traditional machine learning and deep learning models) for training and prediction. However, this tool has just been launched, and there are still many areas to be improved in tools, documents and communities.
The last most commonly used method is SQL+Python, which is also what we will focus on today. The tools described above can be said to be not only the entry of SQL query data, but also the entry of data analysis and machine learning. However, these modules are highly coupled and may have problems in use. On the one hand, the tools will be very large. For example, when installing SQLFlow, the Docker method is used for installation, and the overall files to be downloaded will exceed 2G. At the same time, there is poor flexibility when adjusting and optimizing the algorithm. Therefore, the most direct way is to separate SQL and data analysis module, read data with SQL, and then process data analysis through Python.
Case: mining frequent itemsets and association rules in shopping data
Let's make a specific explanation through a case.
What we want to analyze is the shopping problem, and the technology used is correlation analysis. It can help us find the relationship between goods in a large number of data sets, so as to mine the combination of goods often purchased by people. A classic example is the example of "beer and diapers".
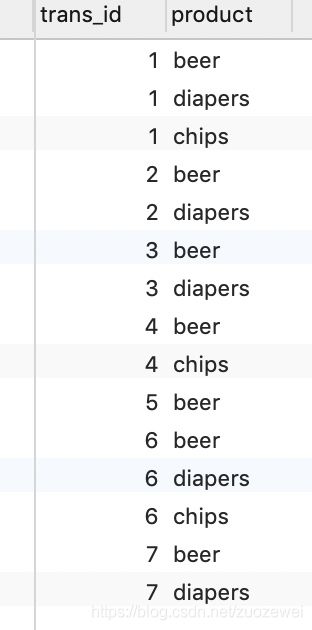
Today, our data set comes from a shopping sample data, and the field includes trans_id (transaction ID) and product (commodity name). For specific data sets, refer to the following initialization sql:
DROP TABLE IF EXISTS test_data;
CREATE TABLE test_data (
    trans_id INT,
    product TEXT
);
INSERT INTO test_data VALUES (1, 'beer');
INSERT INTO test_data VALUES (1, 'diapers');
INSERT INTO test_data VALUES (1, 'chips');
INSERT INTO test_data VALUES (2, 'beer');
INSERT INTO test_data VALUES (2, 'diapers');
INSERT INTO test_data VALUES (3, 'beer');
INSERT INTO test_data VALUES (3, 'diapers');
INSERT INTO test_data VALUES (4, 'beer');
INSERT INTO test_data VALUES (4, 'chips');
INSERT INTO test_data VALUES (5, 'beer');
INSERT INTO test_data VALUES (6, 'beer');
INSERT INTO test_data VALUES (6, 'diapers');
INSERT INTO test_data VALUES (6, 'chips');
INSERT INTO test_data VALUES (7, 'beer');
INSERT INTO test_data VALUES (7, 'diapers');
The association analysis algorithm we use here is Apriori algorithm, which helps us find frequent itemsets. First, we need to understand what is frequent itemsets.
Frequent itemsets are itemsets whose support is greater than or equal to the minimum support threshold. Items less than this minimum support are infrequent itemsets, and itemsets greater than or equal to the minimum support are frequent itemsets. Support is a percentage, which refers to the ratio between the number of occurrences of a product combination and the total number of occurrences. The higher the support, the greater the frequency of this combination.
Let's look at the basic principle of Apriori algorithm.
Apriori algorithm is actually the process of finding frequent itemsets:
0. Set a minimum support,
1. Filter frequent itemsets from K=1.
2. In the result, combine the K+1 itemset and filter again
3. Cycle steps 1 and 2. Until no result is found, the result of the K-1 itemset is the final result.
Let's take a look at the data below to understand that the following are all orders and the goods purchased in each order:
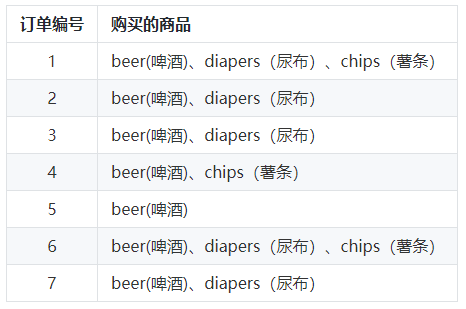
In this example, "beer" appears seven times, so the support of "milk" in these seven orders is 7 / 7 = 1. Similarly, "beer + diaper" appears five times, then the support degree in these seven orders is 5 / 7 = 0.71.
At the same time, we also need to understand a concept called "confidence", which indicates how likely you are to buy commodity B when you buy commodity A. in this example, confidence (beer → diaper) = 5 / 7 = 0.71, which means that if you buy beer, you will have a 71% probability of buying diaper; Confidence (beer → French fries) = 3 / 7 = 0.43, which means that if you buy beer, you have a 43% probability of buying French fries.
Therefore, confidence is A conditional concept, which refers to the probability of B when A occurs.
When calculating the association relationship, we often need to specify the minimum support and minimum confidence, so that we can find the frequent itemsets greater than or equal to the minimum support and the association rules greater than or equal to the minimum confidence based on the frequent itemsets.
Use MADlib+PostgreSQL to complete the correlation analysis of shopping data
For the above case of shopping data association analysis, we can use the association rules provided by the tool for analysis. Next, we demonstrate that the corresponding association rules can be found in Madlib tool by using PostgreSQL database. The call analysis of association rules can be completed by writing SQL.
development environment
- Windows/MacOS
- Navicat Premium 11.2.7 and above
Server environment
- Centos 7.6
- Docker
- PostgreSQL 9.6
- MADlib 1.4 and above
Using Docker to install MADlib+PostgreSQL
Pull the docker image (this image provides the required postgres and other environments, and madlib is not installed):
docker pull madlib/postgres_9.6:latest
Download the MADlib github source code. Assume that the downloaded source code location is / home / git repo / GitHub / madlib:
cd /home/git-repo/github && git clone git@github.com:apache/madlib.git
Start the container and establish the path mapping between the local directory and the system in the container. The shared directory is read-write shared between the container and the local computer.
docker run -d -it --name madlib -v /home/git-repo/github/madlib:/incubator-madlib/ madlib/postgres_9.6
After starting the container, connect the container to compile the MADlib component. The compilation takes about 30 minutes:
docker exec -it madlib bash
mkdir /incubator-madlib/build-docker
cd /incubator-madlib/build-docker
cmake ..
make
make doc
make install
To install MADlib in a container:
src/bin/madpack -p postgres -c postgres/postgres@localhost:5432/postgres install
Run the MADlib test:
# Run install check, on all modules:
src/bin/madpack -p postgres -c postgres/postgres@localhost:5432/postgres install-check

# Run install check, on a specific module, say svm:
src/bin/madpack -p postgres -c postgres/postgres@localhost:5432/postgres install-check -t svm

# Run dev check, on all modules (more comprehensive than install check):
src/bin/madpack -p postgres -c postgres/postgres@localhost:5432/postgres dev-check

# Run dev check, on a specific module, say svm:
src/bin/madpack -p postgres -c postgres/postgres@localhost:5432/postgres dev-check -t svm

# If necessary, reinstall Reinstall MADlib:
src/bin/madpack -p postgres -c postgres/postgres@localhost:5432/postgres reinstall
If necessary, first close and delete the container, and then start again. The new container needs to be reinstalled:
docker kill madlib
docker rm madlib
To create a new image with a configured container, first check the container ID, and then create a new image with the container ID:
docker ps -a
docker commit <container id> my/madlib_pg9.6_dev
To create a new container with a new image:
docker run -d -it -p 5432:5432 --name madlib_dev -v /home/my/git-repo/github/madlib:/incubator-madlib/ madlib/postgres_9.6
Connect the container for interaction (it is found that the new container is still not installed, but there is no need to compile, and the installation is fast. After installation, test it)
docker exec -it madlib_dev bash
cd  /incubator-madlib/build-docker
src/bin/madpack -p postgres -c postgres/postgres@localhost:5432/postgres install
src/bin/madpack -p postgres -c postgres/postgres@localhost:5432/postgres install-check
Use Navicat to remotely connect to PostgreSQL (assuming that the login user and password are not modified, there is no password by default)
Finally, create a new table and initialize the data:
Use SQL to complete the call analysis of association rules
Finally, SQL + MADlib is used for association analysis. Here, we set the minimum support of the parameter as 0.25 and the minimum confidence as 0.5. Generate association rules in transactions according to conditions, as shown below:
SELECT * FROM madlib.assoc_rules( .25,            -- Support
                                  .5,             -- Confidence
                                  'trans_id',     -- Transaction id field
                                  'product',      -- Product field
                                  'test_data',    -- input data
                                  NULL,           -- Output mode
                                  TRUE            -- Detailed output
                                );
Query results:

Association rules are stored in Assoc_ In the rules table:
SELECT * FROM assoc_rules
ORDER BY support DESC, confidence DESC;

be careful:
The association rule always creates a table called assoc_rules. If you want to keep multiple association rule tables, copy the table before running again.
Use SQL+Python to complete the correlation analysis of shopping data
In addition, we can directly use SQL to complete data query, and then complete association analysis through Python's machine learning toolkit.
development environment
- Windows/MacOS
- Navicat Premium 11.2.7 and above
- Python 3.6
Server environment
- Centos 7.6
- Docker
- MySQL 5.7
Installing MySQL using Docker
Pull the official image (we choose 5.7 here. If we don't write the following version number, the latest version will be pulled automatically):
docker pull mysql:5.7
Check whether the pull is successful:
docker images
REPOSITORY                        TAG                 IMAGE ID            CREATED             SIZE
docker.io/mysql                   5.7                 db39680b63ac        2 days ago          437 MB
Start container:
docker run -p 3306:3306 --name mymysql -v $PWD/conf:/etc/mysql/conf.d -v $PWD/logs:/logs -v $PWD/data:/var/lib/mysql -e MYSQL_ROOT_PASSWORD=123456 -d mysql:5.7
- – Name: container name, which is named MySQL here;
- -e: Configuration information, where the login password of the root user of mysql is configured;
- -p: Port mapping, where the host 3306 port is mapped to the container 3306 port;
- -d: Source image name, here mysql:5.7;
- -v: The directory mapping relationship between host and container. Before ":" is the host directory, followed by the container directory.
Check the container for proper operation:
[root@VM_0_10_centos ~]# docker ps
CONTAINER ID        IMAGE               COMMAND                  CREATED             STATUS              PORTS                               NAMES
d1e682cfdf76        mysql:5.7           "docker-entrypoint..."   14 seconds ago      Up 13 seconds       0.0.0.0:3306->3306/tcp, 33060/tcp   mymysql
You can see the container ID, source image of the container, startup command, creation time, status, port mapping information, and container name.
Enter docker and connect to MySQL client locally:
sudo docker exec -it mymysql bash
mysql -u root -p
Set remote access account and authorize remote connection:
CREATE USER 'zuozewei'@'%' IDENTIFIED WITH mysql_native_password BY 'zuozewei';
GRANT ALL PRIVILEGES ON *.* TO 'zuozewei'@'%';
Use Navicat to remotely connect to MySQL, create a new database and initialize data.
Write Python script to complete data analysis
First, we complete the SQL query through SQLAlchemy and use efficient_apriori algorithm of Apriori toolkit.
The whole project consists of three parts:
- The first part is data loading. First, we use sql.create_engine creates an SQL connection, then reads all the data from the dataset table and loads it into data. MySQL account name and password need to be configured here;
- The second step is data preprocessing. We also need to get an array of transactions, which includes the information of each order. Each order is stored in the form of a set, so that there are no duplicate item s in the same order. At the same time, we can also use the Apriori toolkit for direct calculation;
- Finally, the Apriori toolkit is used for association analysis. Here we set the parameter min_support=0.25,min_confidence=0.5, that is, the minimum support is 0.25 and the minimum confidence is 0.5. Find frequent itemsets and association rules in transactions according to conditions.
Download dependent libraries:
#pip3 install package name - i source url temporary source change
#Tsinghua University source: https://pypi.tuna.tsinghua.edu.cn/simple/

# Powerful data structure library for data analysis, time series and statistics
pip3 install pandas -i https://pypi.tuna.tsinghua.edu.cn/simple/

# orm program of python
pip3 install SQLAlchemy -i https://pypi.tuna.tsinghua.edu.cn/simple/

# Efficient pure Python implementation of Apriori algorithm
pip3 install efficient-apriori -i https://pypi.tuna.tsinghua.edu.cn/simple/

# MySQL driver
pip3 install mysql-connector -i https://pypi.tuna.tsinghua.edu.cn/simple/
The specific codes are as follows:
from efficient_apriori import apriori
import sqlalchemy as sql
import pandas as pd

'''
Data loading
'''

# Create database connection
engine = sql.create_engine('mysql+mysqlconnector://zuozewei:zuozewei@server_ip/SQLApriori')
# Query data
query = 'SELECT * FROM test_data'
# Load into data
data = pd.read_sql_query(query, engine)

'''
Data preprocessing
'''

# Get the one-dimensional array orders_series, with Transaction as index and value as Item
orders_series = data.set_index('trans_id')['product']
# Format the dataset
transactions = []
temp_index = 0
for i, v in orders_series.items():
	if i != temp_index:
		temp_set = set()
		temp_index = i
		temp_set.add(v)
		transactions.append(temp_set)
	else:
		temp_set.add(v)

'''
Data analysis
'''

# Mining frequent itemsets and frequent rules
itemsets, rules = apriori(transactions, min_support=0.25,  min_confidence=0.5)

print('Frequent itemsets:', itemsets)
print('Association Rules:', rules)
Operation results:
Frequent itemsets: {
1: {('beer',): 7, ('chips',): 3, ('diapers',): 5},
2: {('beer', 'chips'): 3, ('beer', 'diapers'): 5, ('chips', 'diapers'): 2},
3: {('beer', 'chips', 'diapers'): 2}
}

Association Rules: [
{chips} -> {beer},
{diapers} -> {beer},
{beer} -> {diapers},
{chips} -> {diapers},
{chips, diapers} -> {beer},
{beer, chips} -> {diapers},
{chips} -> {beer, diapers}
]
From the results, we can see that in the shopping portfolio:
- There are three kinds of frequent itemsets with a number of commodities: beer, chips, diapers, etc;
- There are three kinds of frequent itemsets with two commodities, including {beer (beer), chips (chips)}, {beer (beer), diapers (diapers)}, {chips (chips), diapers (diapers)} and so on;
- There are seven kinds of association rules, including those who buy chips will also buy beer, and those who buy diapers will also buy beer.
summary
It is recommended to use Python for data analysis and machine learning through SQL, which is what Python is good at. Through today's example, we should see that using SQL as the entry of data query and analysis is a kind of data stack idea, which reduces the technical threshold of data analysis for data developers. We believe that in today's DT era, our business Growth will increasingly depend on SQL Engine + AI engine.
reference:
- [1]: http://madlib.apache.org/docs/latest/group__grp__assoc__rules.html
- [2]: https://sql-machine-learning.github.io/
- [3]: https://www.jianshu.com/p/8e1e64c08cb7
- [4] Chen Min, doctor of computer science, Tsinghua University
Click focus to learn about Huawei cloud's new technologies for the first time~