The characteristics of micro-services determine that the deployment of functional modules is distributed. Most of the functional modules run on different machines and interact with each other through service invocation. Front-end and back-end business flows will be processed and transmitted by many micro-services. How to locate anomalies quickly becomes a problem. In this case, how to locate anomalies quickly becomes a problem. The monitoring of micro services under the framework is particularly important.
Spring Boot is an open source framework with monitoring. The component Spring Boot Actuator is responsible for monitoring the static and dynamic variables of the application. With Spring Boot Actuator, the project can easily monitor and govern Spring Boot applications. Spring Boot Actuator provides many production-level features, such as monitoring and measuring Spring Boot applications, which can be obtained through many REST interfaces, remote shells and JMX.
Actuator monitoring
Spring Boot uses the concept of "habit is better than configuration". It uses the mechanism of package scanning and automated configuration to load Spring Bean s in dependent jar s. It can implement all Spring configurations without any XML configuration. Although this can make the code very simple, the information of instance creation and dependency relation of the whole application is dispersed to the annotations of each configuration class, which makes it very difficult for us to analyze the relationship between resources and instances in the whole application.
- Simply add spring-boot-starter-actuator to the project, and the monitoring function is automatically enabled.
<dependencies>
  <dependency>
    <groupId>org.springframework.boot</groupId>
    <artifactId>spring-boot-starter-web</artifactId>
  </dependency>
  <dependency>
      <groupId>org.springframework.boot</groupId>
      <artifactId>spring-boot-starter-actuator</artifactId>
  </dependency>
</dependencies>
-
spring-boot-starter-web is added mainly to keep the application running.
-
Spring Boot Actuator is an integrated function of checking and monitoring application system provided by Spring Boot. It can view application configuration details, such as automated configuration information, created Spring beans and some environment attributes.
Actuator's REST interface
-
Actuator monitoring falls into two categories: native endpoints and user-defined endpoints. Custom endpoints mainly refer to extensibility. Users can define some indicators of concern according to their practical application and monitor them in the run time.
-
Native endpoints provide many Web interfaces in applications, through which the internal state of the application runtime can be understood. Native endpoints can be divided into three categories:
- The application configuration class can view the static information applied in the run time, such as automatic configuration information, loaded spring bean information, yml file configuration information, environment information, request mapping information.
- The measurement index classes are mainly dynamic information during runtime, such as stack, request link, some health indicators, metrics information, etc.
- Operational control class, mainly refers to shutdown, the user can send a request to shut down the monitoring function of the application.
-
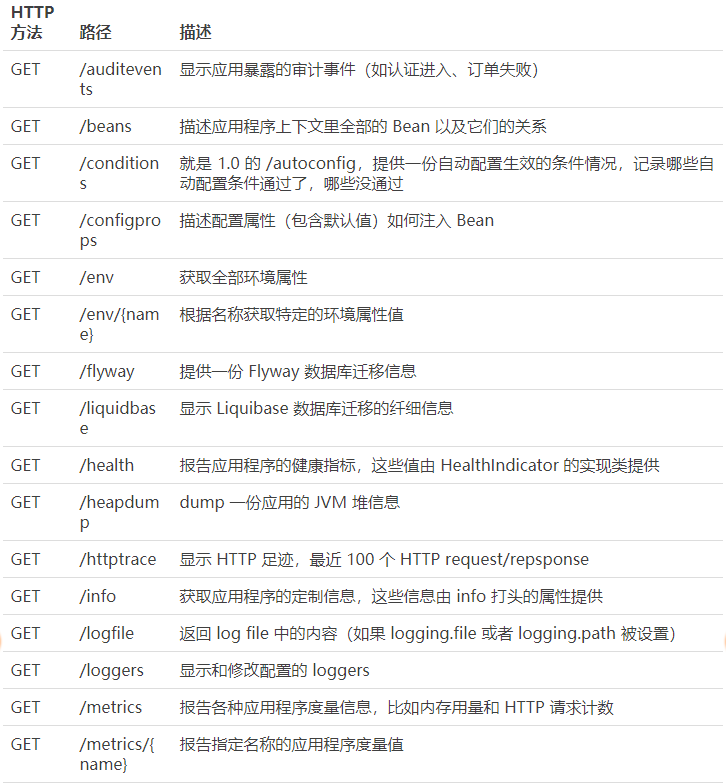
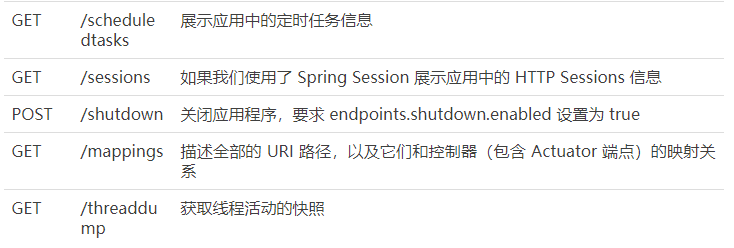
Actuator provides 13 interfaces, as shown in the table below.
-

-

III. Detailed Order
- In Spring Boot 2.x, for security reasons, Actuator only opens two endpoints / actuator/health and / actuator/info, which can be set to open in the configuration file.
- All monitoring points can be opened:
management.endpoints.web.exposure.include=*
- You can also choose to open the section:
management.endpoints.web.exposure.exclude=beans,trace
- Actuator defaults that all monitoring point paths are in / actuator /*, and of course this path supports customization if necessary.
// Once set up and restarted, re-accessing the address becomes / manage/*
management.endpoints.web.base-path=/manage
- Actuator monitors almost every aspect of the application, and we focus on commands that are often used in projects.
1,health
-
health is mainly used to check the running status of applications, which is the most frequently used monitoring point. Usually, this interface is used to remind us of the running status of application instances and the reasons why applications are not "healthy", such as database connection, insufficient disk space and so on.
-
By default, health's state is open. Start the project after adding dependencies. Visit http://localhost:8080/actuator/health to see the state of the application.
{
    "status" : "UP"
}
-
By default, the state of the final Spring Book application is aggregated by Health Aggregator, and the aggregation algorithm is:
- Set the order of status code to setStatusOrder(Status.DOWN, Status.OUTOFSERVICE, Status.UP, Status.UNKNOWN);
- Filter out unrecognizable status codes
- If there is no state code, the state of the Spring Book application is UNKNOWN.
- Sort all collected status codes in the order in 1
- Returns the first state code in the sequence of ordered state codes as the state of the entire Spring Book application
-
Health examines the health status of the application by combining several health indices. Spring Boot Actuator has several predefined health indicators, such as Data Source Health Indicator, DiskSpace Health Indicator, Mongo Health Indicator, RedisHealth Indicator and so on, which use these health indicators as part of a health check-up.
-
For example, if your application uses Redis, the Redis Health Indicator will be treated as part of the check; if you use MongoDB, the MongoHealth Indicator will be treated as part of the check.
-
You can turn off specific health checks in configuration files, such as Redis health checks:
management.health.redise.enabled=false
-
By default, all of these health indicators are considered as part of a health check-up.
-
Detailed health examination information
-
By default, simple UP and DOWN states are shown. To query more detailed monitoring metrics information, the following information can be added to the configuration file:
management.endpoint.health.show-details=always
- After restarting, visit the website http://localhost:8080/actuator/health again, and return the following information:
{
  "status": "UP",
  "diskSpace": {
    "status": "UP",
    "total": 209715195904,
    "free": 183253909504,
    "threshold": 10485760
  }
}
- You can see that HealthEndPoint gives us default monitoring results, including disk space describing total disk space, remaining disk space and minimum thresholds.
In fact, if you look at the Spring Boot-actuator source code, you will find that the information provided by HealthEndPoint is not limited to this. Elastic Search HealthIndicator, RedisHealthIndicator, Rabbit HealthIndicator and so on will be found under the package of org.springframework.boot.actuate.health.
2,info
- Info is our own configuration information that starts with info in the configuration file, such as in the sample project:
info.app.name=spring-boot-actuator
info.app.version= 1.0.0
info.app.test= test
- Start the sample project and visit http://localhost:8080/actuator/info to return some information as follows:
{
  "app": {
    "name": "spring-boot-actuator",
    "version": "1.0.0",
    "test":"test"
  }
}
3,beans
- From the example, you can see that the aliases, types, singletons, class addresses, dependencies of bean s are displayed.
- Start the sample project and visit the website http://localhost:8080/actuator/beans to return some information as follows:
[
  {
    "context": "application:8080:management",
    "parent": "application:8080",
    "beans": [
      {
        "bean": "embeddedServletContainerFactory",
        "aliases": [

        ],
        "scope": "singleton",
        "type": "org.springframework.boot.context.embedded.tomcat.TomcatEmbeddedServletContainerFactory",
        "resource": "null",
        "dependencies": [

        ]
      },
      {
        "bean": "endpointWebMvcChildContextConfiguration",
        "aliases": [

        ],
        "scope": "singleton",
        "type": "org.springframework.boot.actuate.autoconfigure.EndpointWebMvcChildContextConfiguration$$EnhancerBySpringCGLIB$$a4a10f9d",
        "resource": "null",
        "dependencies": [

        ]
      }
  }
]
4,conditions
-
Spring Boot's automatic configuration function is very convenient, but sometimes it also means that it's difficult to find out the specific reasons for the problem. Using conditions, you can look at the code at the application runtime to see under what conditions a configuration takes effect, or what an automatic configuration does not take effect.
-
Start the sample project and visit the website http://localhost:8080/actuator/conditions to return some information as follows:
{
    "positiveMatches": {
     "DevToolsDataSourceAutoConfiguration": {
            "notMatched": [
                {
                    "condition": "DevToolsDataSourceAutoConfiguration.DevToolsDataSourceCondition",
                    "message": "DevTools DataSource Condition did not find a single DataSource bean"
                }
            ],
            "matched": [ ]
        },
        "RemoteDevToolsAutoConfiguration": {
            "notMatched": [
                {
                    "condition": "OnPropertyCondition",
                    "message": "@ConditionalOnProperty (spring.devtools.remote.secret) did not find property 'secret'"
                }
            ],
            "matched": [
                {
                    "condition": "OnClassCondition",
                    "message": "@ConditionalOnClass found required classes 'javax.servlet.Filter', 'org.springframework.http.server.ServerHttpRequest'; @ConditionalOnMissingClass did not find unwanted class"
                }
            ]
        }
    }
}
5,configprops
- View the content of the properties set in the configuration file and the default values of some configuration properties.
- Start the sample project and visit the website http://localhost:8080/actuator/configprops to return some information as follows:
{
  ...
  "environmentEndpoint": {
    "prefix": "endpoints.env",
    "properties": {
      "id": "env",
      "sensitive": true,
      "enabled": true
    }
  },
  "spring.http.multipart-org.springframework.boot.autoconfigure.web.MultipartProperties": {
    "prefix": "spring.http.multipart",
    "properties": {
      "maxRequestSize": "10MB",
      "fileSizeThreshold": "0",
      "location": null,
      "maxFileSize": "1MB",
      "enabled": true,
      "resolveLazily": false
    }
  },
  "infoEndpoint": {
    "prefix": "endpoints.info",
    "properties": {
      "id": "info",
      "sensitive": false,
      "enabled": true
    }
  }
  ...
}
6,env
-
It shows the configuration information of system environment variables, including the environment variables used, JVM attributes, command line parameters, jar packages used by the project and so on. Unlike configprops, configprops focuses on configuration information and env on running environment information.
-
Start the sample project and visit the website http://localhost:8080/actuator/env to return some information as follows:
{
  "profiles": [

  ],
  "server.ports": {
    "local.management.port": 8088,
    "local.server.port": 8080
  },
  "servletContextInitParams": {

  },
  "systemProperties": {
    "com.sun.management.jmxremote.authenticate": "false",
    "java.runtime.name": "Java(TM) SE Runtime Environment",
    "spring.output.ansi.enabled": "always",
    "sun.boot.library.path": "C:\\Program Files\\Java\\jdk1.8.0_101\\jre\\bin",
    "java.vm.version": "25.101-b13",
    "java.vm.vendor": "Oracle Corporation",
    "java.vendor.url": "http://java.oracle.com/",
    "java.rmi.server.randomIDs": "true",
    "path.separator": ";",
    "java.vm.name": "Java HotSpot(TM) 64-Bit Server VM",
    "file.encoding.pkg": "sun.io",
    "user.country": "CN",
    "user.script": "",
    "sun.java.launcher": "SUN_STANDARD",
    "sun.os.patch.level": "",
    "PID": "5268",
    "com.sun.management.jmxremote.port": "60093",
    "java.vm.specification.name": "Java Virtual Machine Spe
- To avoid sensitive information being exposed to / env, all attributes named password, secret, key (or the last paragraph of the name is these) are added to / env with "*". For example, if there is an attribute named database.password, it will display in / env as follows:
"database.password":"******"
- / Use of env/{name}
It's an extension of Env that retrieves the specified configuration information, such as http://localhost:8080/actuator/env/java.vm.version, and returns
{"java.vm.version":"25.101-b13"}
7,heapdump
- Returns a GZip-compressed JVM heap dump.
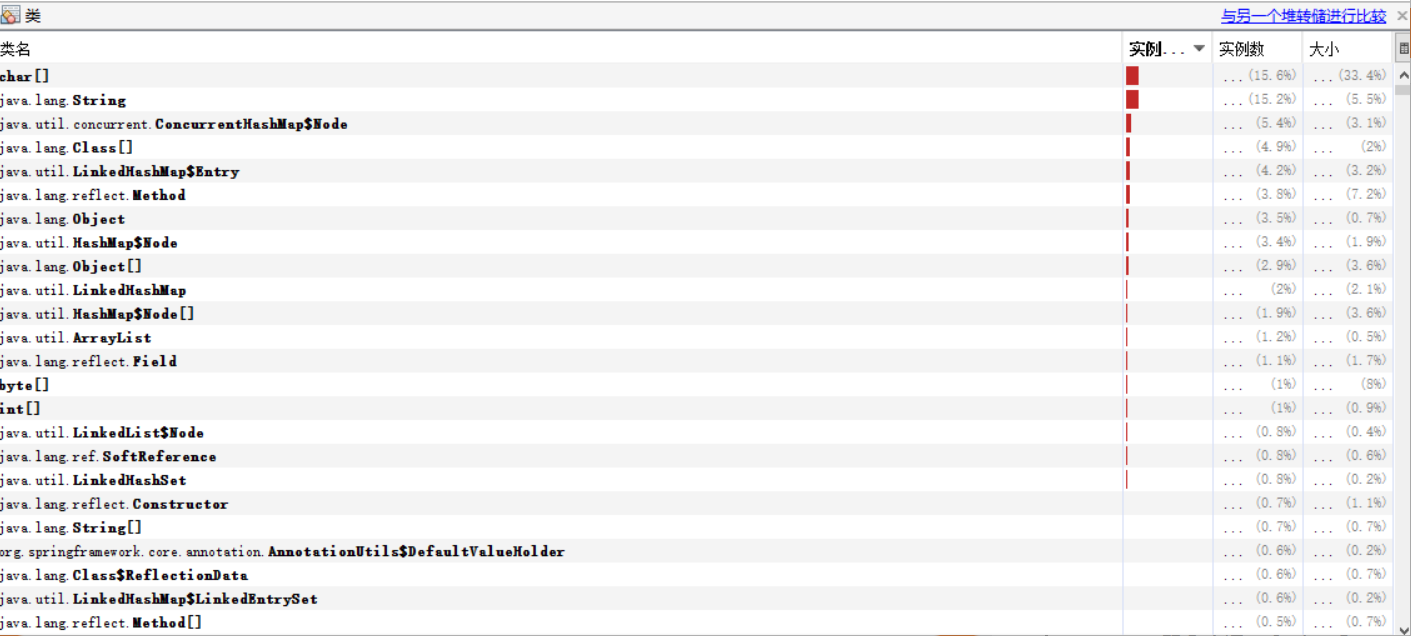
- Start the sample project, visit the website http://localhost:8080/actuator/heapdump will automatically generate a heap file heapdump of JVM, which can be opened by JDK's own JVM monitoring tool Visual VM to view the memory snapshot. Similar to the following figure:

8,httptrace
-
This endpoint is used to return basic HTTP trace information. By default, tracing information is stored in the way of memory implemented by org. spring framework. boot. actuate. trace. InMemoryTraceRepository, which always keeps the latest 100 request records.
-
Start the sample project, visit the website http://localhost:8080/actuator/httptrace, and return the following information:
{
    "traces": [
        {
            "timestamp": "2018-11-21T12:42:25.333Z",
            "principal": null,
            "session": null,
            "request": {
                "method": "GET",
                "uri": "http://localhost:8080/actuator/heapdump",
                "headers": {
                    "cookie": [
                        "Hm_lvt_0fb30c642c5f6453f17d881f529a1141=1513076406,1514961720,1515649377; Hm_lvt_6d8e8bb59814010152d98507a18ad229=1515247964,1515296008,1515672972,1516086283; UM_distinctid=1647364371ef6-003ab9d0469ea5-b7a103e-100200-1647364371f104; CNZZDATA1260945749=232252692-1513233181-%7C1537492730"
                    ],
                    "accept-language": [
                        "zh-CN,zh;q=0.9"
                    ],
                    "upgrade-insecure-requests": [
                        "1"
                    ],
                    "host": [
                        "localhost:8080"
                    ],
                    "connection": [
                        "keep-alive"
                    ],
                    "accept-encoding": [
                        "gzip, deflate, br"
                    ],
                    "accept": [
                        "text/html,application/xhtml+xml,application/xml;q=0.9,image/webp,image/apng,*/*;q=0.8"
                    ],
                    "user-agent": [
                        "Mozilla/5.0 (Windows NT 10.0; Win64; x64) AppleWebKit/537.36 (KHTML, like Gecko) Chrome/63.0.3239.84 Safari/537.36"
                    ]
                },
                "remoteAddress": null
            },
            "response": {
                "status": 200,
                "headers": {
                    "Accept-Ranges": [
                        "bytes"
                    ],
                    "Content-Length": [
                        "39454385"
                    ],
                    "Date": [
                        "Wed, 21 Nov 2018 12:42:25 GMT"
                    ],
                    "Content-Type": [
                        "application/octet-stream"
                    ]
                }
            },
            "timeTaken": 1380
        },
        {
           ...
        },
          ...
    ]
}
- Details of the entire process of the request are recorded.
9,metrics
- One of the most important monitoring contents is the monitoring of JVM content usage, GC situation, class loading information and so on.
- Start the sample project and visit the website http://localhost:8080/actuator/metrics to return some information as follows:
{
  "mem": 337132,
  "mem.free": 183380,
  "processors": 4,
  "instance.uptime": 254552,
  "uptime": 259702,
  "systemload.average": -1.0,
  "heap.committed": 292864,
  "heap.init": 129024,
  "heap.used": 109483,
  "heap": 1827840,
  "nonheap.committed": 45248,
  "nonheap.init": 2496,
  "nonheap.used": 44269,
  "nonheap": 0,
  "threads.peak": 63,
  "threads.daemon": 43,
  "threads.totalStarted": 83,
  "threads": 46,
  "classes": 6357,
  "classes.loaded": 6357,
  "classes.unloaded": 0,
  "gc.ps_scavenge.count": 8,
  "gc.ps_scavenge.time": 99,
  "gc.ps_marksweep.count": 1,
  "gc.ps_marksweep.time": 43,
  "httpsessions.max": -1,
  "httpsessions.active": 0
}
-
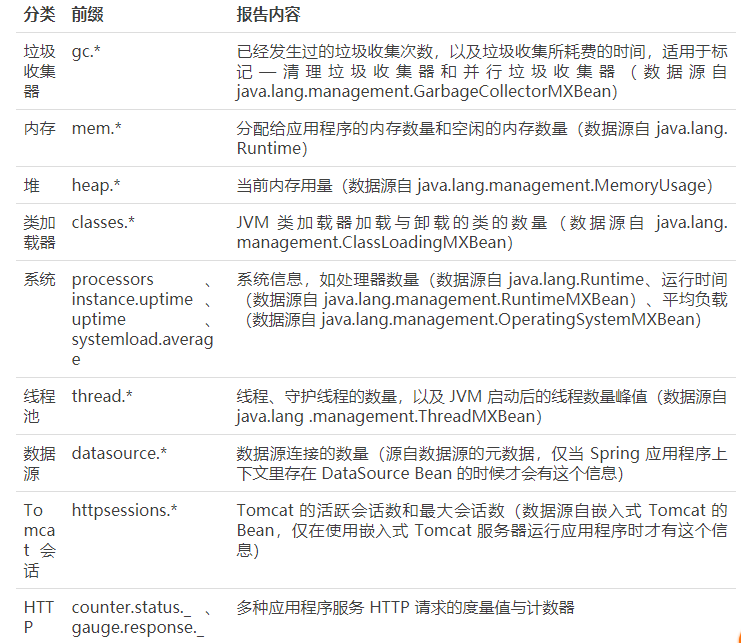
A simple classification of the information provided by the / metrics interface is shown in the following table:
-

-
interpretative statement
- Note that some of the metrics here, such as data sources and Tomcat sessions, have data only when specific components are running in the application, and you can register your own metrics.
- HTTP counters and metrics need a little explanation. The value after counter.status is the HTTP status code, followed by the requested path. For example, counter.status.200.metrics indicates the number of times the / metrics endpoint returns a 200(OK) status code.
- HTTP's measurement information is similar in structure, but it reports another kind of information. They all start with gauge.response, which indicates that this is the measurement information of HTTP response. The prefix and suffix are the corresponding path. The measurement value is in milliseconds, which reflects the time taken to process the path request recently.
- There are several special values to note here. The root path points to the root path or /. Star-star represents the path Spring considers to be a static resource, including images, JavaScript, and stylesheets. It also contains resources that cannot be found, which is why counter.status.404.star-star is often seen. Because the number of requests returned in HTTP 404 (NOT FOUND) status.
- / The metrics interface returns all available metrics, but you may only be interested in one value. To get a single value, you can add the corresponding key name after the URL when requesting. For example, to see the size of free memory, you can send a GET request to / metrics / mem. free, such as accessing the website http://localhost:8080/actuator/metrics/mem.free, and returning: {"mem.free":178123}.
10,shutdown
- Opening the interface gracefully closes the Spring Book application. To use this function, you first need to open it in the configuration file:
management.endpoint.shutdown.enabled=true
- After the configuration is complete, start the sample project and use curl to simulate post requests to access the shutdown interface.
The shutdown interface only supports post requests by default.
curl -X POST "http://localhost:8080/actuator/shutdown"
{
    "message": "Shutting down, bye..."
}
- At this point, you will find that the application has been shut down.
11,mappings
- Describes all URI paths and their mapping to the controller.
- Start the sample project and visit the website http://localhost:8080/actuator/mappings to return some information as follows:
{
  "/**/favicon.ico": {
    "bean": "faviconHandlerMapping"
  },
  "{[/hello]}": {
    "bean": "requestMappingHandlerMapping",
    "method": "public java.lang.String com.neo.controller.HelloController.index()"
  },
  "{[/error]}": {
    "bean": "requestMappingHandlerMapping",
    "method": "public org.springframework.http.ResponseEntity<java.util.Map<java.lang.String, java.lang.Object>> org.springframework.boot.autoconfigure.web.BasicErrorController.error(javax.servlet.http.HttpServletRequest)"
  }
}
12,threaddump
-
/ The threaddump interface generates snapshots of current thread activity. This function is very good. It is convenient for us to look at the situation of threads when we locate problems everyday. It mainly shows the thread name, thread ID, thread status, whether to wait for lock resources and so on.
-
Start the sample project and visit the website http://localhost:8080/actuator/threaddump to return some information as follows:
[
  {
    "threadName": "http-nio-8088-exec-6",
    "threadId": 49,
    "blockedTime": -1,
    "blockedCount": 0,
    "waitedTime": -1,
    "waitedCount": 2,
    "lockName": "java.util.concurrent.locks.AbstractQueuedSynchronizer$ConditionObject@1630a501",
    "lockOwnerId": -1,
    "lockOwnerName": null,
    "inNative": false,
    "suspended": false,
    "threadState": "WAITING",
    "stackTrace": [
      {
        "methodName": "park",
        "fileName": "Unsafe.java",
        "lineNumber": -2,
        "className": "sun.misc.Unsafe",
        "nativeMethod": true
      },
      ...
      {
        "methodName": "run",
        "fileName": "TaskThread.java",
        "lineNumber": 61,
        "className": "org.apache.tomcat.util.threads.TaskThread$WrappingRunnable",
        "nativeMethod": false
      }
      ...
    ],
    "lockInfo": {
      "className": "java.util.concurrent.locks.AbstractQueuedSynchronizer$ConditionObject",
      "identityHashCode": 372286721
    }
  }
  ...
]
- When problems arise in production, the thread snapshot of the application can be used to detect the tasks being performed by the application.
Four, summary
Through the practice of this lesson, we found that Spring Boot Actuator is very powerful as the monitoring component of Spring Boot. It can monitor and manage Spring Boot applications, such as health check, audit, statistics and HTTP tracing. All these features can be obtained through JMX or HTTP endpoints. After using Spring Boot Actuator, we can query all the running state of the application through a very simple interface or command, so that we can have a good grasp of the running state of the application.