
Preface
Alibaba provides a console that demonstrates Sentinel's basic capabilities and workflow without relying on the components necessary in a production environment, such as a persistent back-end database, a reliable configuration center, and so on.Sentinel currently stores monitoring and rule data in an in-memory mode, with a maximum storage time of 5 minutes, and data is lost after the console restarts.
Enterprise Edition
Here we recommend the official version of Aliyun. The AHAS Sentinel Console is the version on Aliyun of Sentinel Console, which provides enterprise-level console services, including:
- Real-time Request Link Viewing
- And all sorts of cool monitoring charts
- Reliable real-time monitoring and historical monitoring data query without self-storage and pulling
- Dynamic rule management/push without self-configuring external data sources
Free version, can provide free credits for 5 nodes.Open Professional Edition to enjoy unlimited node quota.
Professional version has no instance connection restrictions, the first five downgraded nodes per day after opening are not charged, and the excess part is charged 3 yuan per day per instance.
thinking
The official documentation also provides ideas for extending the MetricsRepository interface (version 0.2.0) to monitor data persistence, then registering it as a Spring Bean and specifying the corresponding bean name in the appropriate location with the @Qualifier annotation.The MetricsRepository interface defines the following functions:
save and saveAll: Store the corresponding monitoring data
queryByAppAndResourceBetween: Query monitoring data for a resource for an application over a period of time
listResourcesOfApp: Query all resources under an application
The default monitoring data type is MetricEntity, which contains information such as application name, timestamp, resource name, number of exceptions, number of request passes, number of request rejections, and average response time.
For the storage of monitoring data, users need to consider how to store the monitoring data based on their own storage accuracy.Obviously we want to use the most popular sequential database InfluxDB solution, don't ask anything?Close your eyes and enjoy.
model selection
InfluxDB is an open source distributed database of time series, events, and metrics.Write in Go without external dependency.
Applications: Backend storage for performance monitoring, application metrics, Internet of Things sensor data and real-time analysis, etc.
Powerful class SQL syntax
Built-in http support, read and write using HTTP
Event-based: It supports arbitrary event data
Unstructured (modeless): can be any number of columns
Measurability: You can compute large amounts of data in real time
Continuous high concurrent write, no update, data compressed storage, low query latency
Supports a series of functions such as min, max, sum, count, mean, median, etc.
Supports time-dependent correlation functions (e.g., maximum, minimum, sum, etc.) based on time series
Reform
InfluxDB Installation
First you have to have an Influxdb database. It is recommended that you install it as a Docker. More can be found at the end of the article.
It is important to note that the Administrator Interface has been deprecated from version 1.1.0 and will be removed from version 1.3.0.Disabled by default.If you want, you can still enable it by setting the following environment variables.
The following ports are important and are used by InfluxDB.
- 8086 HTTP API port
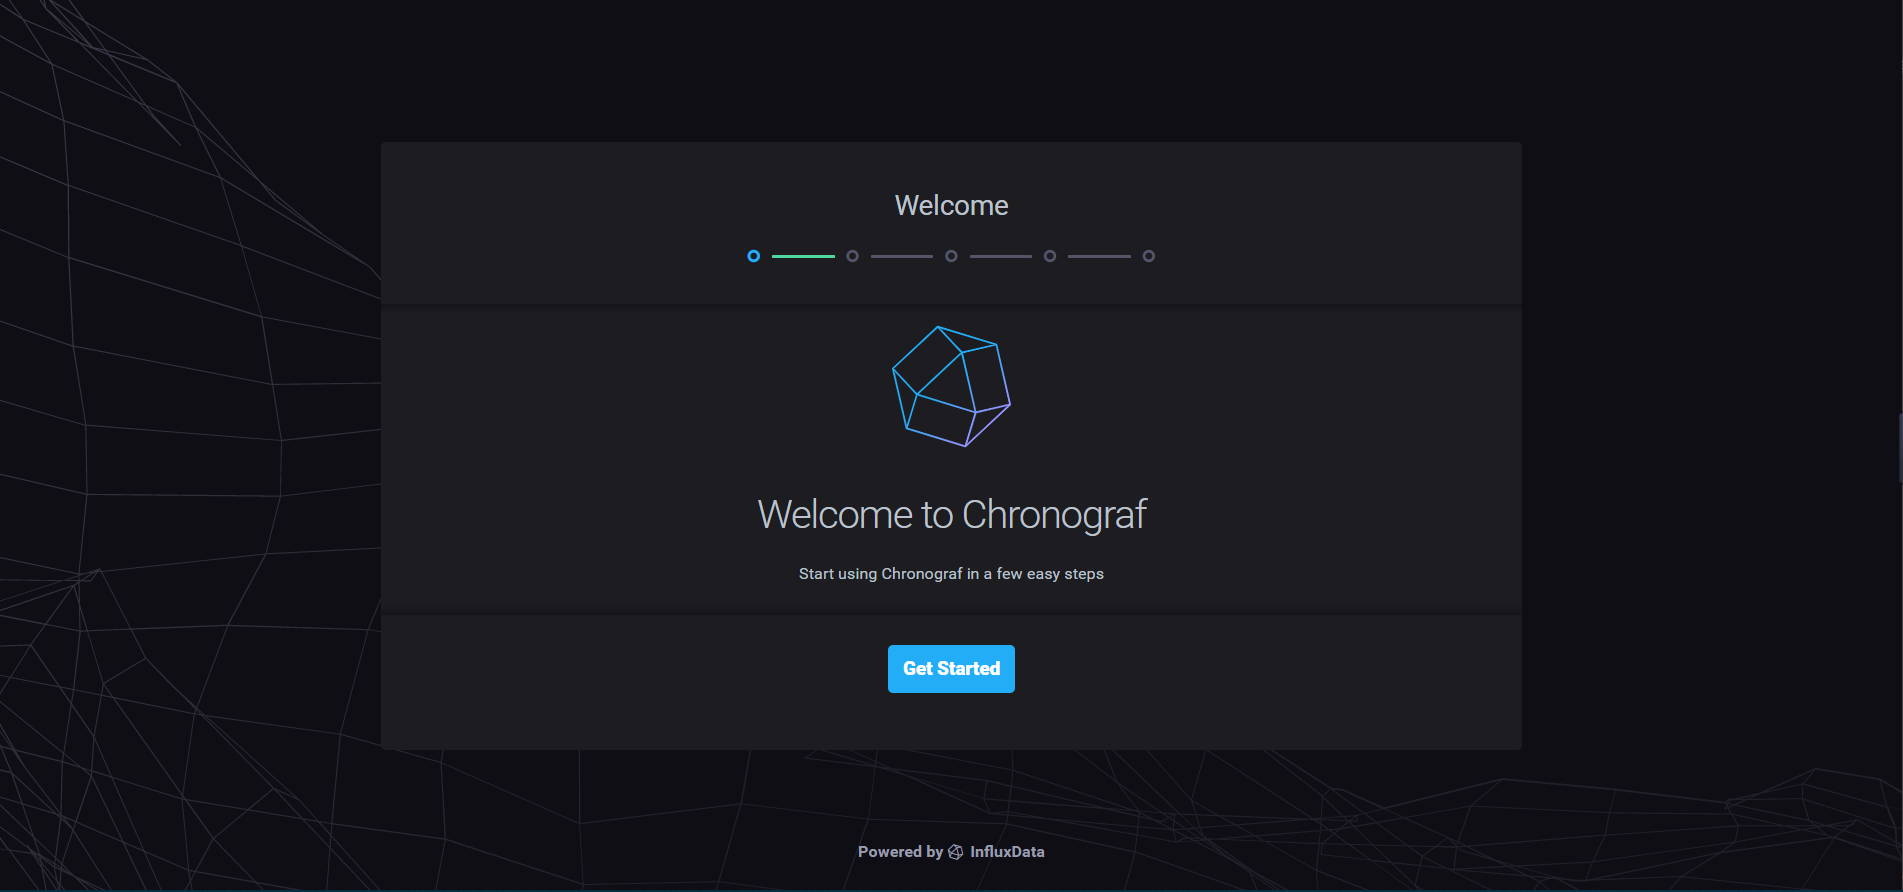
- 8083 Administrator Interface Port (if enabled, 1.7.8 does not seem to work), chronograf is officially recommended
From this command, generate a default configuration file:
docker run --rm influxdb influxd config > influxdb.conf
Create and run containers:
docker run -d \
        -p 8086:8086 \
        -p 8083:8083 \
        -e INFLUXDB_ADMIN_ENABLED=true \
        -v $PWD/data:/var/lib/influxdb/ \
        -v $PWD/config/influxdb.conf:/etc/influxdb/influxdb.conf:ro \
        --name influx \
        influxdb -config /etc/influxdb/influxdb.conf
The production environment must turn on permission validation and modify the influxdb.conf configuration:
[http]
  enabled = true
  bind-address = ":8086"
  auth-enabled = true # authentication
Create user:
# Enter Container
docker exec -it influx  /bin/sh
# Connect
influx
# Create User
CREATE USER admin with PASSWORD 'admin' WITH ALL PRIVILEGES
Exit and log in again:
# User password login
influx -username admin -password admin
# Create a database
CREATE DATABASE sentinel_log
Sentinel Console Revamp
pom.xml introduces the official Open Source Toolkit for influxdb:
<dependency>
     <groupId>org.influxdb</groupId>
     <artifactId>influxdb-java</artifactId>
     <version>2.15</version>
</dependency>
Profile introduction:
# Replace API Address Self: Port
spring.influx.url=http://127.0.0.1:8086
spring.influx.user=admin
spring.influx.password=admin
spring.influx.database=sentinel_log
Configure data sources:
/**
 * InfluxDb To configure
 * Creator Java Notes
 * URL https://blog.52itstyle.vip
 */
@Configuration
public class InfluxDbConfig {

    @Value("${spring.influx.url:''}")
    private String influxDBUrl;

    @Value("${spring.influx.user:''}")
    private String userName;

    @Value("${spring.influx.password:''}")
    private String password;

    @Value("${spring.influx.database:''}")
    private String database;

    @Bean
    public InfluxDB influxDB(){
        InfluxDB influxDB = InfluxDBFactory.connect(influxDBUrl, userName, password);
        try {
            /**
             * Asynchronous insertion:
             * enableBatch Here the first is the number of point s, the second is the time in milliseconds
             * point Number and time are used in combination if 100 or 2000 milliseconds are full
             * A write request is sent when either condition is met.
             */
            influxDB.setDatabase(database)
                    .enableBatch(100,2000, TimeUnit.MILLISECONDS);
        } catch (Exception e) {
            e.printStackTrace();
        } finally {
            influxDB.setRetentionPolicy("autogen");
        }
        influxDB.setLogLevel(InfluxDB.LogLevel.BASIC);
        return influxDB;
    }
}
Implement the MetricsRepository interface, override the implementation:
/**
 * Data CURD
 * Creator Java Notes
 * URL https://blog.52itstyle.vip
 */
@Component("inInfluxdbMetricsRepository")
public class InInfluxdbMetricsRepository implements MetricsRepository<MetricEntity> {

    @Autowired
    public InfluxDB influxDB;

    @Override
    public synchronized void save(MetricEntity metric) {
       //Omit code, too long, refer to memory writing, refer to saveAll Here is a single insert
    }

    @Override
    public synchronized void saveAll(Iterable<MetricEntity> metrics) {
        if (metrics == null) {
            return;
        }
        BatchPoints batchPoints = BatchPoints.builder()
                .tag("async", "true")
                .consistency(InfluxDB.ConsistencyLevel.ALL)
                .build();
        metrics.forEach(metric->{
            Point point = Point
                    .measurement("sentinelInfo")
                    //Use subtle here, and use nanoseconds if you still have override data, so that time and tag are unique
                    .time(System.currentTimeMillis(), TimeUnit.MICROSECONDS)
                    .tag("app",metric.getApp())//tag Data Walk Indexing
                    .addField("gmtCreate", metric.getGmtCreate().getTime())
                    .addField("gmtModified", metric.getGmtModified().getTime())
                    .addField("timestamp", metric.getTimestamp().getTime())
                    .addField("resource", metric.getResource())
                    .addField("passQps", metric.getPassQps())
                    .addField("successQps", metric.getSuccessQps())
                    .addField("blockQps", metric.getBlockQps())
                    .addField("exceptionQps", metric.getExceptionQps())
                    .addField("rt", metric.getRt())
                    .addField("count", metric.getCount())
                    .addField("resourceCode", metric.getResourceCode())
                    .build();
            batchPoints.point(point);
        });
        //Batch Insert
        influxDB.write(batchPoints);
    }

    @Override
    public synchronized List<MetricEntity> queryByAppAndResourceBetween(String app, String resource, long startTime, long endTime) {
       //Omit code, too long, reference memory writing
    }

    @Override
    public synchronized List<String> listResourcesOfApp(String app) {
       //Omit code, too long, reference memory writing
    }
}
Modify the way metricStore is injected into MetricFetcher and MetricController, respectively, using Influxdb:
/**
 * injection
 * Creator Java Notes
 * URL https://blog.52itstyle.vip
 */
@Autowired
@Qualifier("inInfluxdbMetricsRepository")
private MetricsRepository<MetricEntity> metricStore;
When the configuration is complete, we restart the console and access the client project. If the console prints the following data, the configuration is successful:
2019-09-21 19:47:25 [sentinel-dashboard-metrics-fetchWorker-thread-2] INFO  okhttp3.OkHttpClient - --> POST http://118.190.247.102:8086/write?db=sentinel_log&precision=n&consistency=all (486-byte body)
2019-09-21 19:47:25 [sentinel-dashboard-metrics-fetchWorker-thread-2] INFO  okhttp3.OkHttpClient - <-- 204 No Content http://118.190.247.102:8086/write?db=sentinel_log&precision=n&consistency=all (46ms, 0-byte body)
Access the client project several times and then log on to the console to view it. The following results indicate that the transformation was successful:
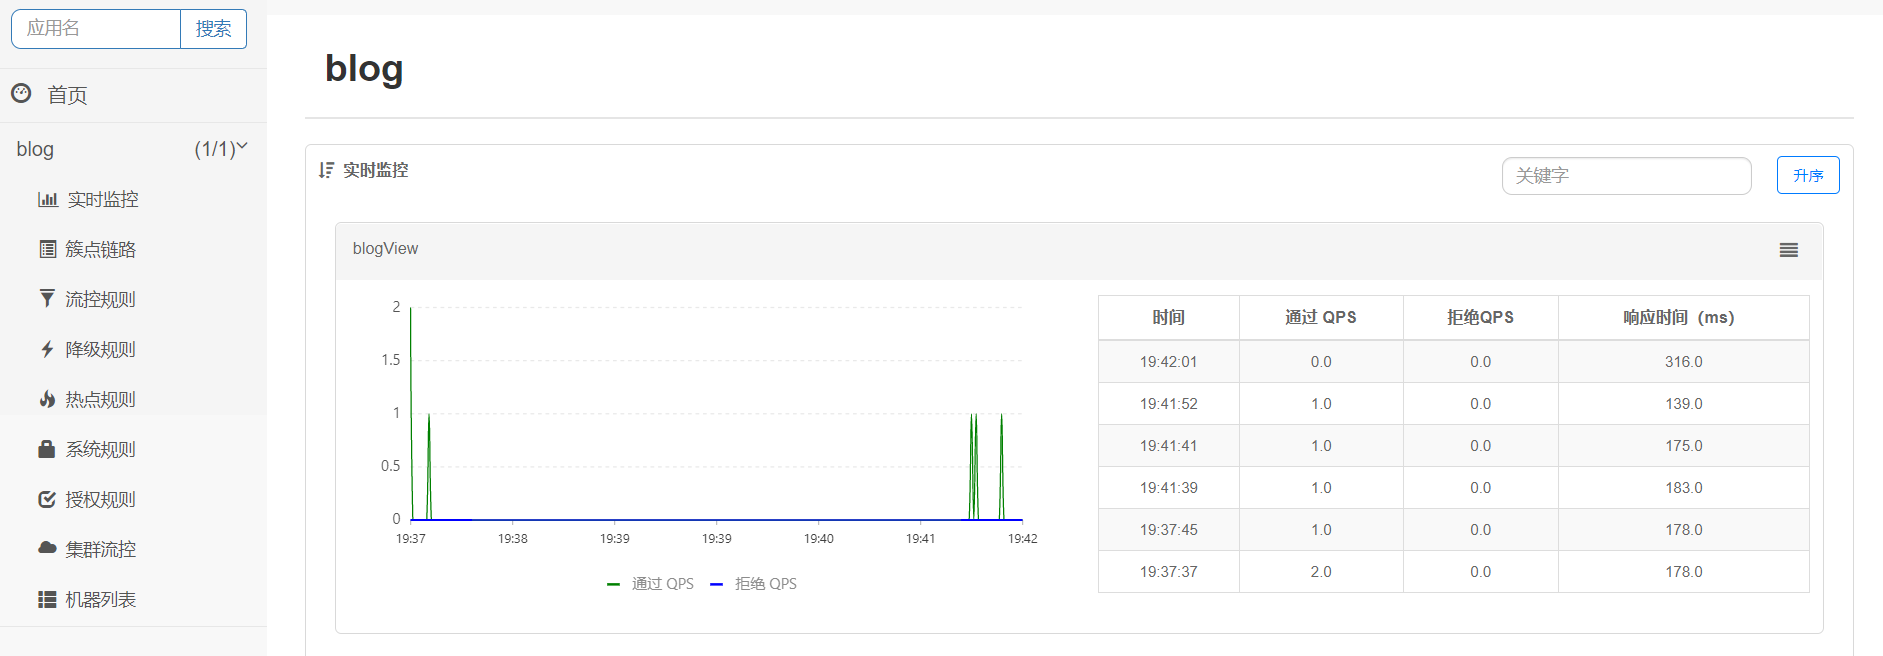
Matters needing attention:
The official front end does not implement query search by time range and needs to be implemented by itself
The default query for real-time monitoring by the official console is the ranking of hot resources in the last minute, see method listResourcesOfApp
Official console real-time monitoring Right Table default query is the last five minutes of hot spot access details, see method queryTopResourceMetric
Summary
For the official five-minute castration version, the streaming data storage implemented by the time series database is still helpful for the production environment, such as real-time data analysis, hot spot resources, monitoring and warning, etc.Small partners can also combine Chronograf and Grafana to make more dazzling screen monitoring based on actual production needs.
Source code
https://gitee.com/52itstyle/sentinel-dashboard
Reference resources
https://blog.52itstyle.vip/archives/4460/
https://hub.docker.com/_/influxdb
https://hub.docker.com/_/chronograf
https://github.com/influxdata/influxdb-java
https://github.com/influxdata/influxdb-python
https://help.aliyun.com/document_detail/97578.htm