What's the ghost of Arthas?
Arthas is an Alibaba Open Source Java online diagnostic tool, which is very powerful and can solve many online problems that are not easy to solve.
Arthas diagnoses using command-line interaction mode, supporting JDK6+, Linux, Mac, Windows operating systems, commands also support the use of tab keys to automatically complete all kinds of information, which is very easy to diagnose.
This is its official website:
https://alibaba.github.io/arthas/index.html
Github address:
https://github.com/alibaba/arthas
What problems can Arthas solve?
Let's look at Arthas's official explanation.
When you are confronted with the following similar problems and you are helpless, Arthas can help you solve them:
1. From which jar package does this class load? Why do you report various kinds of Exception s?
2. Why hasn't my code been executed? Am I not commit? Is the branch wrong?
3. You can't debug online when you encounter problems. Can you only redistribute it by adding logs?
4. There is a problem with data processing of a user online, but it can not debug online and can not be reproduced offline.
5. Is there a global perspective to see how the system works?
6. What can we do to monitor the real-time running state of JVM?
Do you think it's too compelling after reading it?
Especially, it can decompile classes online and debug and track problem codes online without adding logs.
Since it's so compelling, there must be many companies using it. Here's a list of the official login sequence diagrams.

express setup
Officially, arthas-boot is recommended for installation, which is very convenient. The following is a demonstration based on the Linux system environment. The general solution to online problems is also based on the Linux environment.
Step 1: Download
Download the arthas-boot package in any directory.
wget https://alibaba.github.io/arthas/arthas-boot.jar
[root@VM_0_7_centos ~]# wget https://alibaba.github.io/arthas/arthas-boot.jar
--2019-07-30 14:48:31--  https://alibaba.github.io/arthas/arthas-boot.jar
Resolving alibaba.github.io (alibaba.github.io)... 185.199.108.153, 185.199.109.153, 185.199.110.153, ...
Connecting to alibaba.github.io (alibaba.github.io)|185.199.108.153|:443... connected.
HTTP request sent, awaiting response... 200 OK
Length: 98637 (96K) [application/java-archive]
Saving to: 'arthas-boot.jar'

100%[==========================================================================================================>] 98,637      32.8KB/s   in 2.9s

2019-07-30 14:48:36 (32.8 KB/s) - 'arthas-boot.jar' saved [98637/98637]
Step 2: Operation
Use the java-jar command to execute the arthas-boot package.
java -jar arthas-boot.jar
[INFO] arthas-boot version: 3.1.1
[INFO] Found existing java process, please choose one and hit RETURN.
* [1]: 13062 spring-boot-best-practice-0.0.1-SNAPSHOT.jar
Step 3: Select the process
After running arthas-boot, the console displays all Java processes and selects one that you need to diagnose.
As shown in the second step, there is only one Java process, input serial number 1, return, Arthas will attach to the target process, and output the log:
[INFO] Start download arthas from remote server: https://maven.aliyun.com/repository/public/com/taobao/arthas/arthas-packaging/3.1.1/arthas-packaging-3.1.1-bin.zip
[INFO] Download arthas success.
[INFO] arthas home: /root/.arthas/lib/3.1.1/arthas
[INFO] Try to attach process 13062
[INFO] Attach process 13062 success.
[INFO] arthas-client connect 127.0.0.1 3658
  ,---.  ,------. ,--------.,--.  ,--.  ,---.   ,---.
 /  O  \ |  .--. ''--.  .--'|  '--'  | /  O  \ '   .-'
|  .-.  ||  '--'.'   |  |   |  .--.  ||  .-.  |`.  `-.
|  | |  ||  |\  \    |  |   |  |  |  ||  | |  |.-'    |
`--' `--'`--' '--'   `--'   `--'  `--'`--' `--'`-----'


wiki      https://alibaba.github.io/arthas
tutorials https://alibaba.github.io/arthas/arthas-tutorials
version   3.1.1
pid       13062
time      2019-07-30 14:49:34
At this point, the installation and start-up are completed.
For more installation options, see https://alibaba.github.io/arthas/install-detail.html
Practical use
After starting, the current cursor will enter the arthas console and accept various operation commands.
Next, the head of the stack will do a few demonstrations of common commands, so that you have a basic understanding of it and the ability to quickly start.
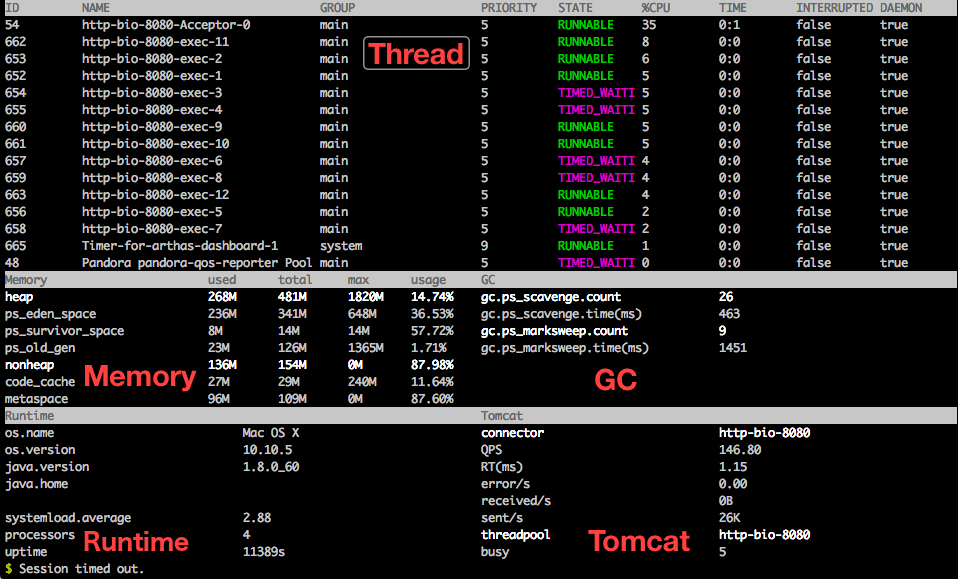
1,dashboard
Display the real-time data panel of the current system, press ctrl+c to exit.
$ dashboard
2,thread
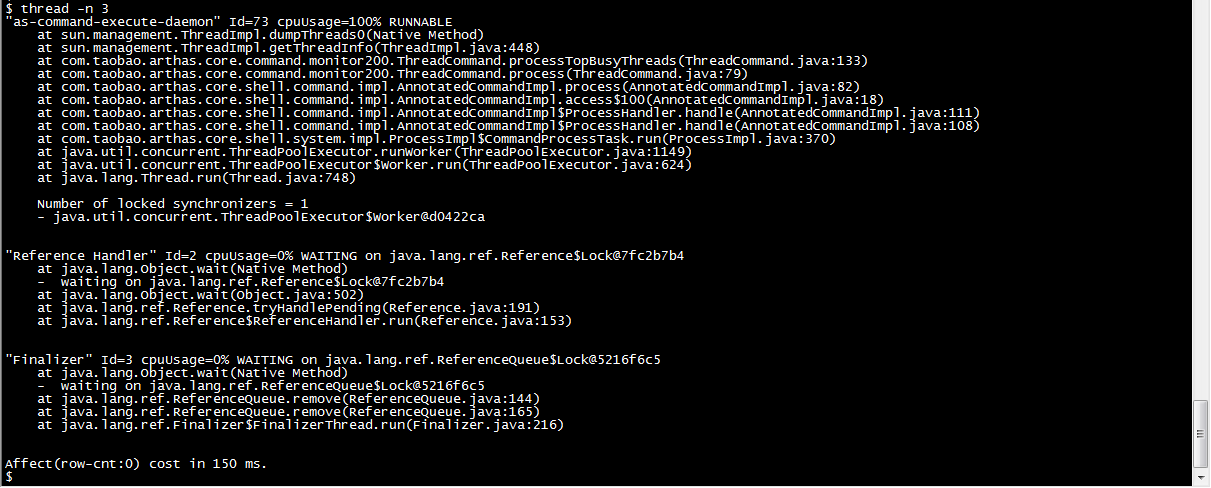
View the thread stack information for the current JVM.
thread id, which shows the running stack of the specified thread:
$ thread 20

Display the current busiest first N threads and print the stack:
$ thread -n 3
3,sc
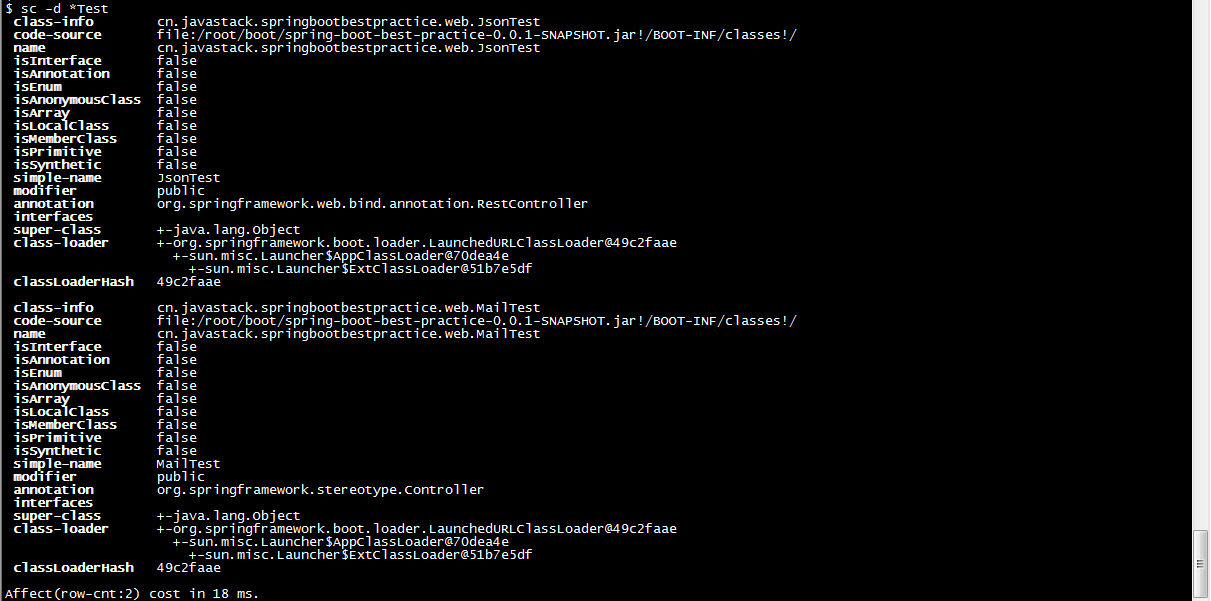
View the class details loaded by the JVM.
$ sc -d *Test
4,sm
View method information for loaded classes.
$ sm -d cn.javastack.springbootbestpractice.SpringBootBestPracticeApplication main

5,jad
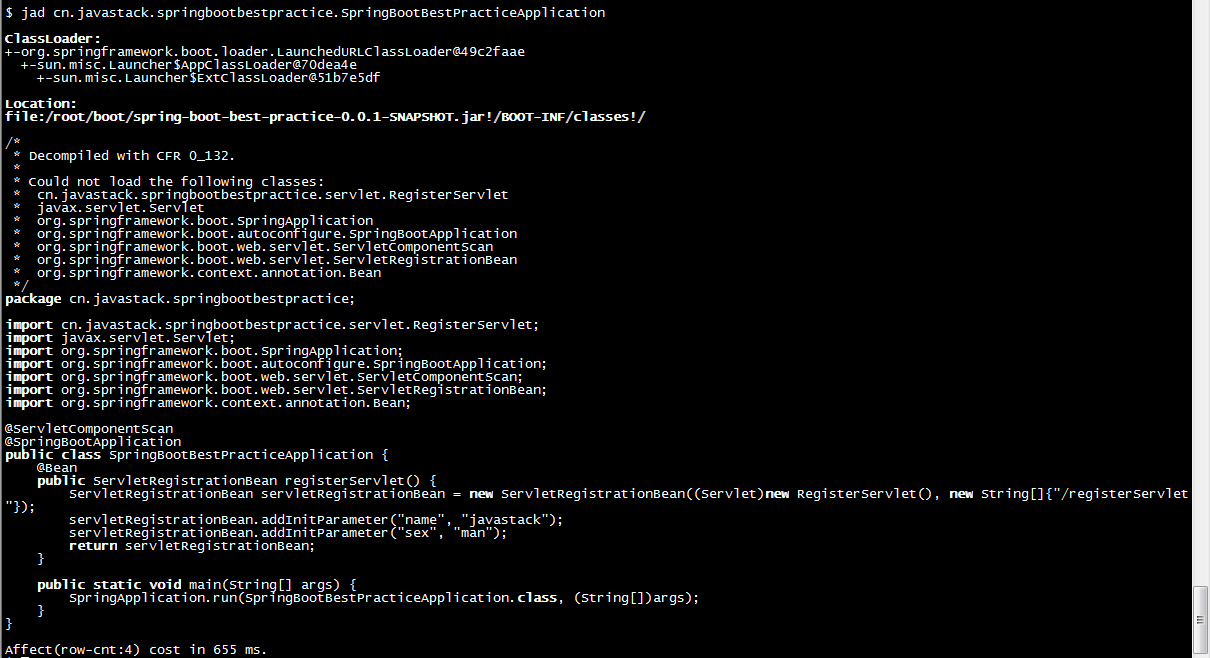
Decompilation specifies the source code of the loaded class.
$ jad cn.javastack.springbootbestpractice.SpringBootBestPracticeApplication
6,trace
Display method internal call paths, non-real-time returned commands and output total time-consuming on method paths, and detailed time-consuming on each node.
$ trace -j cn.javastack.springbootbestpractice.web.JsonTest getUserInfo

- j: Represents a method path that skips the JDK.
7,monitor
Timely monitoring of a method call.
$ monitor cn.javastack.springbootbestpractice.web.JsonTest getUserInfo -c 5
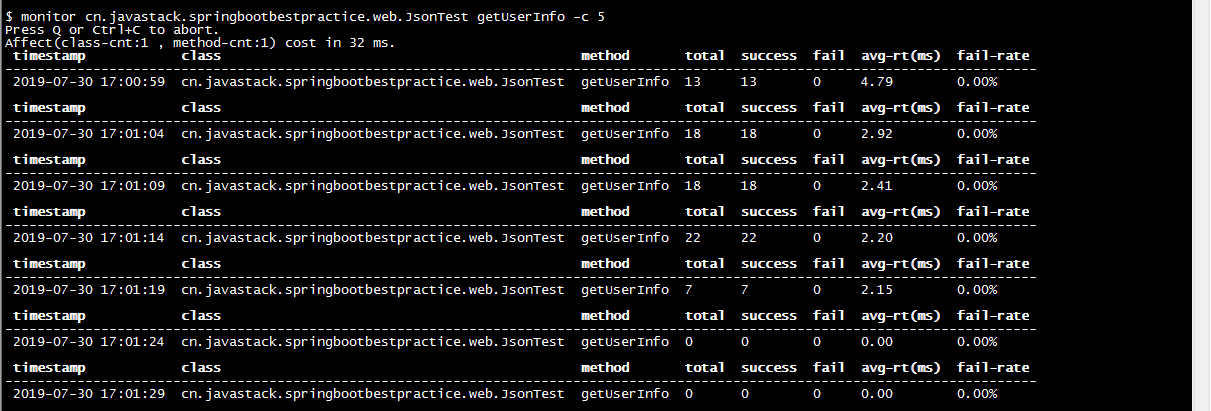
- c 5: Represents statistics every 5 seconds, the statistical period, the default value is 120 seconds.
Monitoring Dimension Description:
| Monitoring items | Explain |
|---|---|
| timestamp | time stamp |
| class | Class name |
| method | Method name |
| total | Number of calls |
| success | Number of successes |
| fail | Number of failures |
| rt | Average response time |
| fail-rate | failure rate |
8,watch
The observation method executes the data, and can easily observe the call situation of the specified method, such as return value, throwing exception, entering parameter, etc.
$ watch cn.javastack.springbootbestpractice.web.JsonTest getUserInfo '{params, returnObj}' -x 2 -b
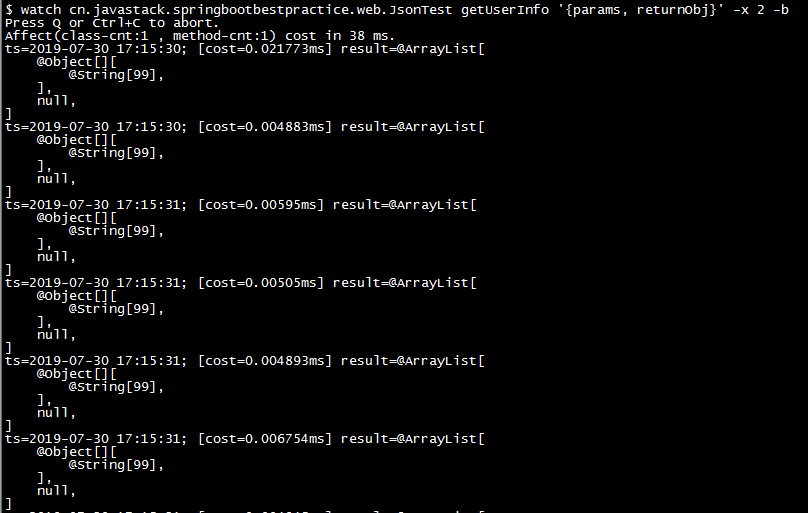
The above monitoring is a method's entry status, which is monitored before the method is executed: - b, traversal depth: - x 2.
9,quit/exit
Exit the current Arthas.
This command only exits the client that is currently connected. Arthas attached to the target process will continue to run. The port will not be closed. It can be used directly next time the connection is made.
10,shutdown
Close the Arthas server and exit all Arthas clients.
The above demonstrates the basic use of 10 commands. Details of the use of various commands can be consulted in the command band - help.
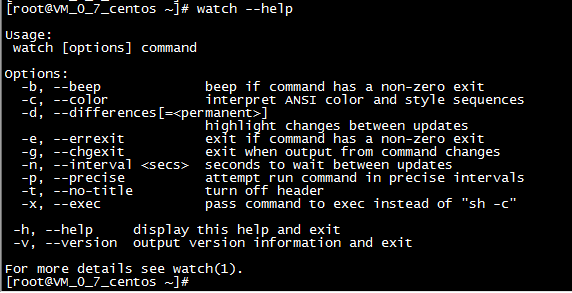
For more commands, see:
https://alibaba.github.io/arthas/commands.html
summary
In conclusion, using Arthas can easily diagnose a Java application, such as system data panel, JVM real-time running status, class loading, monitoring method implementation, displaying method execution path, etc.
These practical functions of Arthas can help us solve some common online problems and are also independent of application code, but they are limited to a JVM process. If it is a distributed system, Arthas is a bit difficult.
Okay, that's all for today's article. Are you also using Arthas? Welcome to leave a message to share your experience. If you think the article is good, you can also share it with your classmates and colleagues.
Pay attention to Wechat Public Number: Java technology stack, reply to "tools" in the background to get the list of future tools shared by the stack leader. There are good Java development tools behind, and the stack leader will share the public number for the first time.
This article was originally published in Wechat Public Number: Java Technology Stack (id:javastack), reprinted please keep the original information.