R Language Drawing: Avenue to Simple Series - barplot
Preface
I know that the drawing tutorials for R language are flying all over the world and I want to do a lot of basic work. On the other hand, I want to make this a series and make it easy for you to learn. The whole series may not feel refreshing, but I try to use the parameters in the help document as much as I can.
Tip: The following is the main body of this article. The following cases can be used as reference.
1. Introduction of barplot parameters
Bar graphs can show the probability, frequency, or percentage distribution of classification variables vertically or horizontally.
This tutorial is divided into one set of bars for observations and one set of bars for multiple groups of observations.
Detailed parameters:
1.height, main, sub: The height of a bar graph, the frequency at which each observation occurs, can be a vector or a matrix.Main, sub is the main title and subtitle.
2.width: The bar width of a bar chart.If the length of the width vector is less than the number of bars, the width is reused.If it is a number, the width will not change because it is equal to the width of each bar or 1:1:1... unless xlim is set.
3.sapce:space is the gap between bars (gap = average bar width)× Sapce).If height s are matrices, beside=TRUE, that is, if the bar graph for multiple groups of observations is displayed, space is the gap within a group from c(m,n), m is the gap between groups, and N is the gap between groups.
4.names.arg: heights are vectors: names.arg names the bars.When heights are matrices: names.arg names the groups.
5.legend.text: Legends are automatically set according to the bar order, and legend.text corresponds to the label name of the legend. If legend.text is TRUE, the label name of the legend corresponds to the name of the vector or the row name of the matrix.
6.beside:TRUE or FALSE, side by side or stacked when the height is a matrix.
7.horize: Place horizontally or not.
8.density, angle: The density and angle of the fill slash in the bar.
9.col, border: Set the bar fill and border color.
10.xlab, ylab: Set the x, y axis title.
11.xlim, ylim, xpd: Set the horizontal and vertical axis limit, xpd: Can the bar chart go beyond the drawing range?
12.log:'x','y','x y', defines whether the x-axis and y-axis are logarithmic transformations.
13.axes:logical, whether to draw the coordinate axis corresponding to the frequency.
14.axisnames: Displays the name of the horizontal coordinate.
15.cex.axis, cex.names: Vertical coordinate label size, cex.names sets the horizontal coordinate label size.
16.axis.lty: The linear form of the transverse coordinate axis, dashed line?Solid line?..
17.offset: Displaces a bar in a specified bar graph up or down.
18.ann: Whether to show (main, sub, xlab, ylab).
19.args.legend: Values are lists containing parameters from the legend() function that allow you to set the details of the legend of a bar chart.
20.data, subset: a dataset, a subset of a dataset.
21.na.action: The way NA values are handled.
22.add: Add to other diagrams.
23.inside This parameter has not been found useful yet!,Use as described in the help document.
Sample data:
a <- c(1,2,3,4,3,2,1)
names(a) <- c('a','b','c','d','e','f','g')
b <- matrix(c(1,2,3,4,2,3,1,4,1),nrow = 3,,byrow = T)
colnames(b) <- c('c1','c2','c3')
rownames(b) <- c('r1','r2','r3')
#Run a, b to view data
> a
a b c d e f g
1 2 3 4 3 2 1
> b
   c1 c2 c3
r1  1  2  3
r2  4  2  3
r3  1  4  1
2. Detailed explanation of barplot parameters
1.height,main,sub
The height is the data source and represents the frequency. It can be a vector or a matrix.
The main parameter sets the caption, and the subcaption sets the subtitle, which is at the bottom of the figure (not discussed later)
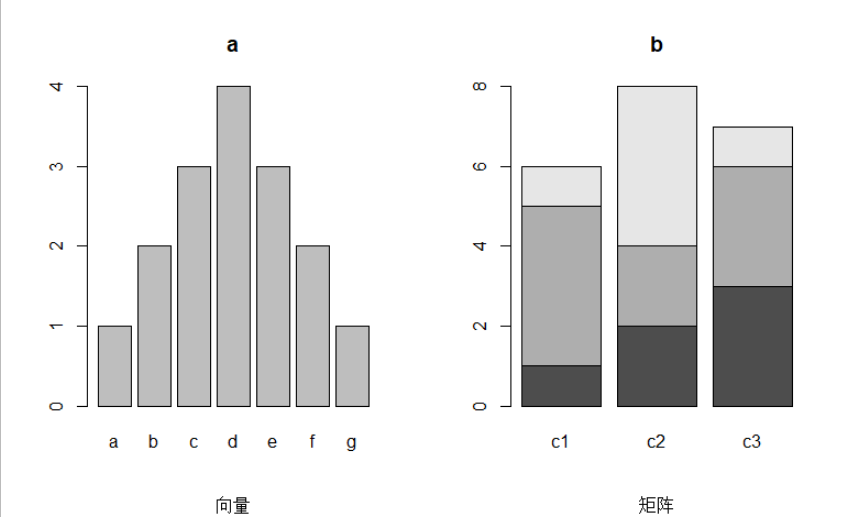
The code is as follows:
opar <- par(mfrow=c(1,2))
barplot(height = a,main = 'a',sub = 'vector')
barplot(height = b,main = 'b',sub = 'matrix')
2.width
By setting the width of the bar, you can see that setting a single value does not change the width unless you set xlim (here is the character's x-coordinate, so you haven't explored it further)
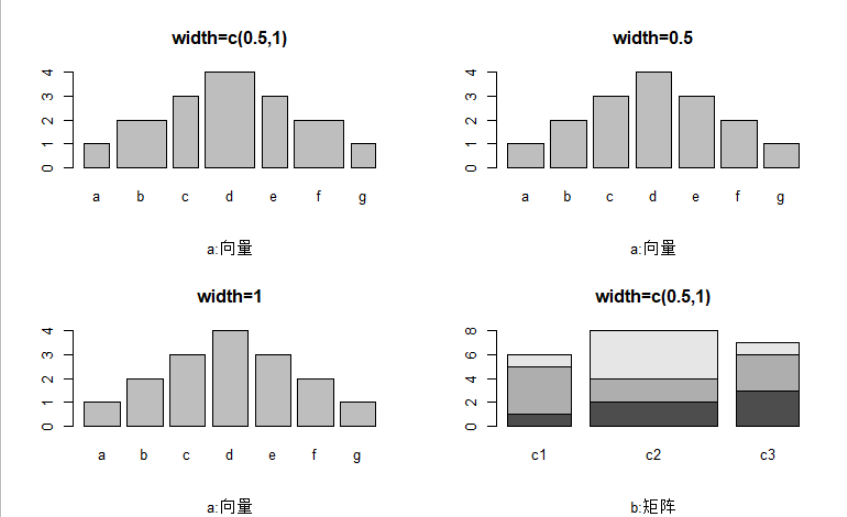
The code is as follows:
##Set Graphic Layout
opar <- par(mfrow=c(2,2))

barplot(height = a,main = 'width=c(0.5,1)',sub = 'a:vector',width = c(0.5,1))
barplot(height = a,main = 'width=0.5',sub = 'a:vector',width = 0.5)
barplot(height = a,main = 'width=1',sub = 'a:vector',width = 1)
barplot(height = b,main = 'width=c(0.5,1)',sub = 'b:matrix',width = c(0.5,1))
3.space
If heights are vectors, space is the gap to the left of the bar (gap = average bar width)× sapce).If heights are matrices, beside=TRUE, that is, if space is c(m,n), then M is the gap within the group, and N is the gap between groups.

The code is as follows:
##Set Graphic Layout
opar <- par(mfrow=c(2,2))
barplot(height = a,main = 'space=c(0,1,2,3)',sub = 'a:vector',space = c(0,1,2,3))
barplot(height = a,main = 'space=1',sub = 'a:vector',space = 1)
barplot(height = b,main = 'space=c(0.5,3)',sub = 'b:matrix',space = c(0.5,3),
        beside = T,col = c('red','lightblue','green') )
legend(legend = rownames(b),x = 15,y=4,fill = c('red','lightblue','green'),cex = 0.6,horiz = T)
barplot(height = b,main = 'space=c(3,0.5)',sub = 'b:matrix',space = c(3,0.5),
        beside = T,col = c('red','lightblue','green') )
legend(legend = rownames(b),x = 20,y=4,fill = c('red','lightblue','green'),cex = 0.6,horiz = T)
4.names.arg
When height s are vectors: names.arg names the bars
When height s are matrices: names.arg names groups

The code is as follows:
opar <- par(mfrow=c(2,2))
barplot(height = a,main = 'names.arg = c(1,2,3,4,5,6,7)',sub = 'a:vector',names.arg = c(1,2,3,4,5,6,7))
barplot(height = a,main = 'names.arg = c(7,6,5,4,3,2,1)',sub = 'a:vector',names.arg = c(7,6,5,4,3,2,1))
barplot(height = b,main = 'names.arg = c(1,2,3)',sub = 'b:matrix',beside = T,names.arg = c(1,2,3))
barplot(height = b,main = 'names.arg = c(3,2,1)',sub = 'b:matrix',beside = T,names.arg = c(3,2,1))
5.legend.text
Legends are automatically set according to the bar order, and legend.text corresponds to the label name of the legend. text. If legend.text is TRUE, the label name of the legend corresponds to the name of the vector or the row name of the matrix
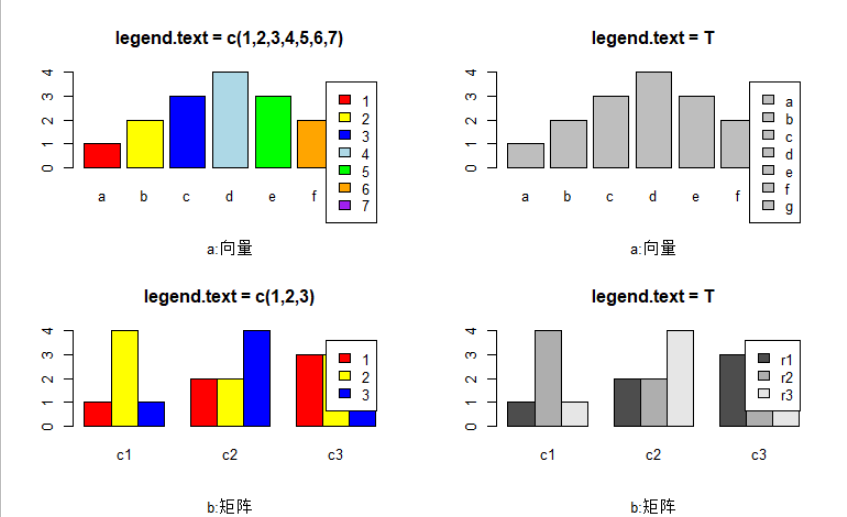
The code is as follows:
opar <- par(mfrow=c(2,2))
barplot(height = a,main = 'legend.text = c(1,2,3,4,5,6,7)',sub = 'a:vector',col = c('red','yellow','blue','lightblue','green','orange','purple'),legend.text = c(1,2,3,4,5,6,7))
barplot(height = a,main = 'legend.text = T',sub = 'a:vector',legend.text = T)
barplot(height = b,main = 'legend.text = c(1,2,3)',col = c('red','yellow','blue'),sub = 'b:matrix',beside = T,legend.text = c(1,2,3))
barplot(height = b,main = 'legend.text = T',sub = 'b:matrix',beside = T,legend.text = T)
6.beside
Is it stacked
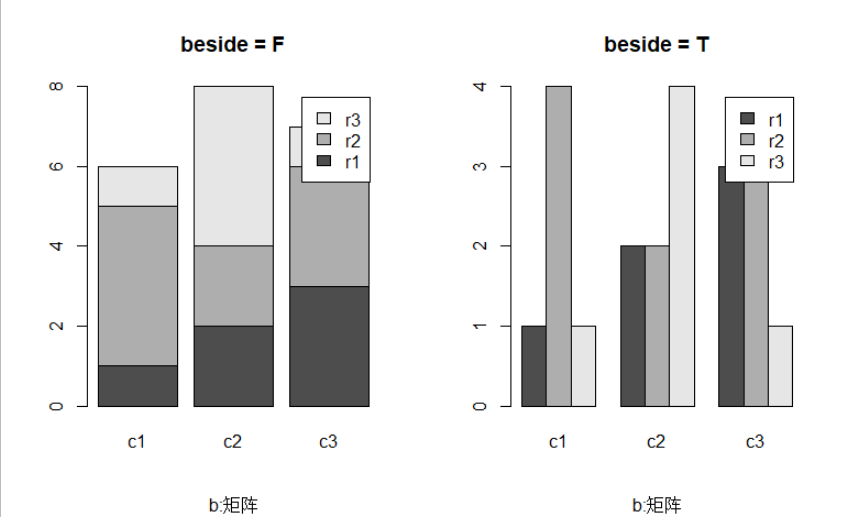
The code is as follows:
opar <- par(mfrow=c(1,2))
barplot(height = b,main = 'beside = F',sub = 'b:matrix',beside = F,legend.text = T)
barplot(height = b,main = 'beside = T',sub = 'b:matrix',beside = T,legend.text = T)
7.horiz
Is it horizontal
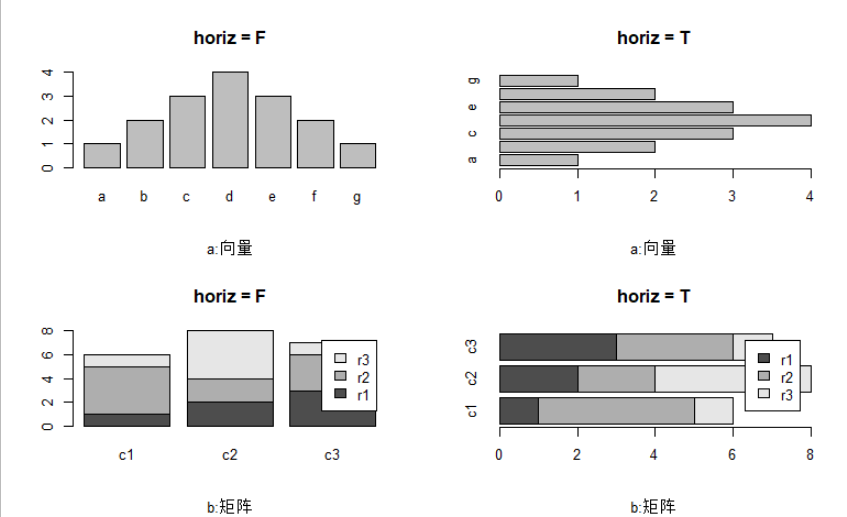
The code is as follows:
opar <- par(mfrow=c(2,2))
barplot(height = a,main = 'horiz = F',sub = 'a:vector',horiz = F)
barplot(height = a,main = 'horiz = T',sub = 'a:vector',horiz = T)
barplot(height = b,main = 'horiz = F',sub = 'b:matrix',horiz = F,legend.text = T)
barplot(height = b,main = 'horiz = T',sub = 'b:matrix',horiz = T,legend.text = T)
8.density,angle
Setting slash density and angle for bar filling
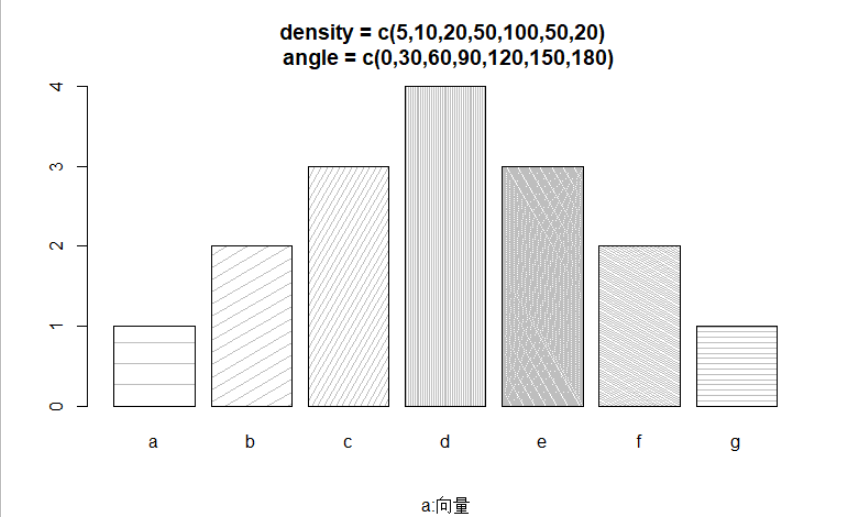
The code is as follows:
opar <- par(mfrow=c(1,1))
barplot(height = a,main = 'density = c(5,10,20,50,100,50,20) \n angle = c(0,30,60,90,120,150,180)',sub = 'a:vector',density = c(5,10,20,50,100,50,20),angle = c(0,30,60,90,120,150,180))
9.col,border
Set bar fill and border color

The code is as follows:
opar <- par(mfrow=c(1,2))
barplot(height = a,main = "col = c('red','green','blue')",sub = 'a:vector',col = c('red','green','blue'))
barplot(height = a,main = "border = c('blue','green','red')",col = 'white',sub = 'a:vector',border = c('blue','green','red'))
10.xlab,ylab
Set x, y axis title
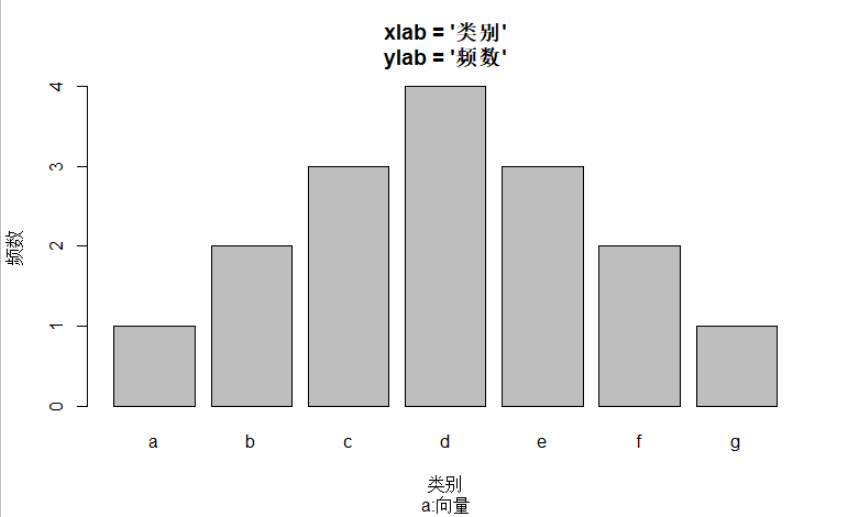
The code is as follows:
opar <- par(mfrow=c(1,1))
barplot(height = a,main = "xlab = 'category'\nylab = 'frequency'",sub = 'a:vector',xlab = 'category',ylab = 'frequency')
11.xlim,ylim,xpd
Set the horizontal and vertical axis limit, xpd: Whether the bar chart is beyond the drawing range
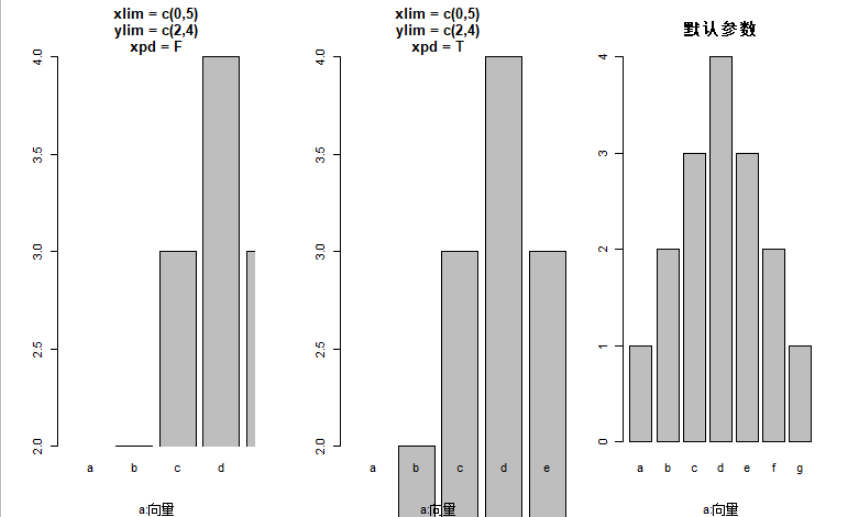
The code is as follows:
opar <- par(mfrow=c(1,3))
barplot(height = a,main = "xlim = c(0,5)\nylim = c(2,4)\nxpd = F",sub = 'a:vector',xlim = c(0,5),ylim = c(2,4),xpd = F)
barplot(height = a,main = "xlim = c(0,5)\nylim = c(2,4)\nxpd = T",sub = 'a:vector',xlim = c(0,5),ylim = c(2,4),xpd = T)
barplot(height = a,main = "Default parameters")
12.log
Whether the x- or y-axis is log-transformed
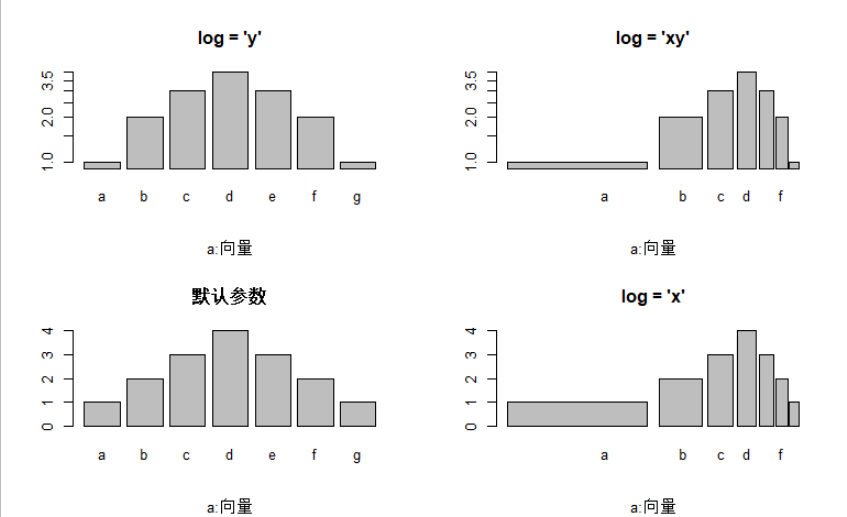
The code is as follows:
opar <- par(mfrow=c(2,2))
barplot(height = a,main = "log = 'y'",sub = 'a:vector',log = 'y')
barplot(height = a,main = "log = 'xy'",sub = 'a:vector',log = 'xy')
barplot(height = a,main = "Default parameters",sub = 'a:vector')
barplot(height = a,main = "log = 'x'",sub = 'a:vector',log = 'x')
13.axes
axes: can control the display of the vertical axis
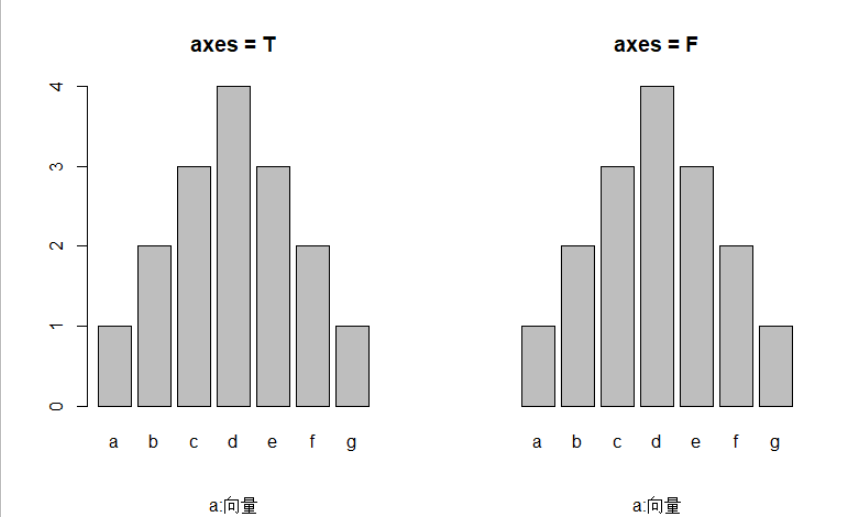
The code is as follows:
opar <- par(mfrow=c(1,2))
barplot(height = a,main = "axes = T",sub = 'a:vector',axes = T)
barplot(height = a,main = "axes = F",sub = 'a:vector',axes= F)
14.axisnames
Settings: Whether to display the name of the horizontal coordinates
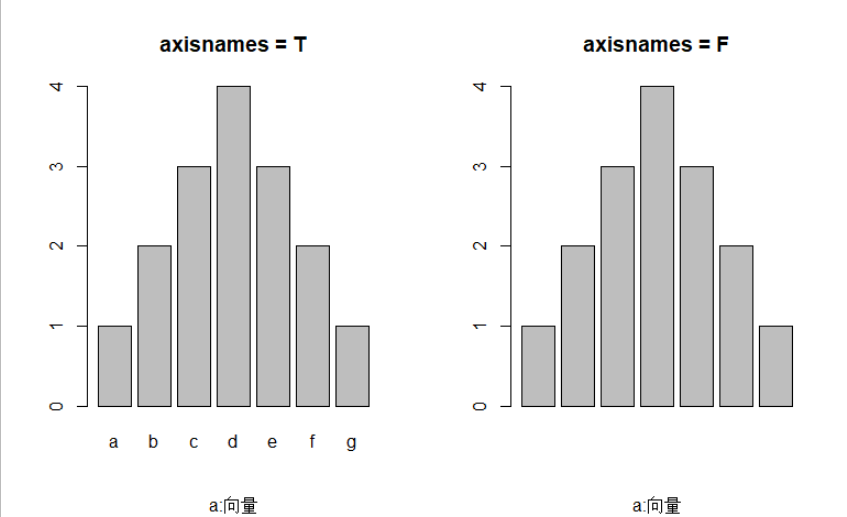
The code is as follows:
opar <- par(mfrow=c(1,2))
barplot(height = a,main = "axisnames = T",sub = 'a:vector',axisnames = T)
barplot(height = a,main = "axisnames = F",sub = 'a:vector',axisnames = F)
15.cex.axis,cex.names
cex.axis sets the vertical coordinate label size, and cex.names sets the horizontal coordinate label size.
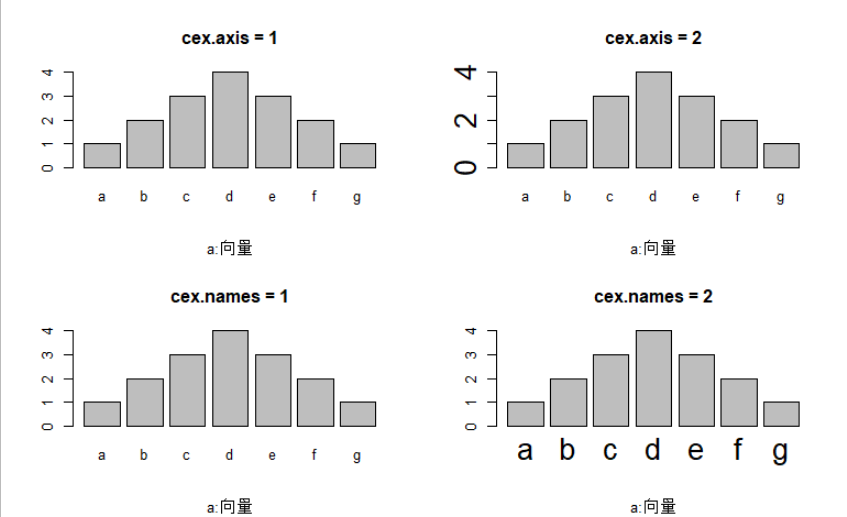
The code is as follows:
opar <- par(mfrow=c(2,2))
barplot(height = a,main = "cex.axis = 1",sub = 'a:vector',cex.axis = 1)
barplot(height = a,main = "cex.axis = 2",sub = 'a:vector',cex.axis = 2)
barplot(height = a,main = "cex.names = 1",sub = 'a:vector',cex.names = 1)
barplot(height = a,main = "cex.names = 2",sub = 'a:vector',cex.names = 2)
16.axis.lty
Line shape of horizontal coordinate axis
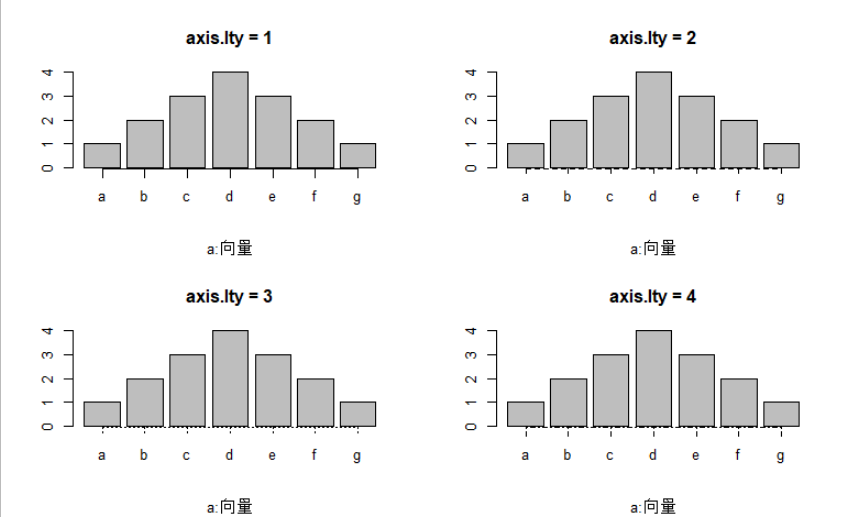
The code is as follows:
opar <- par(mfrow=c(2,2))
barplot(height = a,main = "axis.lty = 1",sub = 'a:vector',axis.lty = 1)
barplot(height = a,main = "axis.lty = 2",sub = 'a:vector',axis.lty = 2)
barplot(height = a,main = "axis.lty = 3",sub = 'a:vector',axis.lty = 3)
barplot(height = a,main = "axis.lty = 4",sub = 'a:vector',axis.lty = 4)
17.offset
Displaces a bar up or down in a specified bar graph
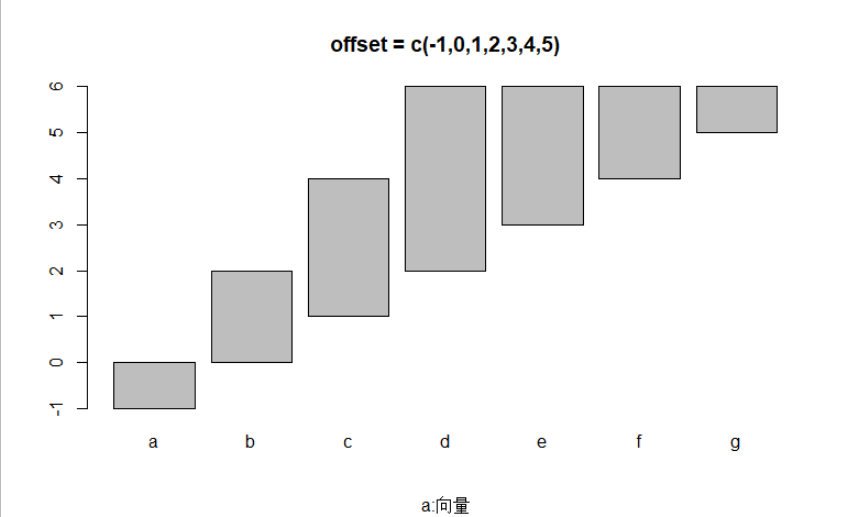
The code is as follows:
barplot(height = a,main = "offset = c(-1,0,1,2,3,4,5)",sub = 'a:vector',offset = c(-1,0,1,2,3,4,5))
18.ann
ann sets whether the bar chart displays the title, subtitle, x,y axis title
ann=F on the left, you can see that it doesn't have these four things
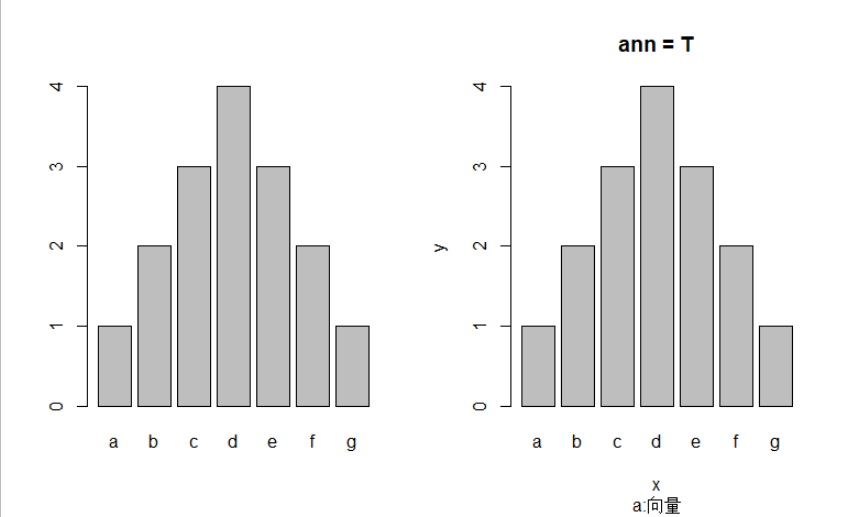
The code is as follows:
opar <- par(mfrow=c(1,2))
barplot(height = a,main = "ann = F",sub = 'a:vector',xlab = 'x',ylab = 'y',ann = F)
barplot(height = a,main = "ann = T",sub = 'a:vector',xlab = 'x',ylab = 'y',ann = T)
19.args.legend
args.legend: Value is a list that contains parameters from the legend() function to set the details of the legend of a bar chart

The code is as follows:
barplot(height = b,main = 'horiz = F',sub = 'b:matrix',horiz = F,legend.text = T,args.legend = list(x=4,y=6,title='group'),xpd = T)
20.data,subset,na.action,add
The above parameters are not detailed.
21.inside:
No use has been found for this parameter!Use as described in the help document
summary
The first in the Avenue to Jane series is finished, and the next one is a histogram, hist()Strength is limited. If there are any errors, you are welcome to criticize and correct them.