1, Binary package installation
We can go to Prometheus binary installation package Download page Download the corresponding installation package according to your own operating system. Let's take Amazon Linux 2 as a demonstration.
We will download the latest version v2.17.1 according to the current time.
1.1 download Prometheus Server
wget https://github.com/prometheus/prometheus/releases/download/v2.17.1/prometheus-2.17.1.linux-amd64.tar.gz

tar xf prometheus-2.17.1.linux-amd64.tar.gz
mv prometheus-2.17.1.linux-amd64/prometheus /usr/local/bin/
1.2 configuration startup file
Because it's a production environment, we configure the startup file for it.
vim /etc/systemd/system/prometheus.service
[Unit]
Description=Prometheus Server
After=network.target
Documentation=https://prometheus.io/docs/introduction/overview/

[Service]
Type=simple
WorkingDirectory=/home/data/prometheus/
ExecStart=/usr/local/bin/prometheus \
  --config.file=/etc/prometheus/prometheus.yml \
  --web.read-timeout=5m \
  --web.max-connections=512 \
  --storage.tsdb.retention=15d \
  --storage.tsdb.path=/home/data/prometheus \
  --query.timeout=2m

Restart=on-failure

[Install]
WantedBy=multi-user.target
1.3 configuration file
Prometheus monitors the target node (hereinafter referred to as the "sampling target") by collecting metrics on the HTTP port of the target node. Because Prometheus exposes his data in the same way, he can also collect and check his health.
Let's move the configuration file to the standard directory / etc/prometheus/
mkdir /etc/prometheus
mv prometheus-2.17.1.linux-amd64/prometheus.yml /etc/prometheus
The initial configuration file is relatively simple. As follows, a job is provided to monitor the status of prometheus server.
global:
  scrape_interval:     15s
  evaluation_interval: 15s

alerting:
  alertmanagers:
  - static_configs:
    - targets:

rule_files:

scrape_configs:
  - job_name: 'prometheus'
    static_configs:
      - targets: ['localhost:9090']
1.4 start up
systemctl daemon-reload
systemctl start prometheus
systemctl enable prometheus
1.5 view
After startup, the prometheus service will listen on port 9090. We can use IP + Port to view the simple image interface of prometheus:
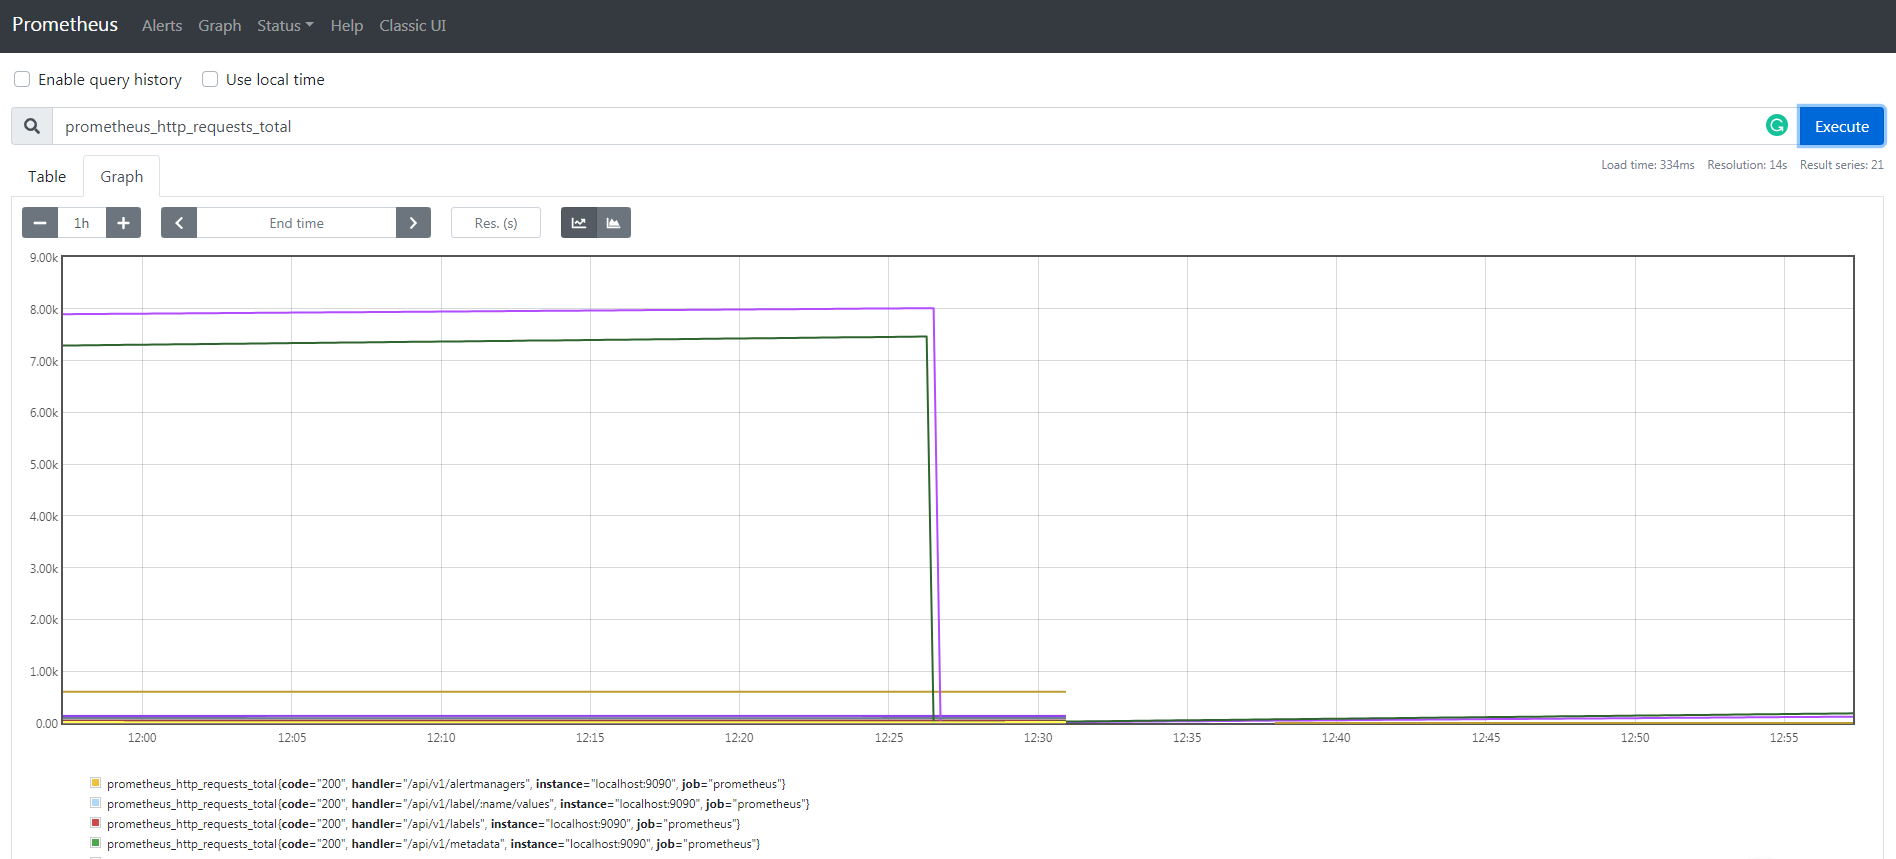
- It can be seen that Prometheus binary installation is very convenient and independent, with its own query web interface.
- In the production environment, we can add Prometheus to the init configuration or use supervisor as the service self startup.
2, Docker installation
First, make sure you have installed the latest version of Docker. If not, please click Here.
I'll use the Mac version of Docker as a demonstration.
2.1 installation
docker run \
    -p 9090:9090 \
    -v /etc/prometheus/prometheus.yml:/etc/prometheus/prometheus.yml \
    prom/prometheus
2.2 Docker management prometheus
Run docker ps to view all services:
CONTAINER ID        IMAGE                           COMMAND                  CREATED             STATUS              PORTS                      NAMES
e9ebc2435387        quay.io/prometheus/prometheus   "/bin/prometheus -..."   26 minutes ago      Up 26 minutes       0.0.0.0:9090->9090/tcp   prometheus
Run docker start prometheus to start the service
Run docker states prometheus to view prometheus status
Run docker stop prometheus to stop the service
3, Node? Export installation
node_exporter Mainly used for * NIX system monitoring, written in Golang.
3.1 binary installation
Download address: https://prometheus.io/download/
wget https://github.com/prometheus/node_exporter/releases/download/v0.18.1/node_exporter-0.18.1.linux-amd64.tar.gz

tar xf node_exporter-0.18.1.linux-amd64.tar.gz

mv node_exporter-0.18.1.linux-amd64/node_exporter /usr/local/bin/
3.2 configuration startup file
vim /etc/systemd/system/node_export.service
[Unit]
Description=Node Export
After=network.target
Documentation=https://prometheus.io/docs/guides/node-exporter/

[Service]
Type=simple
WorkingDirectory=/tmp/
ExecStart=/usr/local/bin/node_exporter

Restart=on-failure

[Install]
WantedBy=multi-user.target
systemctl daemon-reload
systemctl start node_export
systemctl enable node_export
3.3. Monitoring
We manually add prometheus monitoring, modify its configuration file, and add the following content at the end:
  - job_name: 'node_export'
    static_configs:
      - targets:
        - localhost:9100
        - web1:9100
        - web2:9100
        - web3:9100
        - web4:9100
The prometheus server needs to be able to resolve these addresses, and we can modify its / etc/hosts file.
3.4 Docker installation
docker run -d \
  --net="host" \
  --pid="host" \
  -v "/:/host:ro,rslave" \
  quay.io/prometheus/node-exporter \
  --path.rootfs=/host
4, grafana rpm installation
4.1 download
Download address: https://grafana.com/grafana/download
I recommend using rpm package for installation, so that many dependencies can be solved automatically, and the startup script is also configured.
wget https://dl.grafana.com/oss/release/grafana-6.7.2-1.x86_64.rpm
sudo yum install grafana-6.7.2-1.x86_64.rpm
4.2 startup
systemctl enable grafana-server
systemctl start grafana-server
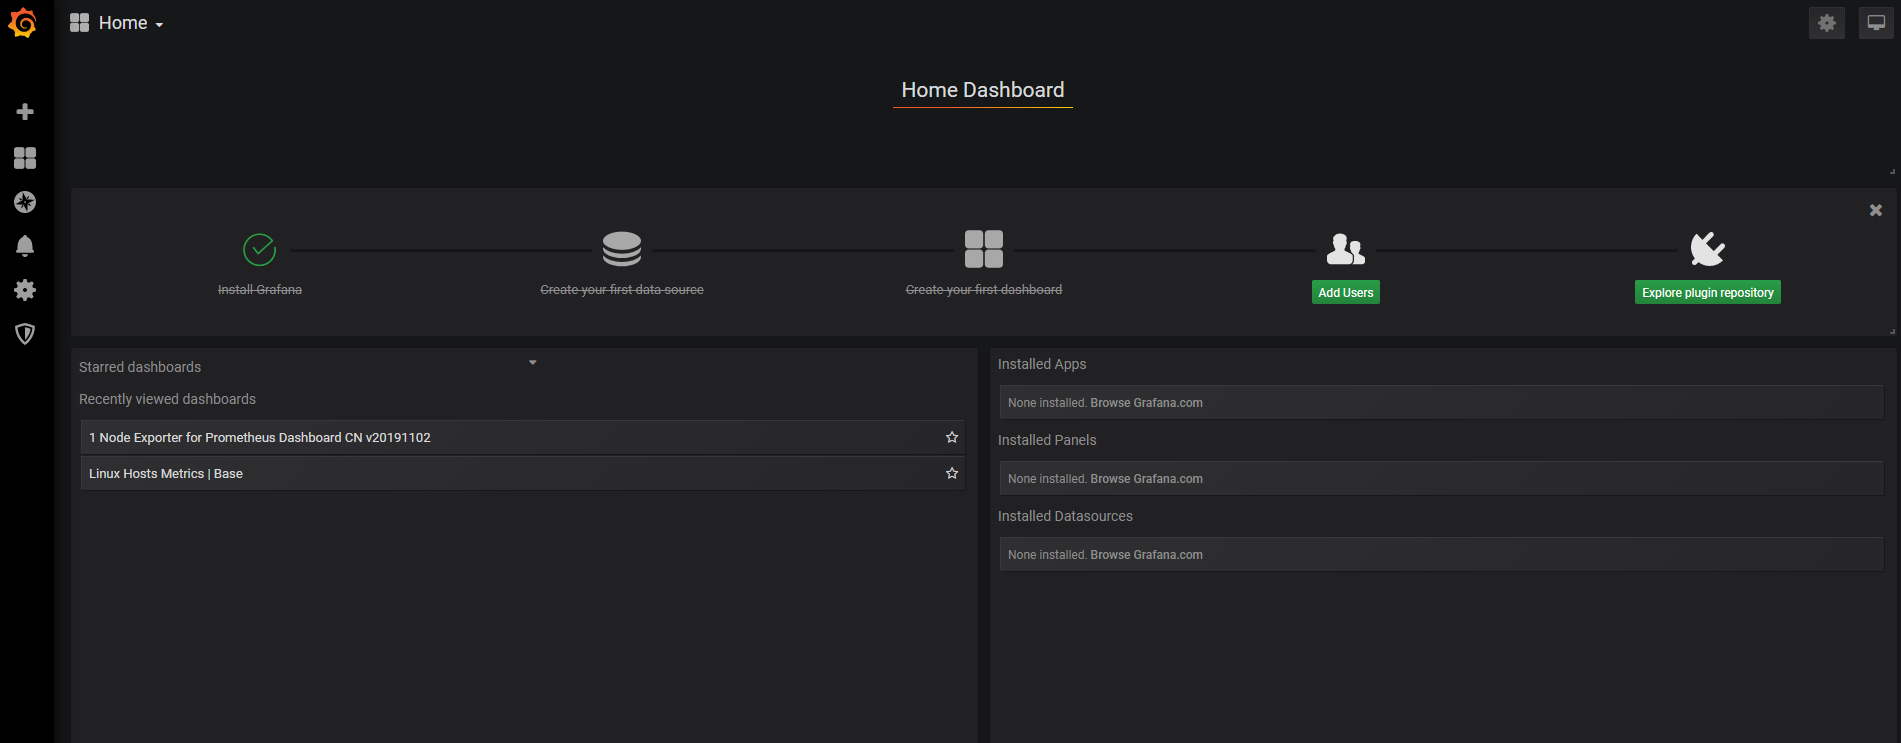
4.3 visit
Access IP + Port. The default startup port of grafana is 3000. The initial account and password are all admin. The following is the interface after login. The screenshot here is that the data source has been configured.
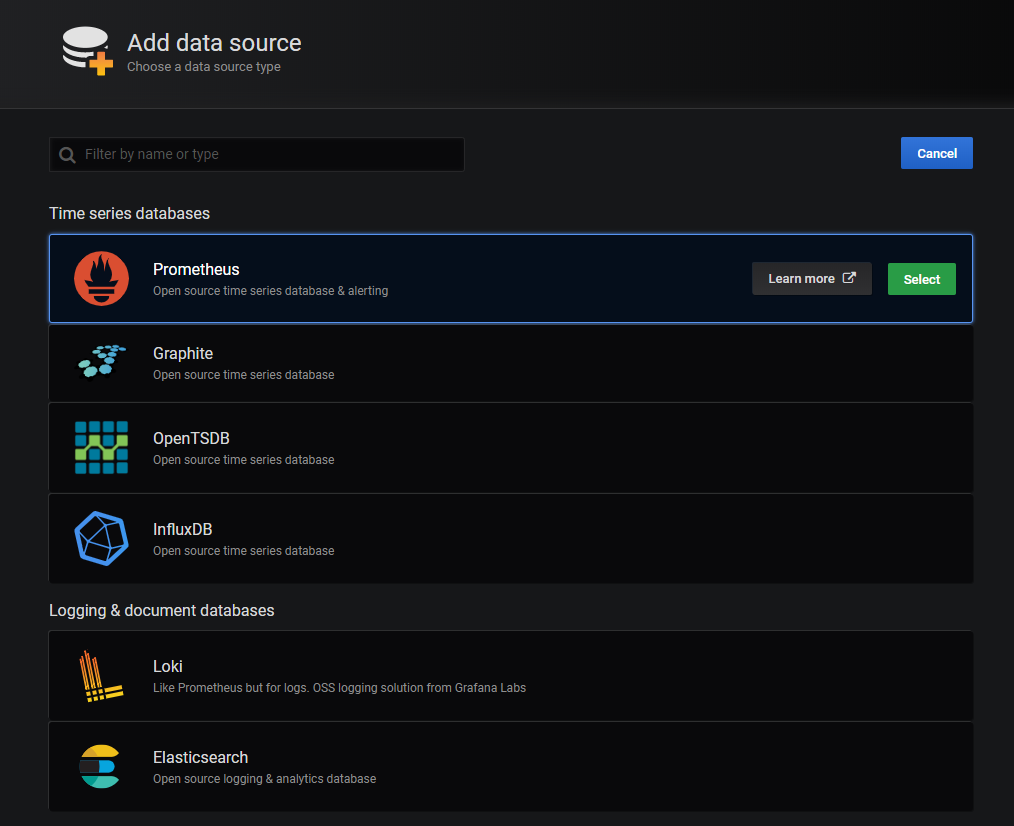
4.4 configure data source
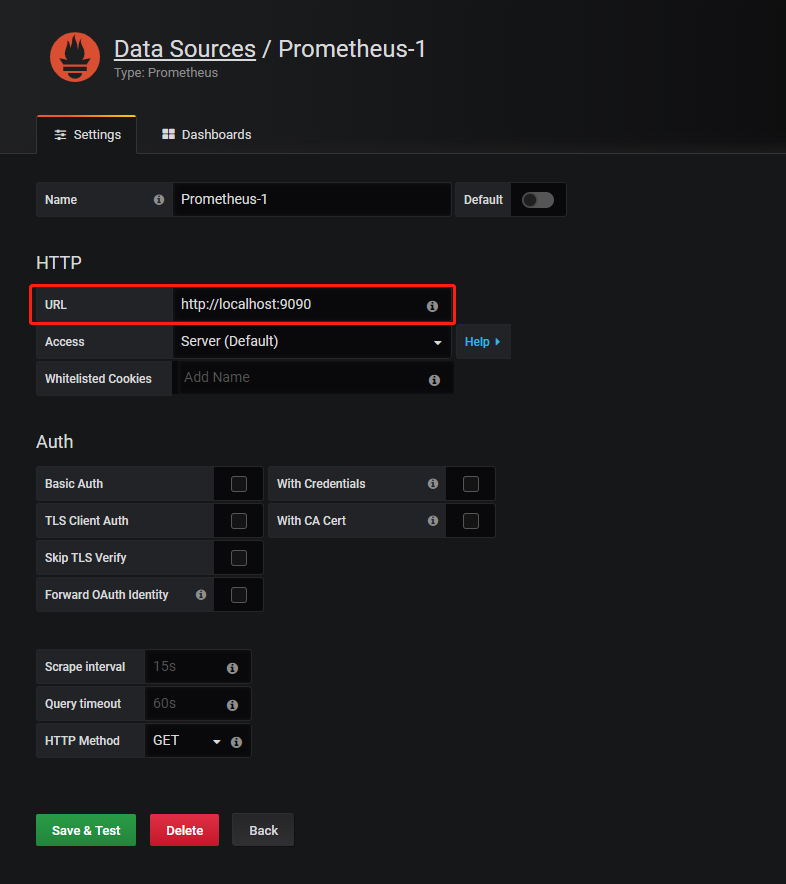
There are many data sources supported by grafana. We choose prometheus here.
Because our grafana and prometheus are on the same machine, just fill in the address of localhost:9090.
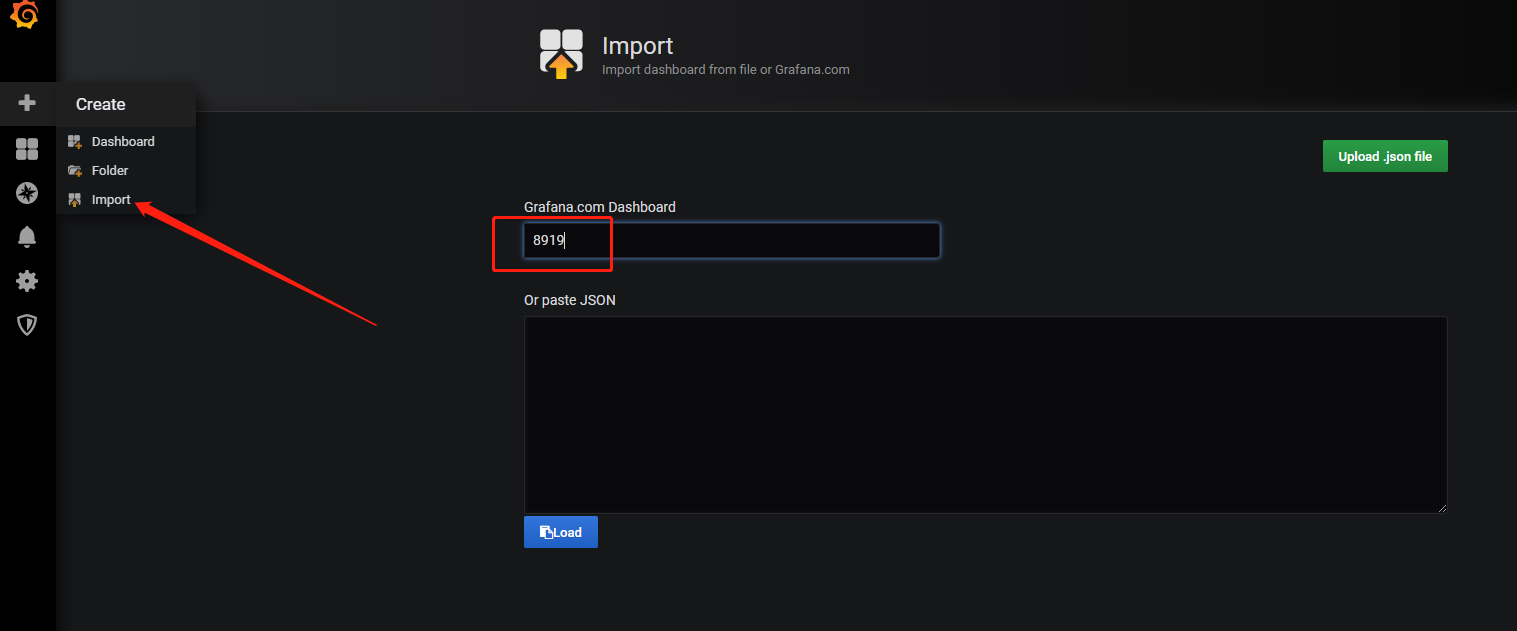
4.5 import template
In the beginning, we may not make a template. First, we import a template, just enter its number. For more official dashboards, see:
https://grafana.com/grafana/dashboards?orderBy=name&direction=asc
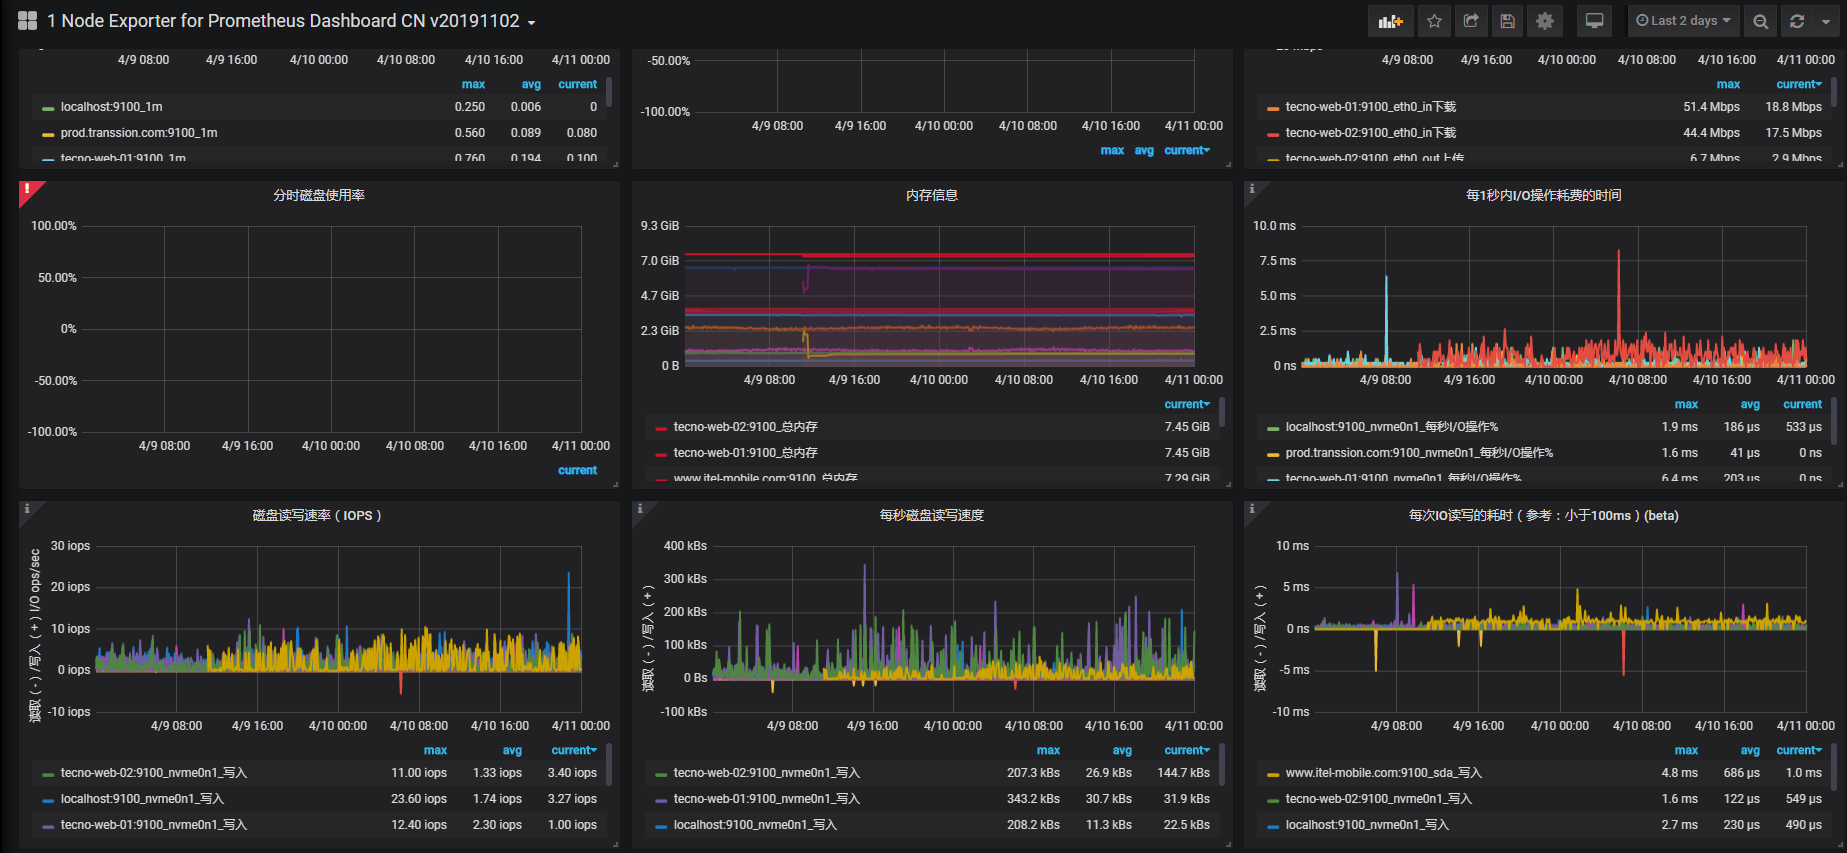
4.6 viewing effect
Welcome to scan for more information