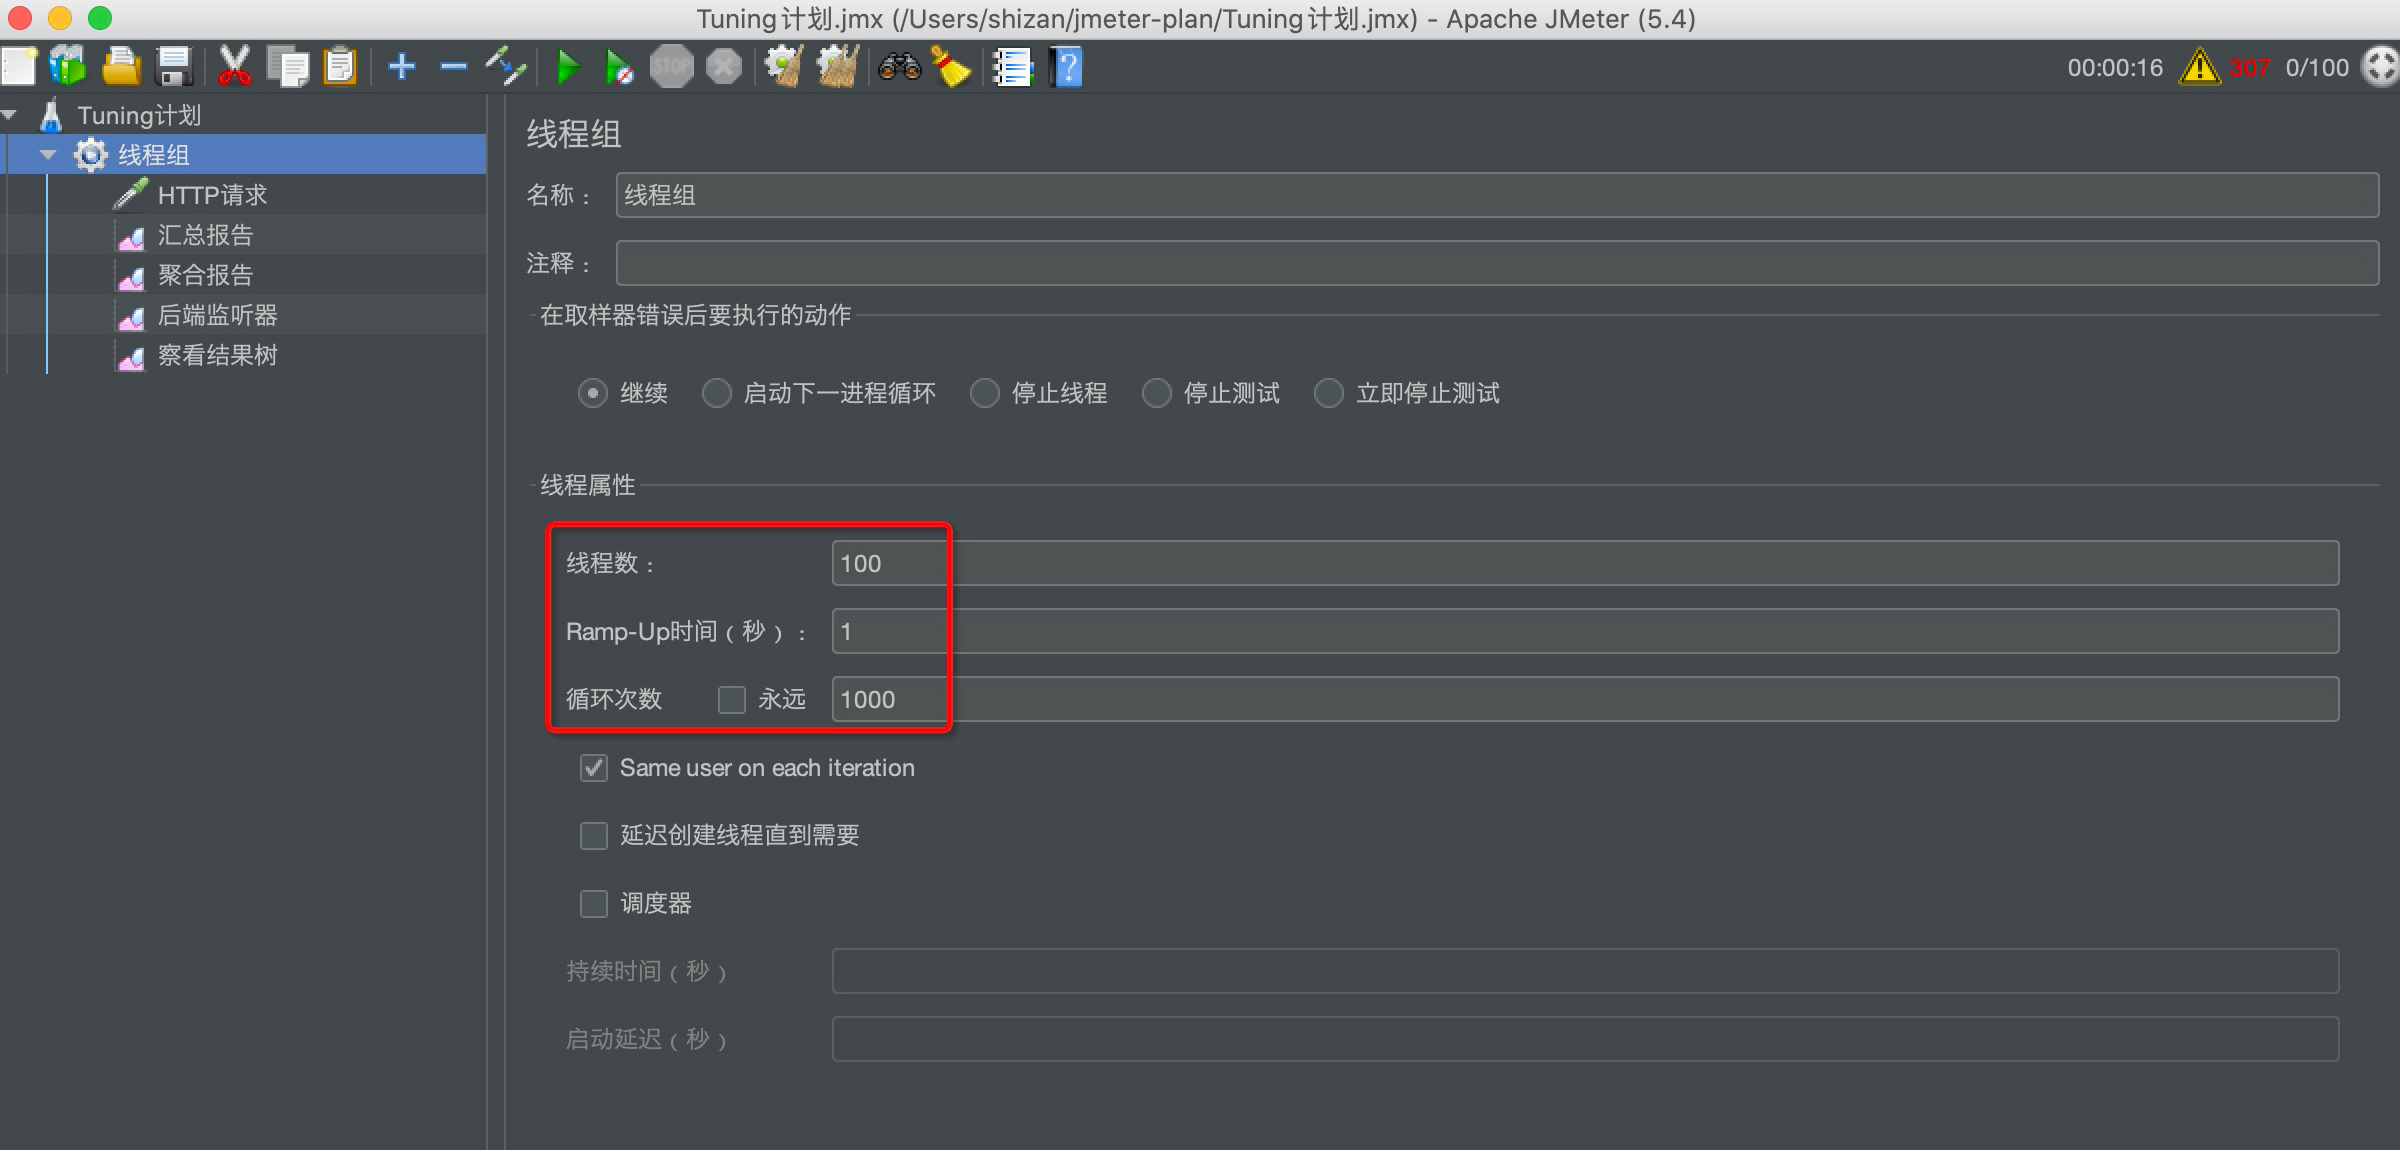
1. Performance optimization case 1: adjusting heap size to improve service throughput
1.1. Modify tomcat JVM configuration
In the production environment, Tomcat does not recommend configuring variables directly in catalina.sh, but in setenv.sh under the same level directory (bin directory) as Catalina.
1.2 initial configuration
Write in the setenv.sh file (the size can be modified according to your own situation): the content of setenv.sh is as follows
export CATALINA_OPTS="$CATALINA_OPTS -Xms30m"
export CATALINA_OPTS="$CATALINA_OPTS -XX:SurvivorRatio=8"
export CATALINA_OPTS="$CATALINA_OPTS -Xmx30m"
export CATALINA_OPTS="$CATALINA_OPTS -XX:+UseParallelGC"
export CATALINA_OPTS="$CATALINA_OPTS -XX:+PrintGCDetails"
export CATALINA_OPTS="$CATALINA_OPTS -XX:MetaspaceSize=64m"
export CATALINA_OPTS="$CATALINA_OPTS -XX:+PrintGCDateStamps"
export CATALINA_OPTS="$CATALINA_OPTS -Xloggc:/mydata/tomcat8.5/logs/gc.log"
start-up
[root@shuidi150 bin]# ./startup.sh
View log:
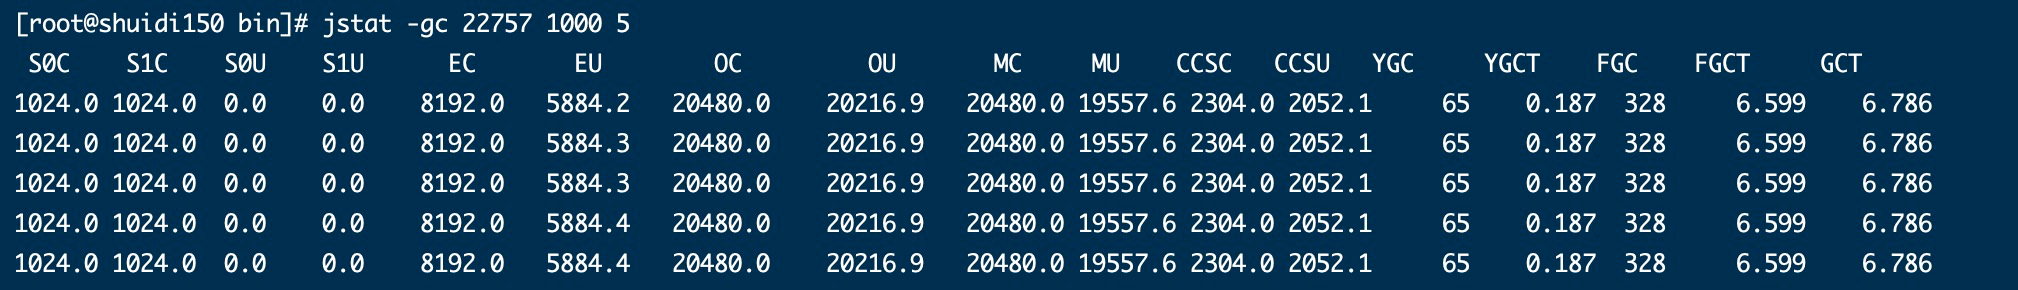
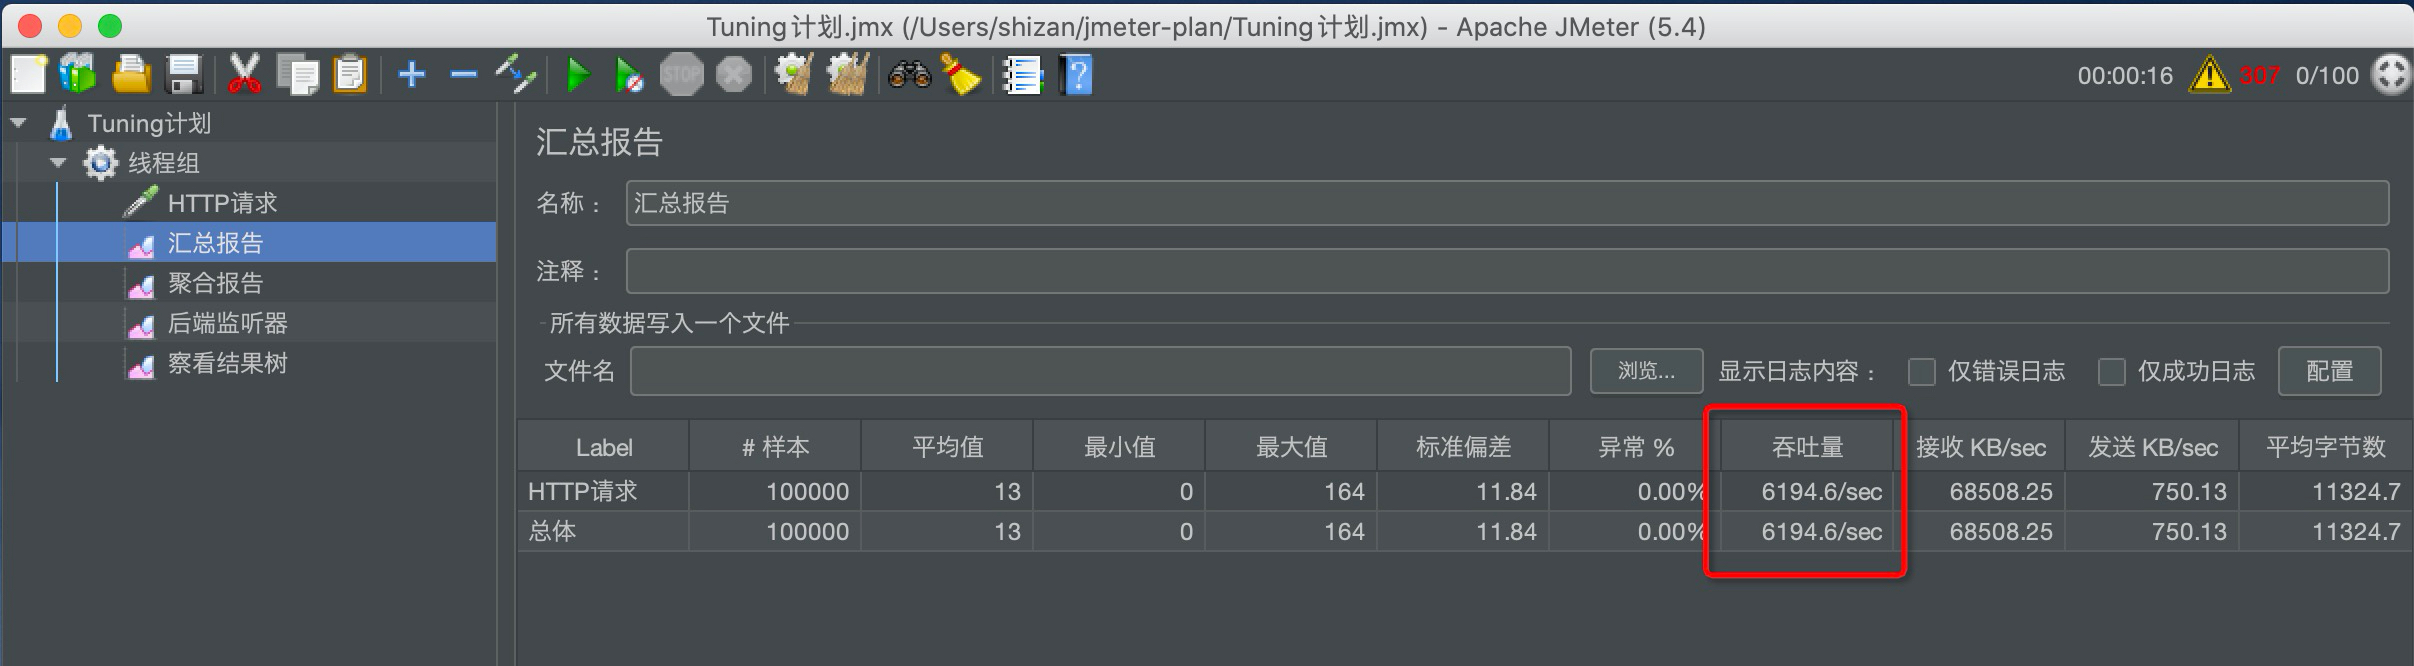
1.3 optimized configuration
export CATALINA_OPTS="$CATALINA_OPTS -Xms120m"
export CATALINA_OPTS="$CATALINA_OPTS -Xmx120m"
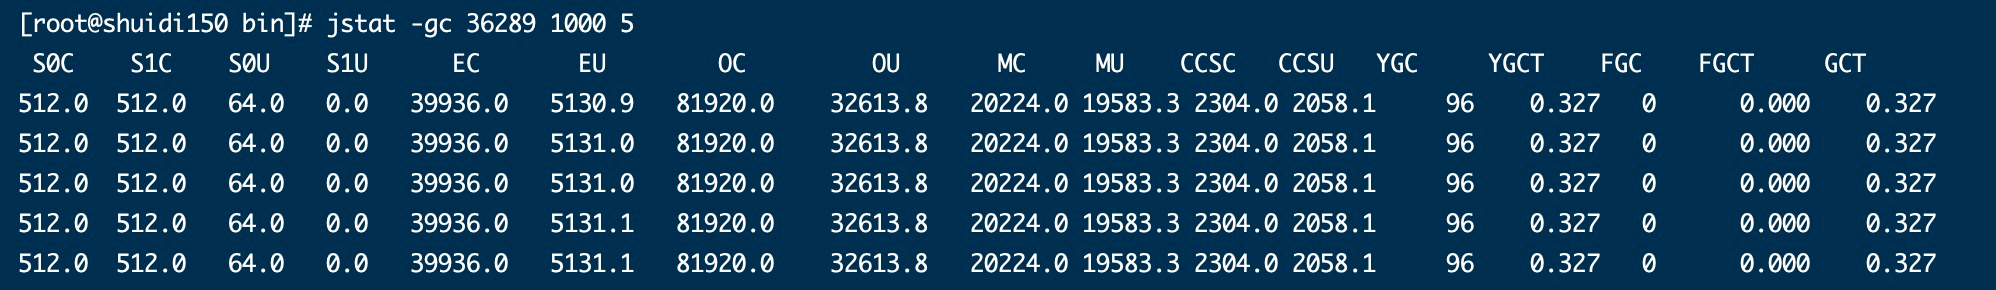
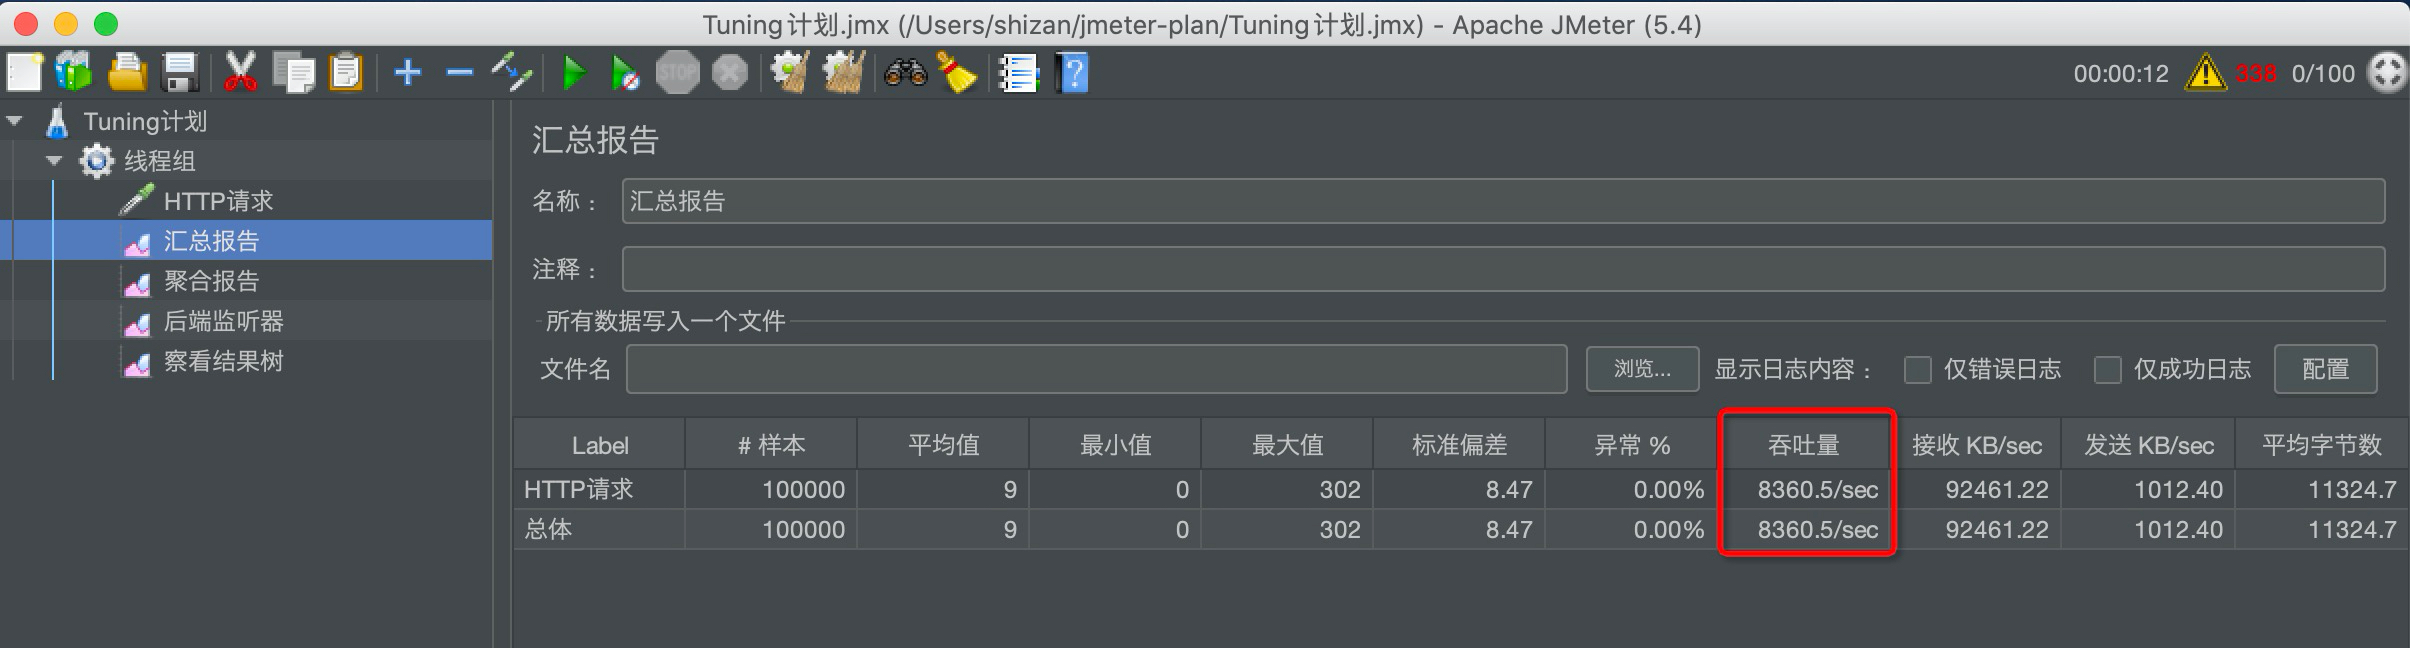
After optimization, full GC is not required, and the throughput is increased from 6194.5 to 8360.5
2. Performance optimization case 2: JIT optimization of JVM optimization
2.1. Is heap the only choice for allocation objects?
In the deep understanding of Java virtual machine, there is a paragraph about JAVA memory:
With the development of JIT compilation period and the maturity of escape analysis technology, stack allocation and scalar replacement optimization technology will lead to some subtle changes, and all objects are allocated to the heap, which will gradually become less "absolute".
In the Java virtual machine, it is a common knowledge that objects allocate memory in the Java heap. However, there is a special case, that is, if an object is found to have no escape method after escape analysis, it may be optimized for allocation on the stack. This eliminates the need to allocate memory on the heap and garbage collection. This is also the most common off heap storage technology.
In addition, the TaoBaoVM deeply customized based on OpenJDK mentioned above, in which the innovative GCIH(GC invisible heap) technology realizes off heap, moves Java objects with long life cycle from the heap to outside the heap, and GC cannot manage Java objects inside GCIH, so as to reduce the recovery frequency of GC and improve the recovery efficiency of GC.
2.2 compilation overhead
Time cost
The execution of the interpreter is as follows in the abstract:
Entered code - > interpreter interpretation execution - > execution result
If the JIT is compiled and then executed, the abstract view is:
Input code - > compiler compilation - > compiled code - > execution - > execution result
be careful:
JIT is faster than interpretation. In fact, it means that "executing compiled code" is faster than "interpreter interpretation and execution". It does not mean that the action of "compilation" is faster than that of "interpretation". No matter how fast JIT compilation is, it is at least slightly slower than interpretation and execution. To get the final execution result, we have to go through a process of "executing compiled code". Therefore, for "execute only once" code, interpretation execution is always faster than JIT compilation execution.
Space overhead
For general Java methods, it is normal for the expansion ratio of compiled code to bytecode to reach 10 +. Like the time overhead mentioned above, the space overhead here is also that only the code that is executed frequently is worth compiling. If all the code is compiled, the space occupied by the code will be significantly increased, resulting in code explosion. That explains why
Some JVM s will choose not to always do JIT compilation, but to use the hybrid execution engine of interpreter + JIT compiler.
2.3 code optimization by real-time compilation
2.3.1 escape analysis
- How to allocate objects on the heap to the stack requires escape analysis.
- Escape analysis is a cutting-edge optimization technology in Java virtual machine. This is a cross function global data flow analysis algorithm that can effectively reduce the synchronization load and memory heap allocation pressure in Java programs.
- Through escape analysis, the Java Hotspot compiler can analyze the use range of the reference of a new object and decide whether to allocate the object to the heap.
- The basic behavior of escape analysis is the dynamic scope of the analysis object:
① When an object is defined in a method and the object is only used inside the method, it is considered that there is no escape.
② When an object is defined in a method and referenced by an external method, it is considered to have escaped. For example, pass it elsewhere as a call parameter.
public void my_method(){
    V v = new V();
    // use v
    // ......
    v=null;
}
If there is no escaping object, it can be allocated to the stack. With the end of method execution, the stack space is removed.
- Escape analysis includes:
Global variable assignment escape
Method return value escape
Instance reference escaped
Thread escape: assigned to class variables or instance variables that can be accessed in other threads
Code example
/**
 * escape analysis
 *
 *  How to quickly judge whether escape analysis has occurred depends on whether the object entity of new can be called outside the method.
 *
 * @author shkstart
 * @create 2021 4:00 pm
 */
public class EscapeAnalysis {

    public EscapeAnalysis obj;

    /*
    Method returns the EscapeAnalysis object, and an escape occurs
     */
    public EscapeAnalysis getInstance(){
        return obj == null? new EscapeAnalysis() : obj;
    }
    /*
    An escape occurred while assigning a value to a member property
     */
    public void setObj(){
        this.obj = new EscapeAnalysis();
    }
    //Think: if the current obj reference is declared static, will escape occur? meeting!

    /*
    The scope of the object is only valid in the current method, and no escape has occurred
     */
    public void useEscapeAnalysis(){
        EscapeAnalysis e = new EscapeAnalysis();
    }
    /*
    Reference to the value of member variable, escape occurred
     */
    public void useEscapeAnalysis1(){
        EscapeAnalysis e = getInstance();
        //getInstance().xxx() will also escape
    }
    /*
    * There was also an escape
    * */
    public void operate(EscapeAnalysis e){
        // e
    }
}
Parameter setting
- After the JDK6u23 version, escape analysis has been enabled by default in HotSpot.
- If you are using an earlier version, developers can:
Explicitly enable escape analysis with the option - XX:+DoEscapeAnalysis
View the filter results of escape analysis through the option - XX: + printescape analysis.
Conclusion:
If local variables can be used in development, do not use definitions outside the method.
2.3.2 code optimization I: allocation on stack
Using escape analysis, the compiler can optimize the code as follows:
Allocation on stack. Convert heap allocation to stack allocation. If it is found after escape analysis that an object does not escape from the method, it may be optimized to be allocated on the stack. This eliminates the need to allocate memory on the heap and garbage collection. It can reduce garbage collection time and times.
According to the results of escape analysis during compilation, the JIT compiler finds that if an object does not escape from the method, it may be optimized to be allocated on the stack. After the allocation is completed, it continues to execute in the call stack. Finally, the thread ends, the stack space is recycled, and the local variable object is also recycled. This eliminates the need for garbage collection.
Code example
/**
* On stack allocation test
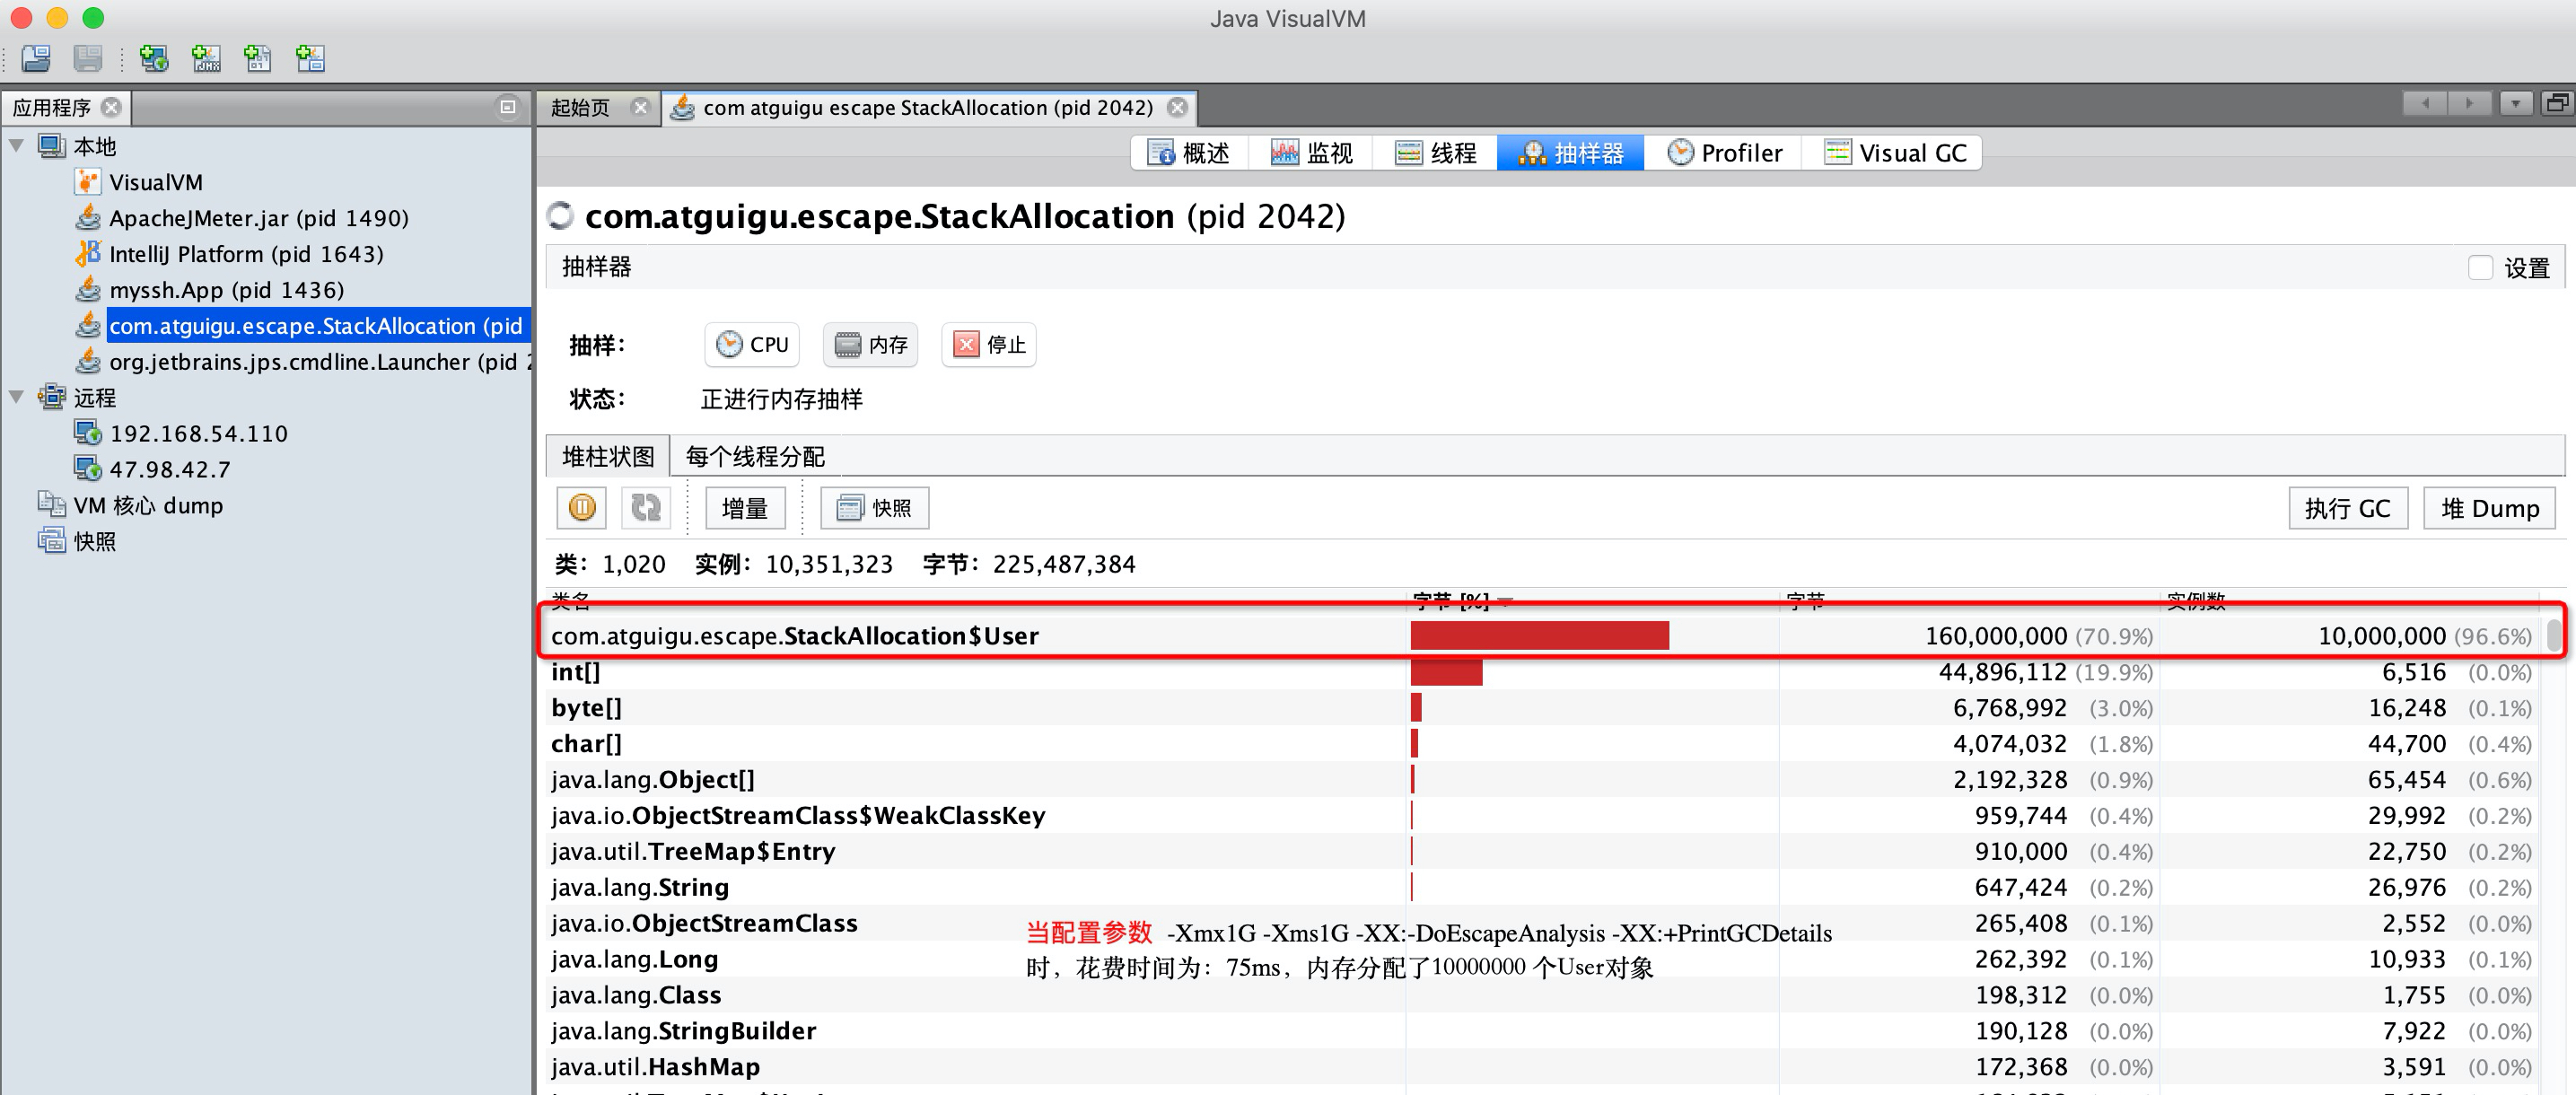
* -Xmx1G -Xms1G -XX:-DoEscapeAnalysis -XX:+PrintGCDetails
*
* As long as escape analysis is enabled, it will judge whether the variables in the method have escaped. If no escape occurs, on stack allocation is used
*
* @author shkstart shkstart@126.com
* @create 2021 10:31
*/
public class StackAllocation {
public static void main(String[] args) {
long start = System.currentTimeMillis();
for (int i = 0; i < 10000000; i++) {
alloc();
}
// View execution time
long end = System.currentTimeMillis();
System.out.println("The time spent is: " + (end - start) + " ms");
// To facilitate viewing the number of objects in heap memory, thread sleep
try {
Thread.sleep(1000000);
} catch (InterruptedException e1) {
e1.printStackTrace();
}
}
private static void alloc() {
User user = new User();//Did escape occur? No,
}
static class User {
}
}Turn off escape analysis
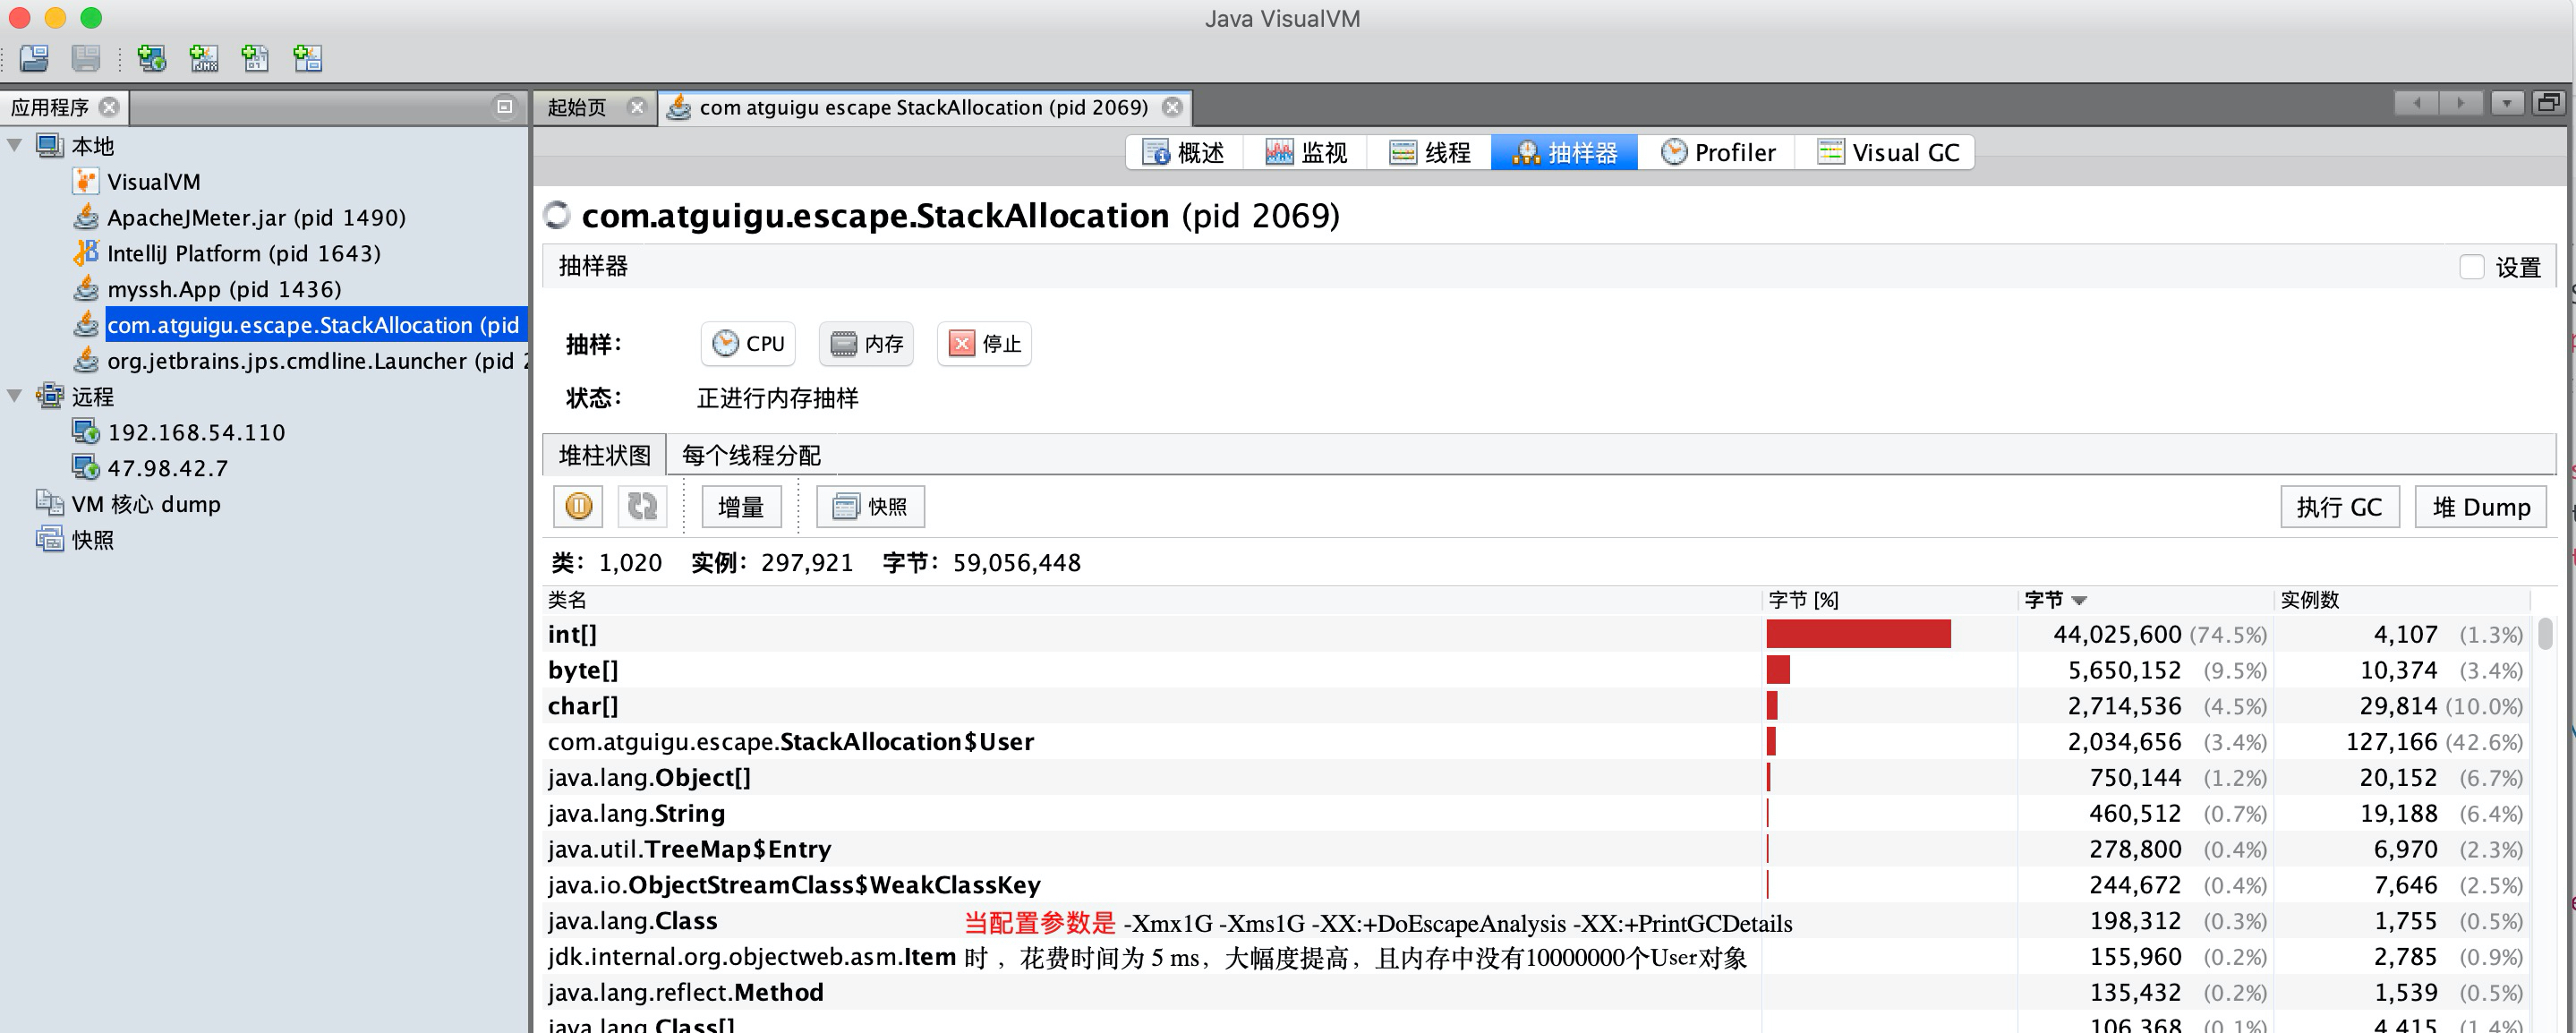
Open escape analysis
2.3.3 code optimization II: synchronous omission (elimination)
Synchronous ellipsis. If an object is found to be accessible only from one thread, synchronization may not be considered for the operation of this object.
- The cost of thread synchronization is quite high, and the consequence of synchronization is to reduce concurrency and performance.
- When dynamically compiling a synchronization block, the JIT compiler can use escape analysis to determine whether the lock object used by the synchronization block can only be accessed by one thread and not published to other threads. If not, the IT compiler will cancel the synchronization of this part of the code when compiling the synchronization block. This can greatly improve concurrency and performance. The process of canceling synchronization is called synchronization omission, also known as lock elimination.
Code example
/**
 * Synchronous omitting description
 * @author shkstart  shkstart@126.com
 * @create 2021  11:07
 */
public class SynchronizedTest {
    public void f() {
        /*
        * The hollis object is locked in the code, but the life cycle of the hollis object is only in the f() method,
        * It will not be accessed by other threads, so it will be optimized during JIT compilation.
        *
        * Question: will hollis be removed from bytecode files?
        * */
        Object hollis = new Object();
        synchronized(hollis) {
            System.out.println(hollis);
        }

        /*
        * After optimization;
        * Object hollis = new Object();
        * System.out.println(hollis);
        * */
    }
}
2.3.4 code optimization III: scalar substitution
Scalar refers to data that cannot be decomposed into smaller data. The original data type in Java is scalar
In contrast, the data that can be decomposed is called aggregate. The object in Java is aggregate because it can be decomposed into other aggregate quantities and scalars.
In the JIT stage, if it is found that an object will not be accessed by the outside world through escape analysis, the object will be disassembled into several member variables after JIT optimization. This process is scalar substitution.
Code example
/**
 * Scalar substitution test
 *  -Xmx100m -Xms100m -XX:+DoEscapeAnalysis -XX:+PrintGCDetails -XX:-EliminateAllocations
 *
 *  Conclusion: in fact, the optimization of escape analysis in Java lies in the scalar replacement of the objects allocated on the stack.
 *
 * @author shkstart  shkstart@126.com
 * @create 2021  12:01
 */
public class ScalarReplace {
    public static class User {
        public int id;
        public String name;
    }

    public static void alloc() {
        User u = new User();//No escape occurred
        u.id = 5;
        u.name = "www.atguigu.com";
    }

    public static void main(String[] args) {
        long start = System.currentTimeMillis();
        for (int i = 0; i < 10000000; i++) {
            alloc();
        }
        long end = System.currentTimeMillis();
        System.out.println("The time spent is: " + (end - start) + " ms");

    }
}

/*
class Customer{
    String name;
    int id;
    Account acct;

}

class Account{
    double balance;
}


 */
Parameter setting
-XX:+EliminateAllocations Scalar substitution is enabled (on by default), allowing objects to be scattered and allocated on the stack.
When the configuration parameter - XX:+DoEscapeAnalysis -XX:+PrintGCDetails -XX:-EliminateAllocations takes 54 ms
When the configuration parameter - XX:+DoEscapeAnalysis -XX:+PrintGCDetails -XX:+EliminateAllocations takes 4 ms
Conclusion: in fact, the optimization of escape analysis in Java lies in the scalar replacement of the objects allocated on the stack. By default, both scalar substitution and escape analysis are enabled. Only when they are enabled at the same time can they have effect. It is invalid to enable escape analysis alone.
2.3.5 summary of escape analysis
Summary of escape analysis: escape analysis is not mature
- The paper on escape analysis was published in 1999, but it was not implemented until JDK1.6, and this technology is not very mature.
- The fundamental reason is that the performance consumption of non escape analysis can not be guaranteed to be higher than its consumption. Although after escape analysis, scalar replacement, on stack allocation, and lock elimination can be done. However, escape analysis itself also needs a series of complex analysis, which is actually a relatively time-consuming process.
- An extreme example is that after escape analysis, it is found that no object does not escape. Then the process of escape analysis is wasted.
- Although this technology is not very mature, it is also a very important means in real-time compiler optimization technology.
- Note that there are some views that the JVM will allocate those objects that will not escape on the stack through escape analysis, which is theoretically feasible, but it depends on the choice of the JVM designer.
- At present, many books are still based on the previous version of JDK7. Great changes have taken place in JDK. The cache and static variables of intern string have been allocated to the permanent generation, and the permanent generation has been replaced by the metadata area. However, the intern string cache and static variables are not transferred to the metadata area, but allocated directly on the heap, so this is also consistent with the previous conclusion: object instances are allocated on the heap.
3. Performance optimization case 3: rational allocation of heap memory
3.1 recommended configuration
In case 1, we mentioned that increasing memory can improve the performance of the system, and the effect is remarkable. Then, the problem is, how much memory is more appropriate? If the memory is too large, the GC time will be relatively long when generating full GC. If the memory is small, GC will be triggered frequently. In this case, how can we reasonably adapt the heap memory size?
analysis:
The principle is to set according to the recommended formula in Java Performance.
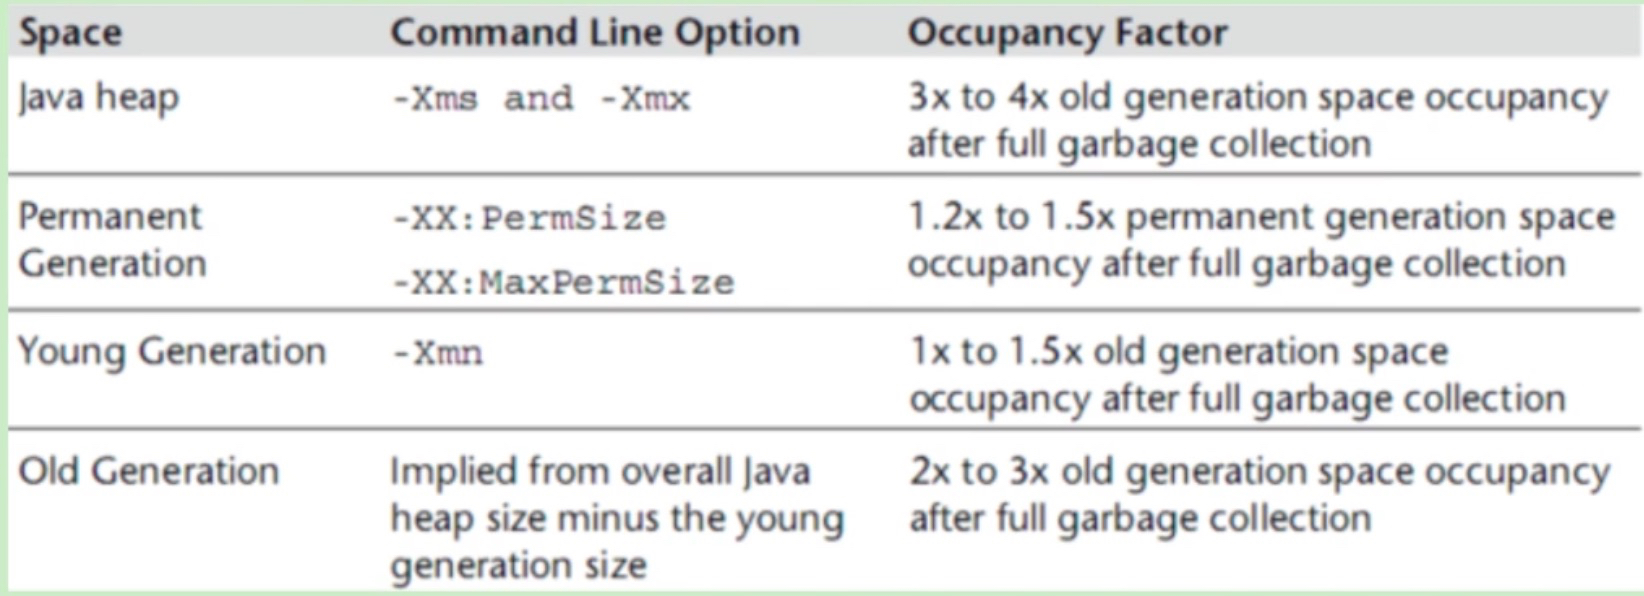
For the entire heap size of Java, Xmx and Xms are set to 3-4 times of the surviving objects of the older generation, that is, 3-4 times of the memory occupied by the older generation after Fullgc.
The method area (PermSize and MaxPermSize of the permanent generation or Metaspace and maxmetaspace) is set to 1.2-1.5 times that of the surviving objects of the elderly generation.
The setting of Xmn in the younger generation is 1-1.5 times that of the surviving objects in the older generation.
The memory size of the old generation is set to 2-3 times that of the surviving objects of the old generation.
However, the above statement is not absolute, that is, it gives a reference value. According to a conclusion drawn after various tuning, you can set our initialization memory according to this value. Under the condition of ensuring the normal operation of the program, we also need to check the GC recovery rate, GC pause time and the actual data in the memory, Full GC is basically unavailable. If it is available, do memory Dump analysis, and then make a reasonable memory allocation.
We also noticed that how to judge the surviving objects in the old age mentioned above.
3.2. How to calculate the surviving objects of the elderly generation
3.2.1. Method 1: view log
Recommended / relatively safe!
Add a GC log to the JVM parameter. The GC log will record the memory size of each generation after each FullGC, and observe the space size of the older generation after GC. Observe the memory after FullGC for a period of time (for example, 2 days), and estimate the size of surviving objects in the old age after FullGC according to the space size data of the old age after multiple fullgcs (the average value can be taken according to the memory size after multiple fullgcs).
3.2.2. Mode 2: forcibly trigger FullGC
Will affect online services, use with caution!
- Mode 1 is feasible, but you need to change JVM parameters and analyze logs. At the same time, when using CMS collector, FullGC may not be triggered, so the log of FullGC is not recorded in the log. It is difficult to deal with when analyzing. Therefore, sometimes it is necessary to trigger FullGC forcibly to observe the size of surviving objects in the old age after FullGC.
- Note: forced triggering of FullGC will cause online service pause (STW). Be careful! The recommended operation method is to remove the service node before forcing FullGC, and then hook the service back to the available node to provide external services. Trigger FullGC in different time periods, and estimate the size of old age surviving objects after FullGC according to the old age memory after multiple FullGC
- How to force trigger Full GC?
1. Jmap - dump: live, format = B, file = heap. Bin < PID > dump the current live object to a file, and FullGC will be triggered
2. Jmap - histo: Live < PID > print the instance number, memory usage and full class name information of each class. After adding the live sub parameter, only the number of live objects will be counted. FullGC will be triggered at this time
3. In the performance test environment, it can be triggered by the Java monitoring tool FullGC, such as using VisualVM and JConsole,VisualVM integrating JConsole,VisualVM or JConsole, or there is a button to trigger GC on it
3.3 case demonstration
JVM configuration parameters
Now we start the springboot project through idea, and we initialize the memory to 1024M. Let's start with 1024M memory to analyze our GC log and make a reasonable memory setting according to our above knowledge.
-XX:+PrintGCDetails  -XX:MetaspaceSize=64m -Xss512K -XX:+HeapDumpOnOutMemoryError
-XX:HeapDumpPath=heap/heapdump3.hprof -XX:SurvivorRatio=8 -XX:+PrintGCDateStamps
-Xmx1024M -Xmx1024M -Xloggc:log/gc-oom3.log
Code demonstration
/**
 * Performance optimization case 3: rational allocation of heap memory
 */
@RequestMapping("/getData")
public List<People> getProduct(){
    List<People> peopleList = peopleSevice.getPeopleList();
    return peopleList;
}
After FullGC, use jmap - heap < PID > to check the survival size of the elderly generation
3.4 data analysis
According to the theory, after reducing - Xmx1024M -Xmx1024M, the number of younggcs increased, but there was still no FullGC, and the pressure measurement throughput did not change significantly
3.5 conclusion
When the memory is relatively tight, you can tune the memory according to the above methods to find a memory setting that is acceptable in GC frequency and GC time, and use a small memory to meet the current service needs.
However, when the memory is relatively abundant, you can add a little more memory to the service, which can reduce the frequency of GC and increase the time consumption of GC accordingly. Generally, for those requiring low delay, more memory can be set. For those requiring low delay, smaller memory can be set in the above way.
If OutOfMemoryError is observed in the garbage collection log, try to expand the size of the Java heap to 80% ~ 90% of the physical memory. Particular attention should be paid to the OutOfMemoryError caused by heap space and the need to increase space
- For example, add the values of - Xms and - Xmx to solve the OutOfMemoryError of the old generation
- Add - XX: PermSize and - XX: MaxPermSize to solve outofmemoryerror caused by permanent generation (before JDK7); Add - XX:MetaspaceSize and - XX:MaxMetaspaceSize to solve outofmemoryerror caused by metaspace (after jdk8)
Keep in mind that the capacity that the Java heap can use is limited by the hardware and whether to use a 64 bit JVM. After expanding the size of the Java heap, check the garbage collection log until there is no OutOfMemoryError. If the application is running in a stable state without OutOfMemoryError, you can go to the next step to calculate the size of the active object.
3.6. Can you estimate the GC frequency?
Normally, we should estimate the memory according to our system. We can test it in the test environment. At first, we can set the memory larger, such as 4G. Of course, this can also be estimated according to the business system.
For example, if a piece of data from the database takes 128 bytes and 1000 pieces of data need to be obtained, the size of the memory read at one time is (128B/1024Kb/1024M)*1000=0.122M, then our program may need to read concurrently. For example, if we read 100 times per second, the memory occupation is 0.122*100=12.2M. If the heap memory is set to 1 G, the size of the younger generation is about 333M, Then 333M*80%/12.2M=21.84s, that is to say, our program is performed almost twice or three times per minute
youngGC. This allows us to have a rough estimate of the system.
4. Special problems: the ratio of the new generation to the old generation
4.1 parameter setting
JVM parameter settings
Print log details print log print date initialization memory 300M maximum memory 300M log path
-XX:+PrintGCDetails -XX:+PrintGCDateStamps -Xms300M -Xmx300M -Xloggc:log/gc.log
The ratio of the Young generation to the Old generation is 1:2, so the memory allocation should be 100M for the new generation and 200M for the Old generation
We can first check the heap memory allocation with the command:
#View process ID jps -l # view heap memory allocation of corresponding process ID jmap -heap 3725
The result shows that our survivorratio is 8, but the memory allocation is not 8:1:1. Why?
4.2 parameter AdaptiveSizePolicy
This is because JDK1.8 uses the UseParallelGC garbage collector by default. The garbage collector starts the adaptive sizepolicy by default, and automatically calculates the sizes of Eden, From and to areas according to the situation of GC; Therefore, this is due to the adaptive size policy of JDK1.8. In addition, we observe the GC log below and find that there are many fullgc (Ergonomics) similar to this.
We can enable and disable the configuration in the jvm parameters:
#open
-XX:+UseAdaptiveSizePolicy
#close
-XX:-UseAdaptiveSizePolicy
matters needing attention:
1. In JDK 1.8, if CMS is used, no matter how useadaptive sizepolicy is set, useadaptive sizepolicy will be set to false; However, there are differences between different versions of JDK;
2. Useadaptive sizepolicy should not be used with SurvivorRatio parameter display settings. If it is used together, the parameters will become invalid;
3. Because useadaptive sizepolicy will dynamically adjust the size of Eden and Survivor, in some cases, the Survivor may be automatically adjusted to be very small, such as more than ten MB or even a few MB. At this time, after YGC recycles Eden, the surviving objects cannot be loaded into the Survivor, which will be directly promoted to the old age, resulting in a gradual increase in the occupied space of the old age, thus triggering FULL GC, If a FULL GC takes a long time (for example, hundreds of milliseconds), it is not desirable in systems requiring high response.
4. When ParallelGC is used, the ratio of Eden to Survivor is 6:1:1 by default regardless of whether the useadaptive sizepolicy parameter is enabled or not
Attachment: for external large flow and low delay systems, it is not recommended to enable this parameter. It is recommended to close this parameter.
If you do not want to dynamically adjust the memory size, the following is the solution:
1. Keep using UseParallelGC and explicitly set - XX: survivorratio = 8 - XX: - useadaptive sizepolicy
2. Use CMS garbage collector. CMS turns off useadaptive sizepolicy by default. Configuration parameter - XX:+UseConcMarkSweepGC
5. Performance optimization case 4: Troubleshooting scheme with high CPU consumption
5.1 cases
/**
 * <pre>
 *    @author  : shkstart
 *    desc    : jstack Deadlock Case
 *    version : v1.0
 * </pre>
 */
public class JstackDeadLockDemo {
    /**
     * There must be two objects that can be locked to generate deadlock. Only one object will not generate deadlock
     */
    private final Object obj1 = new Object();
    private final Object obj2 = new Object();

    public static void main(String[] args) {
        new JstackDeadLockDemo().testDeadlock();
    }

    private void testDeadlock() {
        Thread t1 = new Thread(() -> calLock_Obj1_First());
        Thread t2 = new Thread(() -> calLock_Obj2_First());
        t1.start();
        t2.start();
    }

    /**
     * Synchronized obj1, then synchronized obj2
     */
    private void calLock_Obj1_First() {
        synchronized (obj1) {
            sleep();
            System.out.println("Already got obj1 Object lock, and then wait obj2 Object lock");
            synchronized (obj2) {
                sleep();
            }
        }
    }

    /**
     * Synchronized obj2 first, then synchronized obj1
     */
    private void calLock_Obj2_First() {
        synchronized (obj2) {
            sleep();
            System.out.println("Already got obj2 Object lock, and then wait obj1 Object lock");
            synchronized (obj1) {
                sleep();
            }
        }
    }

    /**
     * In order to allow two threads to lock one of the objects respectively,
     * A thread locks obj1 and waits for obj2,
     * Another thread locks obj2 and waits for obj1,
     * Then wait all the time and a deadlock occurs
     */
    private void sleep() {
        try {
            Thread.sleep(100);
        } catch (InterruptedException e) {
            e.printStackTrace();
        }
    }
}
5.2 problem presentation
Large cpu consumption
5.3 problem analysis
1. ps aux |grep java checks the cpu, memory and disk usage of the current java process, and obtains the processes with abnormal usage
[root@shuidi150 ~]# ps aux |grep java
root       1140  0.2  1.8 3497792 70348 ?       Sl   11 February 22:08 /usr/local/jdk1.8.0_191/bin/java -Dzookeeper.log.dir=. -Dzookeeper.root.logger=INFO,CONSOLE -cp /usr/local/zookeeper-3.4.11/bin/../build/classes:/usr/local/zookeeper-3.4.11/bin/../build/lib/*.jar:/usr/local/zookeeper-3.4.11/bin/../lib/slf4j-log4j12-1.6.1.jar:/usr/local/zookeeper-3.4.11/bin/../lib/slf4j-api-1.6.1.jar:/usr/local/zookeeper-3.4.11/bin/../lib/netty-3.10.5.Final.jar:/usr/local/zookeeper-3.4.11/bin/../lib/log4j-1.2.16.jar:/usr/local/zookeeper-3.4.11/bin/../lib/jline-0.9.94.jar:/usr/local/zookeeper-3.4.11/bin/../lib/audience-annotations-0.5.0.jar:/usr/local/zookeeper-3.4.11/bin/../zookeeper-3.4.11.jar:/usr/local/zookeeper-3.4.11/bin/../src/java/lib/*.jar:/usr/local/zookeeper-3.4.11/bin/../conf: -Dcom.sun.management.jmxremote -Dcom.sun.management.jmxremote.local.only=false org.apache.zookeeper.server.quorum.QuorumPeerMain /usr/local/zookeeper-3.4.11/bin/../conf/zoo.cfg
root      36289  0.2  4.8 2670284 186980 pts/0  Sl   11 February 22:52 /usr/local/jdk1.8.0_191/jre/bin/java -Djava.util.logging.config.file=/mydata/apache-tomcat-8.5.73/conf/logging.properties -Djava.util.logging.manager=org.apache.juli.ClassLoaderLogManager -Djdk.tls.ephemeralDHKeySize=2048 -Djava.protocol.handler.pkgs=org.apache.catalina.webresources -Dorg.apache.catalina.security.SecurityListener.UMASK=0027 -Xms120m -XX:SurvivorRatio=8 -Xmx120m -XX:+UseParallelGC -XX:+PrintGCDetails -XX:MetaspaceSize=64m -XX:+PrintGCDateStamps -Xloggc:/mydata/tomcat8.5/logs/gc.log -Dignore.endorsed.dirs= -classpath /mydata/apache-tomcat-8.5.73/bin/bootstrap.jar:/mydata/apache-tomcat-8.5.73/bin/tomcat-juli.jar -Dcatalina.base=/mydata/apache-tomcat-8.5.73 -Dcatalina.home=/mydata/apache-tomcat-8.5.73 -Djava.io.tmpdir=/mydata/apache-tomcat-8.5.73/temp org.apache.catalina.startup.Bootstrap start
root      45239  0.4  0.7 3331040 28184 pts/0   Sl+  11:26   0:00 java JstackDeadLockDemo
root      46972  0.0  0.0 112828   980 pts/2    S+   11:26   0:00 grep --color=auto java
The current process id found is 45239
2. top -Hp process id checks the pid of the currently used exception thread
top -Hp 45239
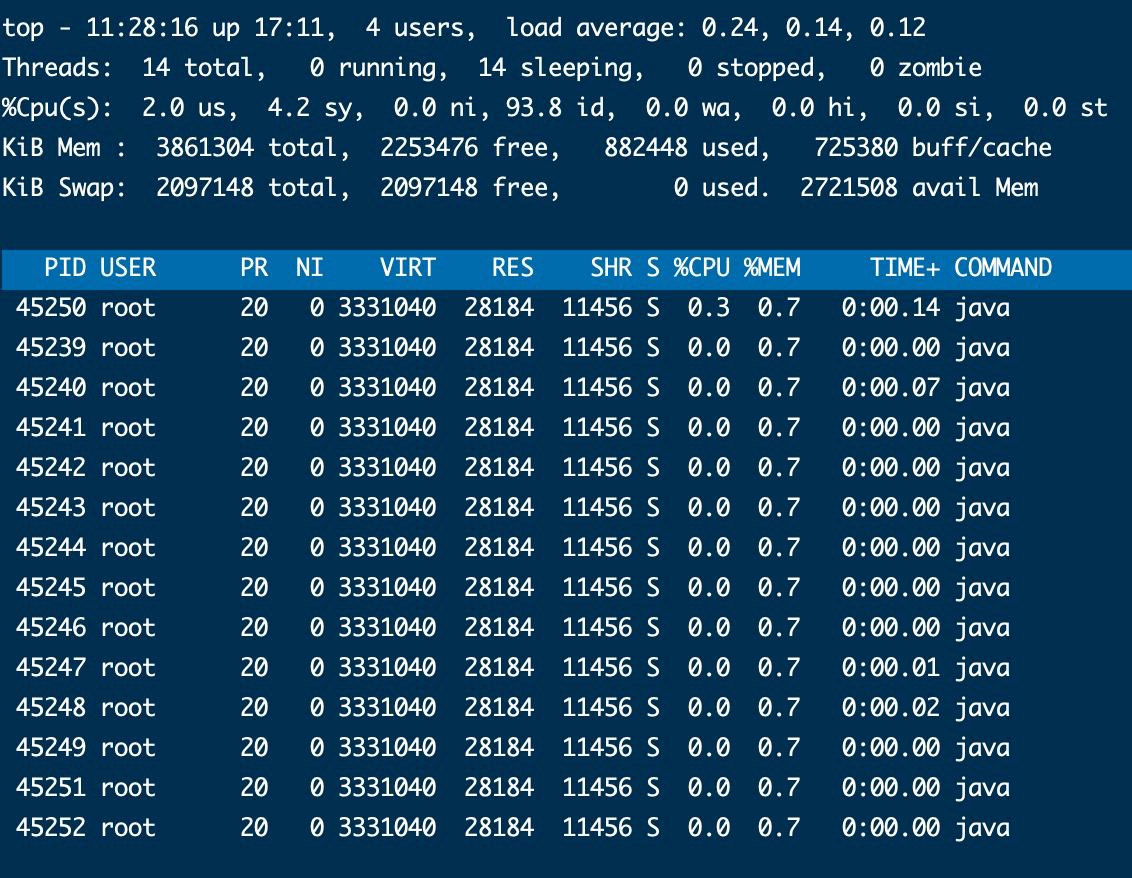
You can see that thread id 45250 occupies a high cpu
3. Change the thread pid to hexadecimal, such as 45250 - > b0c2, and then get 0xb0c2
4. The pid |grep -A20 0xb0c2 of jstack process gets the code of the relevant process (- a means after 20 lines)
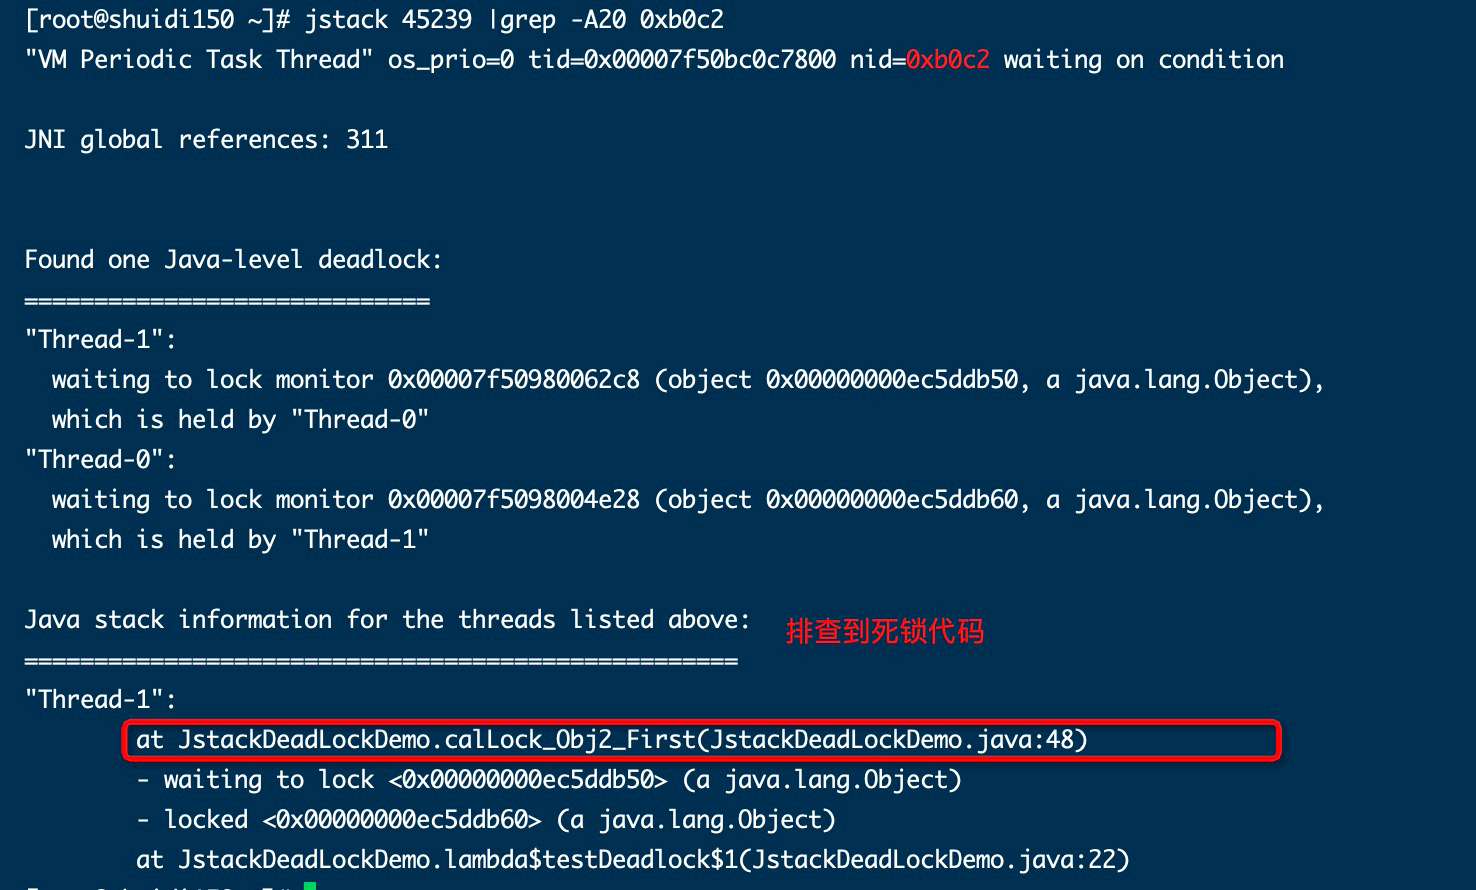
The production environment can use Li Ding's open source show busy Java threads script
5.4 solutions
(1) Adjust the order of locks to be consistent
(2) Or use a timing lock. After a period of time, if you can't get the lock, release all the locks you hold.
6. Performance optimization case 5: impact of the number of threads executed concurrently in G1 on Performance
6.1 configuration information
Hardware configuration: 4-core linux
JVM parameter settings
export CATALINA_OPTS="$CATALINA_OPTS -XX:+UseG1GC"
export CATALINA_OPTS="$CATALINA_OPTS -Xms30m"
export CATALINA_OPTS="$CATALINA_OPTS -Xmx30m"
export CATALINA_OPTS="$CATALINA_OPTS -XX:+PrintGCDetails"
export CATALINA_OPTS="$CATALINA_OPTS -XX:MetaspaceSize=64m"
export CATALINA_OPTS="$CATALINA_OPTS -XX:+PrintGCDateStamps"
export CATALINA_OPTS="$CATALINA_OPTS -Xloggc:/mydata/tomcat8.5/logs/gc.log"
export CATALINA_OPTS="$CATALINA_OPTS -XX:ConcGCThreads=1"
Note: the last parameter can be added after using G1GC to test the initial concurrent GCThreads
Adjust the initialization memory and maximum memory to be smaller. The purpose is to generate FullGC. Pay attention to the GC time
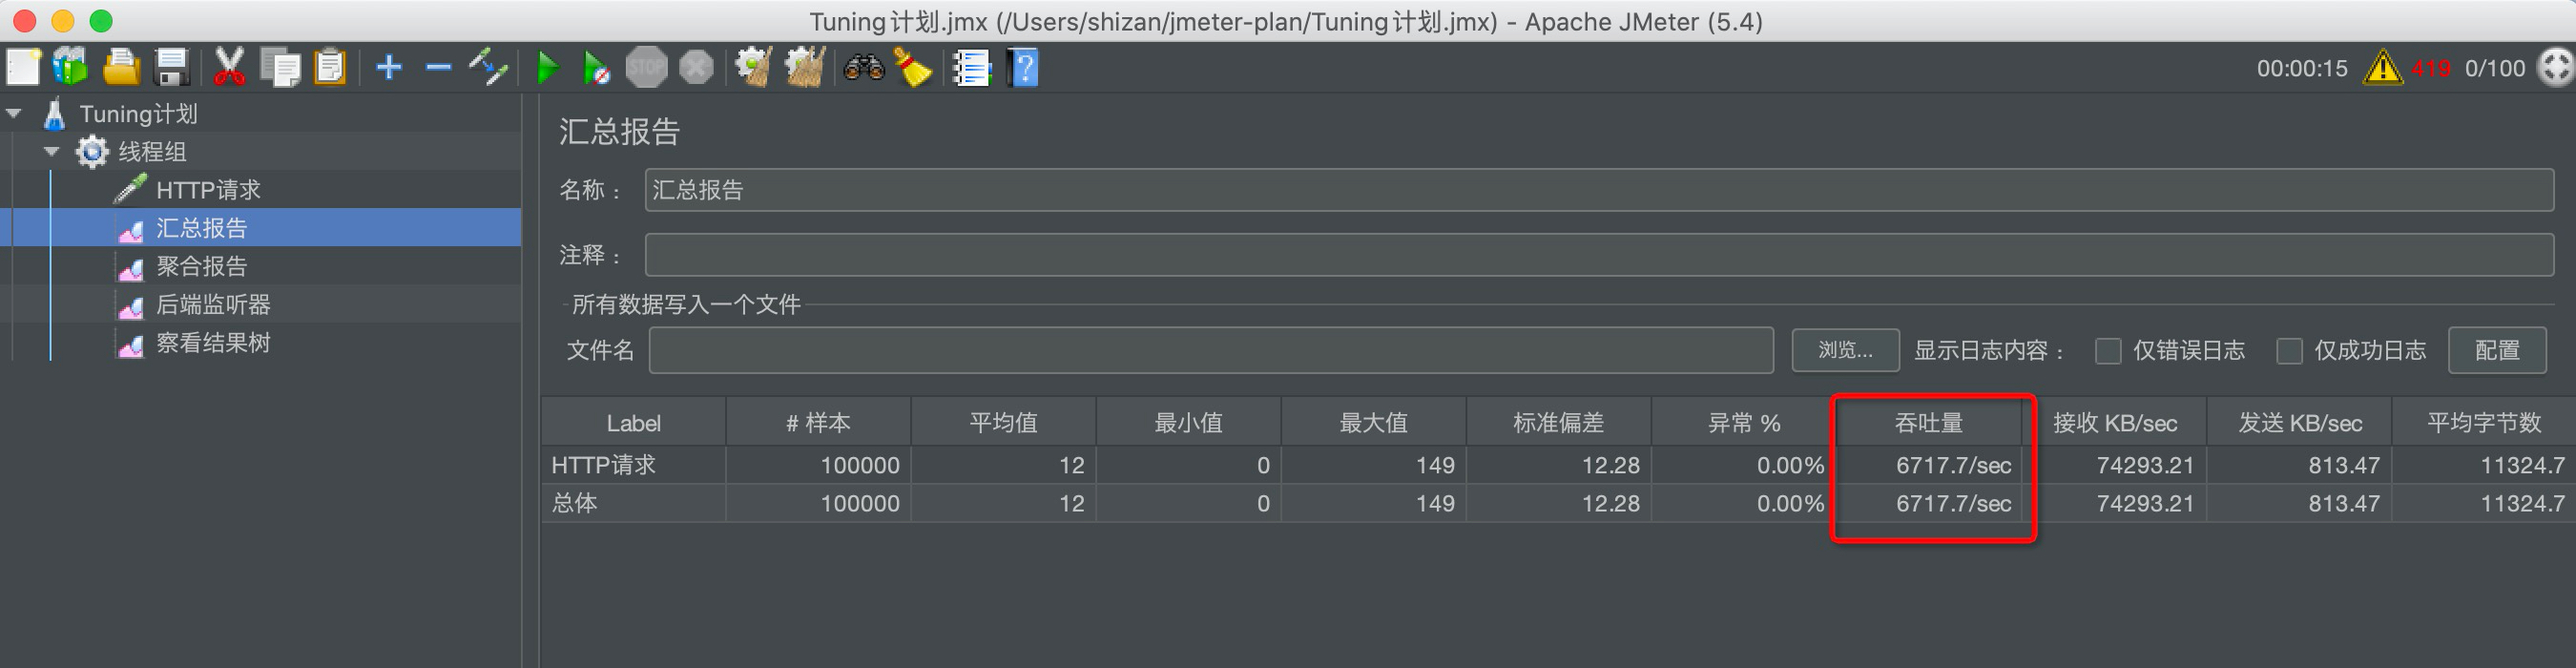
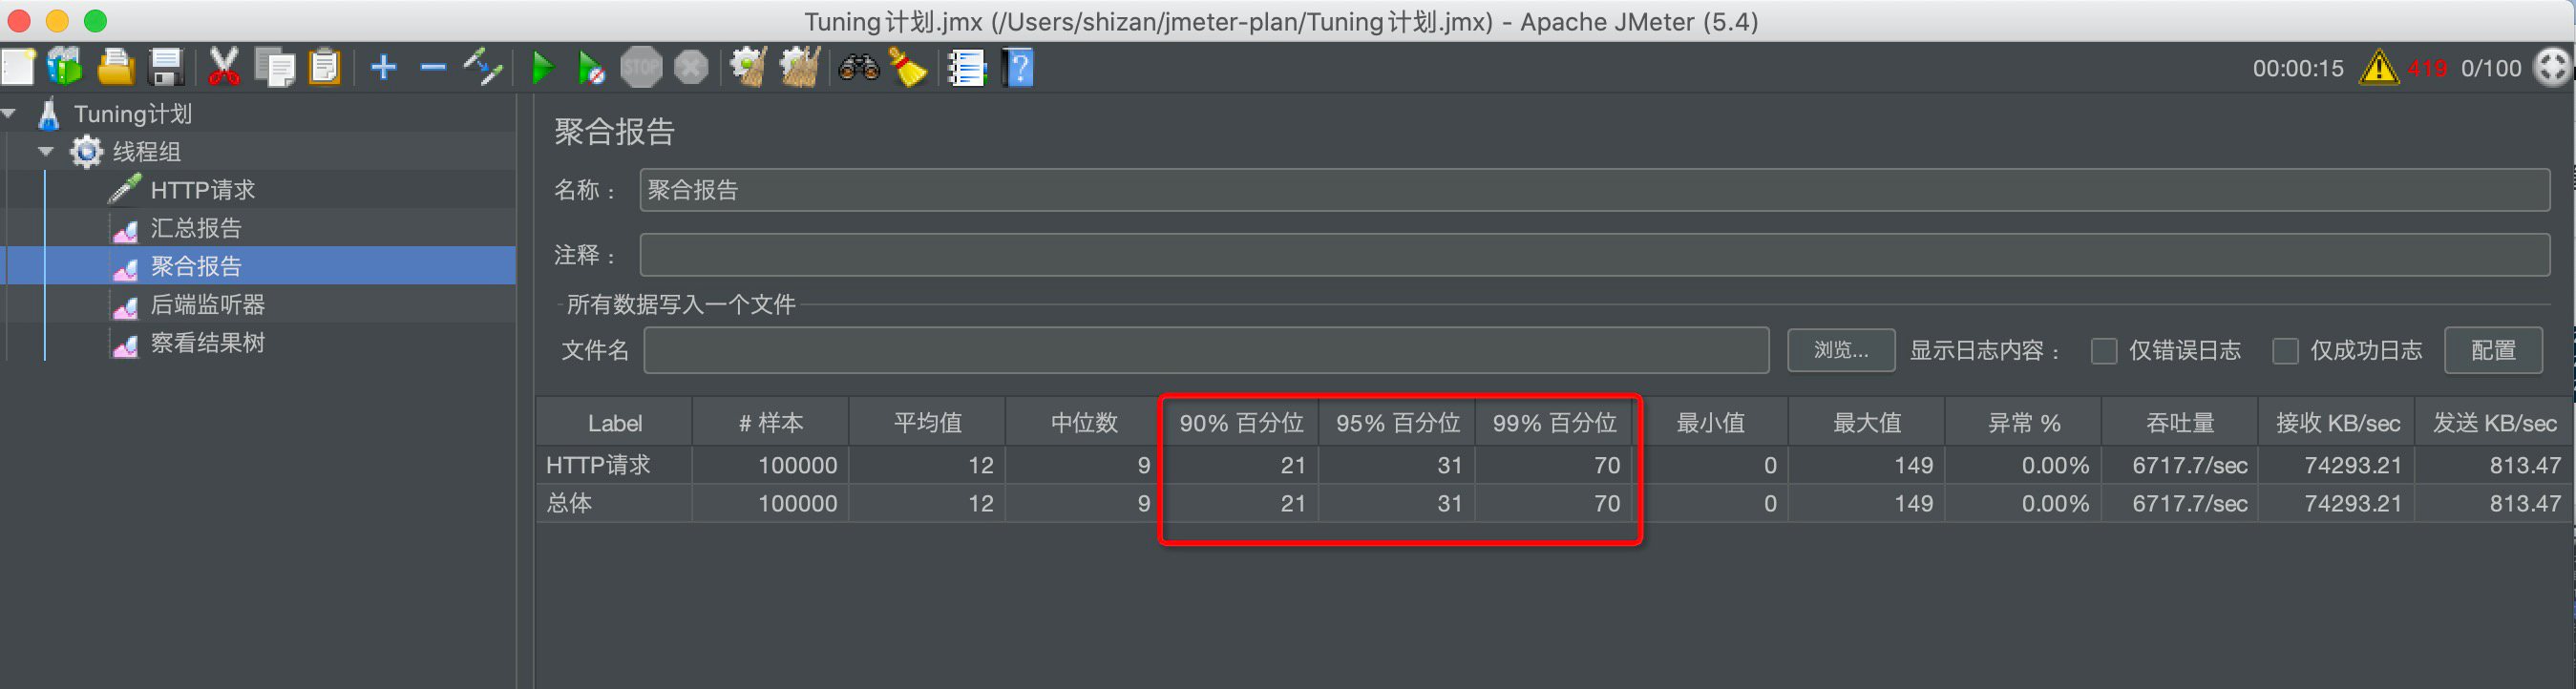
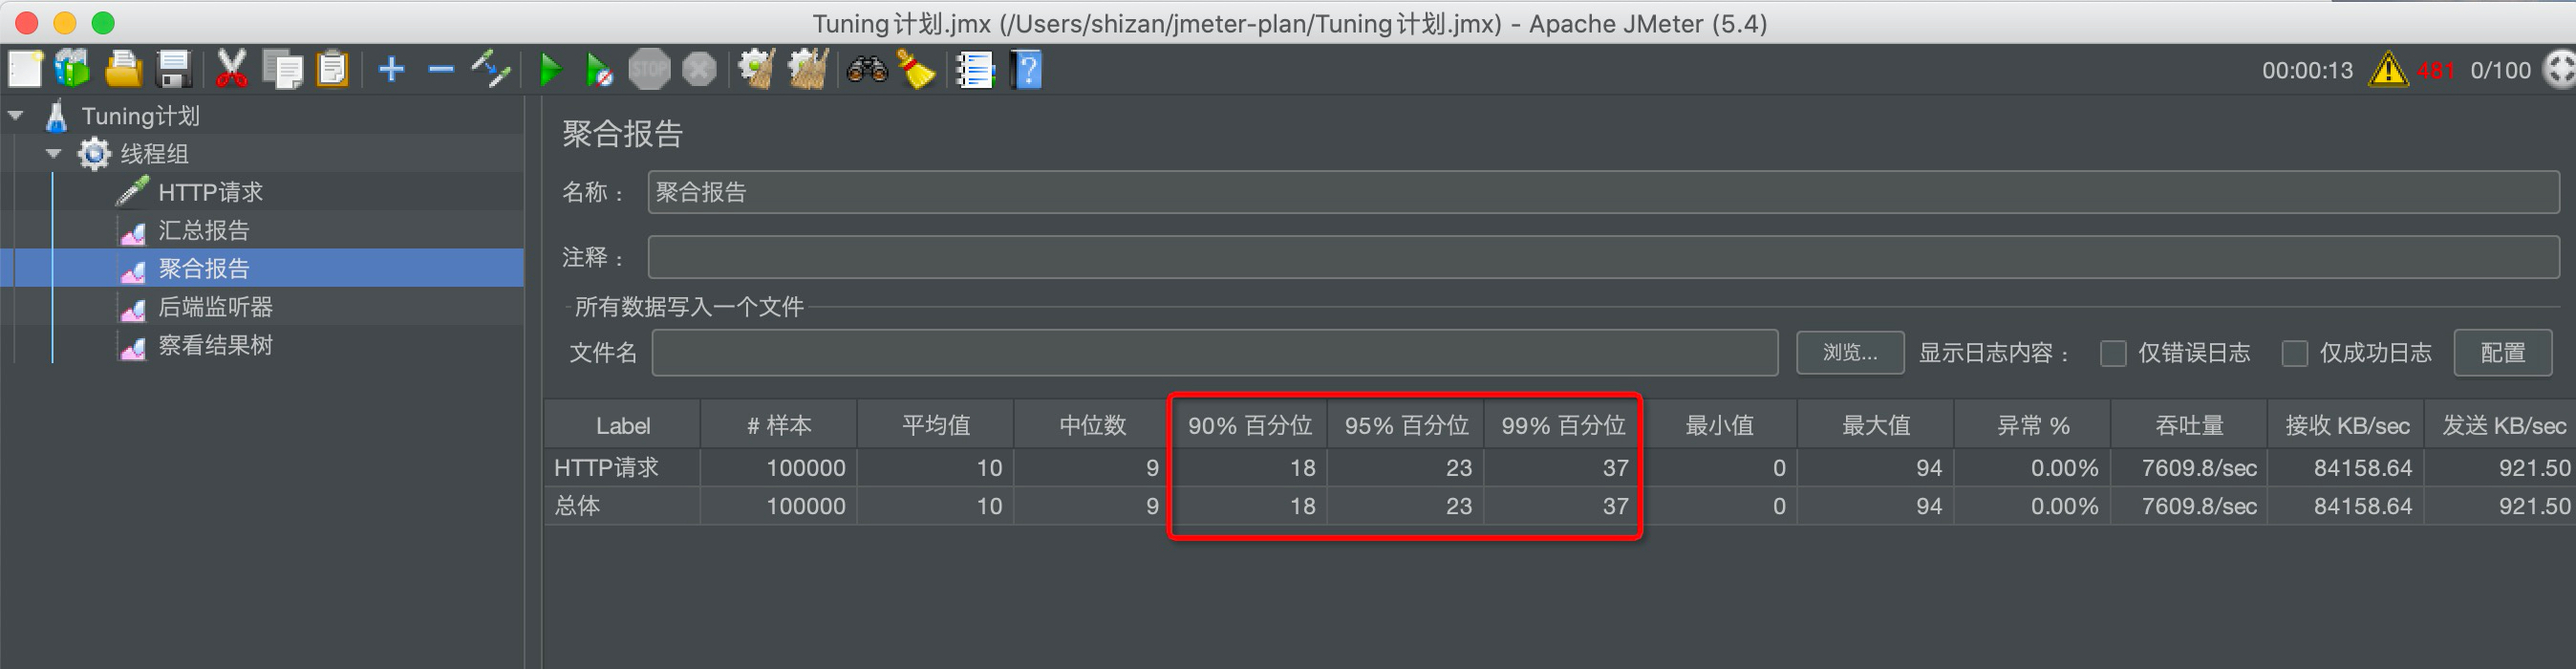
The concerns are: GC times, GC time, and the average response time of Jmeter
6.2 initial state
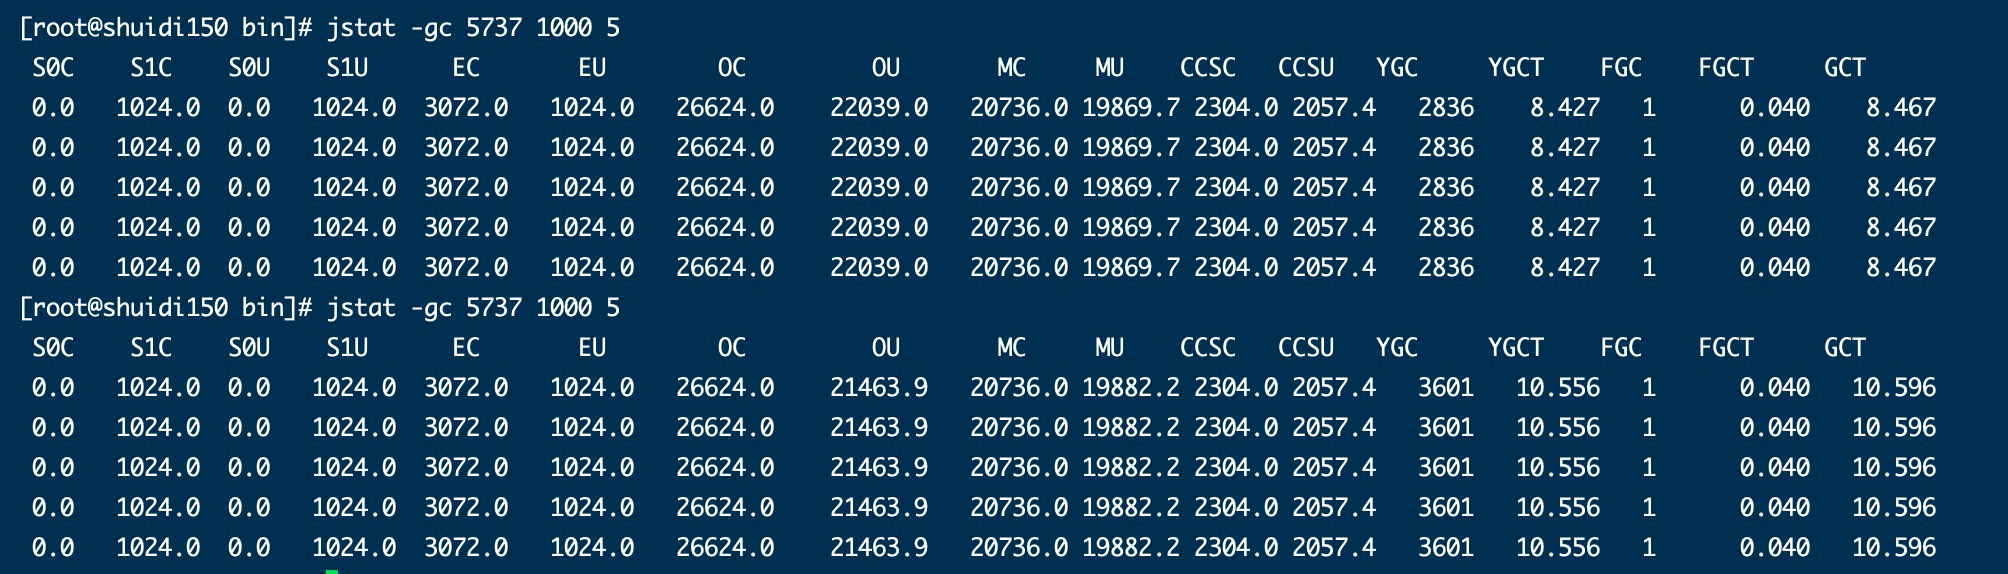
GC time / YoungGC times
(10556-8427)/(3601-2836)=2129/765=2.783
6.3 after optimization
export CATALINA_OPTS="$CATALINA_OPTS -XX:ConcGCThreads=2"
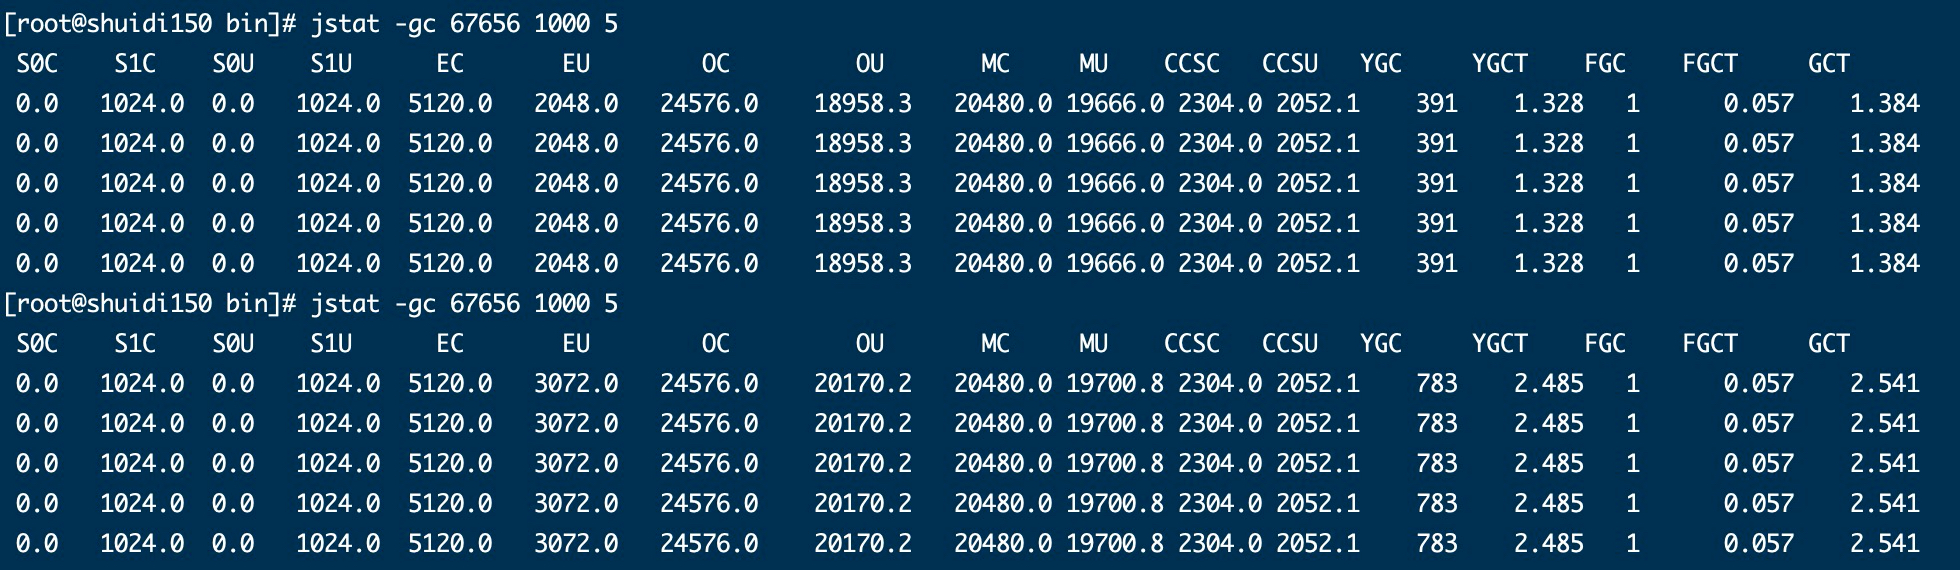
GC time / YoungGC times
(2485-1328)/(783-391)=1157/392=2.95
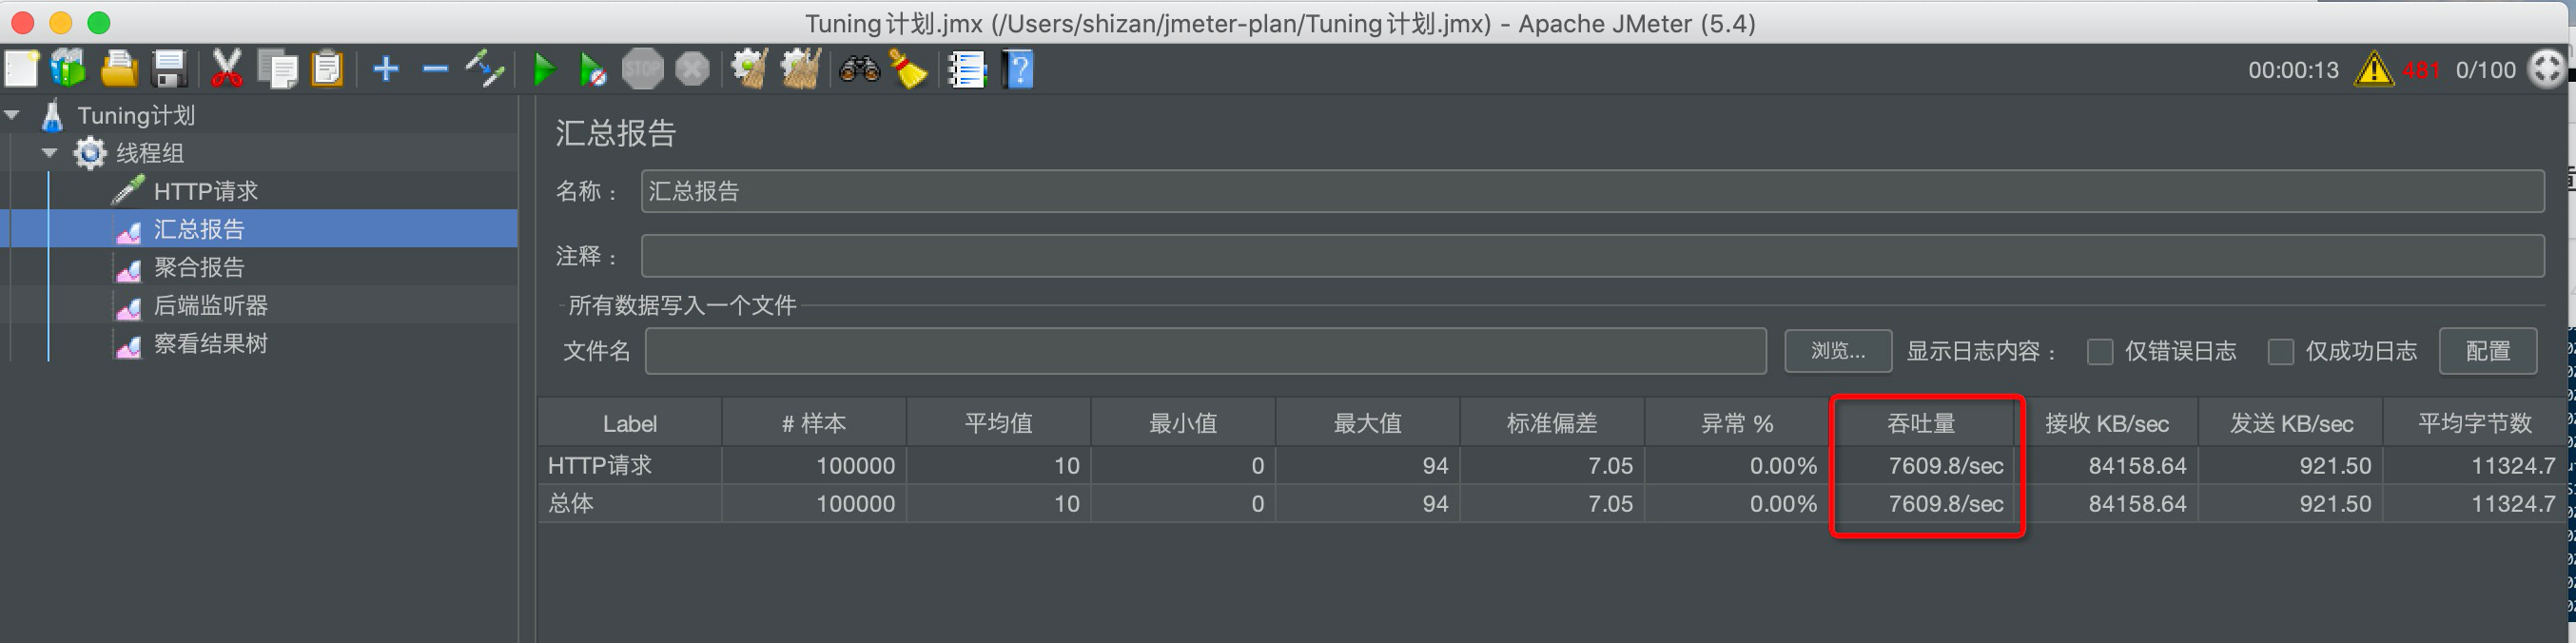
6.4 summary
The throughput is increased from 6717 to 7609
7. Performance optimization case 6: adjust garbage collector to improve service throughput
7.1 initial configuration
The system configuration is single core. We see the log and display DefNew, indicating that we use the serial collector, SerialGC
7.2. Optimized configuration 1
Use ParallelGC
export CATALINA_OPTS="$CATALINA_OPTS -XX:+UseParallelGC"
export CATALINA_OPTS="$CATALINA_OPTS -Xms60m"
export CATALINA_OPTS="$CATALINA_OPTS -Xmx60m"
export CATALINA_OPTS="$CATALINA_OPTS -XX:+PrintGCDetails"
export CATALINA_OPTS="$CATALINA_OPTS -XX:MetaspaceSize=64m"
export CATALINA_OPTS="$CATALINA_OPTS -XX:+PrintGCDateStamps"
export CATALINA_OPTS="$CATALINA_OPTS -Xloggc:/mydata/tomcat8.5/logs/gc6.log"
view log
Since the server is still single core, the throughput has not changed
7.3 optimized configuration 2
Modify the server to 4 cores
view log
The throughput has been greatly improved, or even doubled, which shows that using parallel collectors on multi-core machines has a significant effect on the throughput of the system.
7.4 optimized configuration 3
Change to G1 collector
export CATALINA_OPTS="$CATALINA_OPTS -XX:+UseG1GC"
export CATALINA_OPTS="$CATALINA_OPTS -Xms60m"
export CATALINA_OPTS="$CATALINA_OPTS -Xmx60m"
export CATALINA_OPTS="$CATALINA_OPTS -XX:+PrintGCDetails"
export CATALINA_OPTS="$CATALINA_OPTS -XX:MetaspaceSize=64m"
export CATALINA_OPTS="$CATALINA_OPTS -XX:+PrintGCDateStamps"
export CATALINA_OPTS="$CATALINA_OPTS -Xloggc:/mydata/tomcat8.5/logs/gc6.log"
view log
Throughput increased significantly
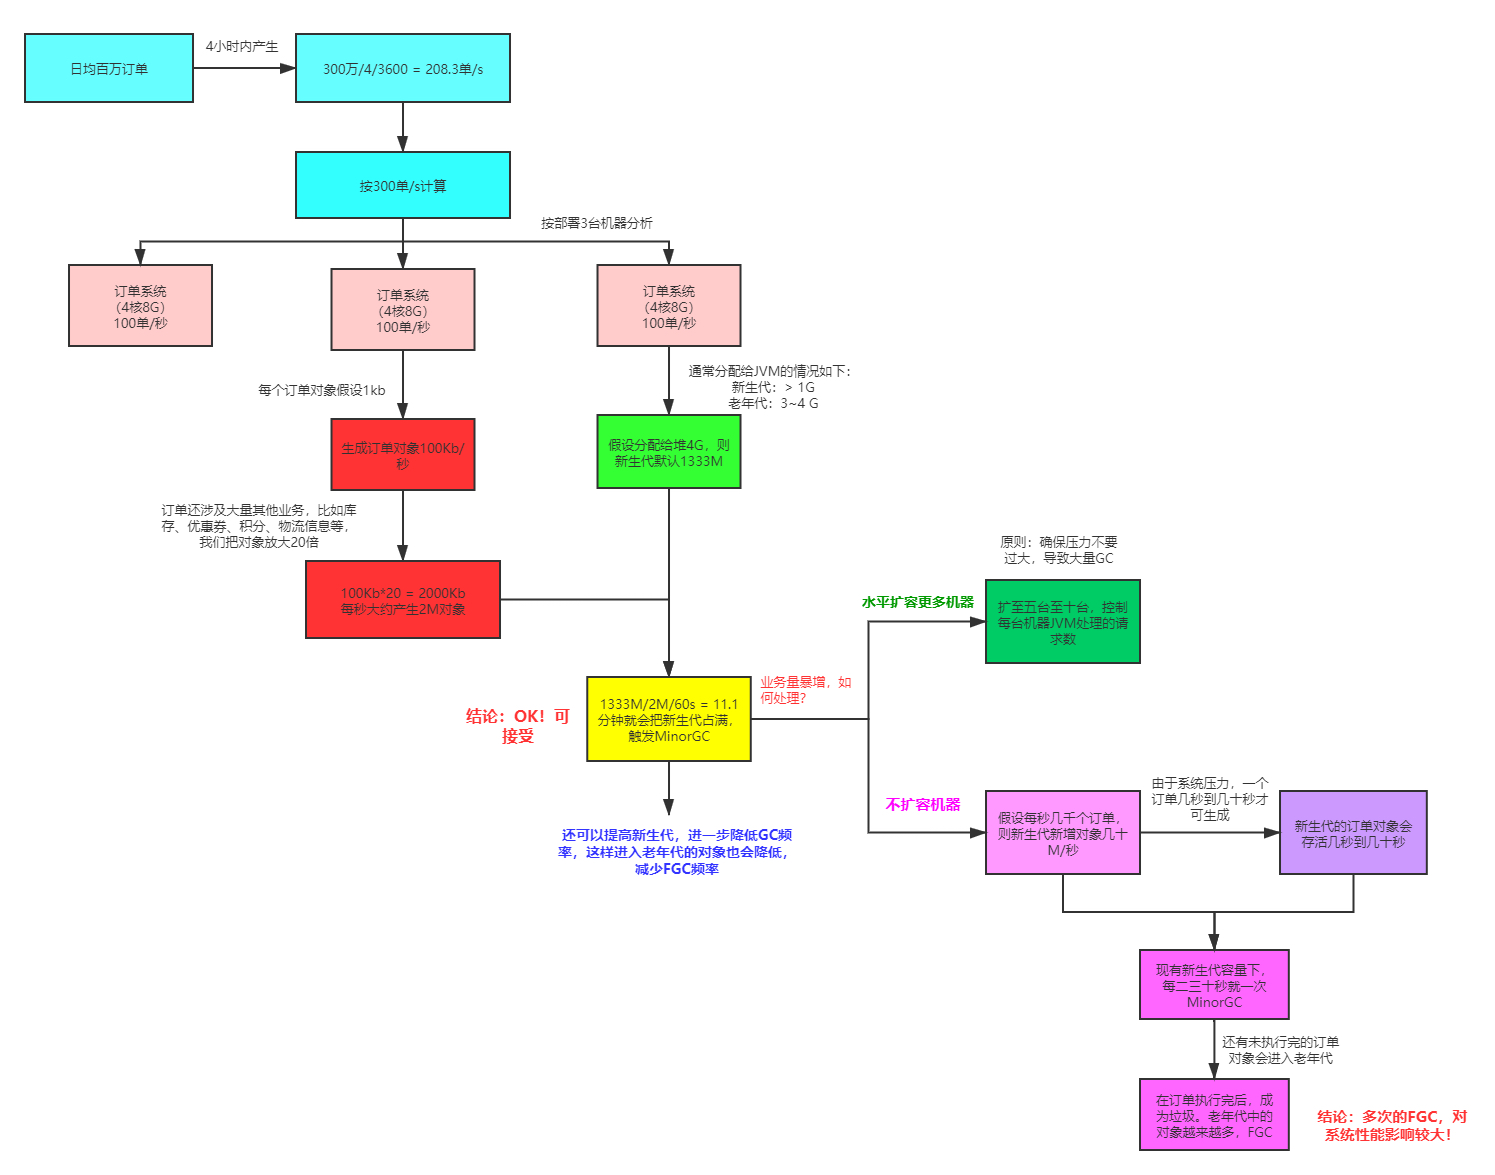
8. Performance optimization case 7: how to set JVM parameters in the daily million order trading system
One million orders a day is definitely the transaction level of top e-commerce companies. Millions of orders are generally generated in about 4 hours. Let's calculate how many orders are generated per second,
3000000 / 3600 / 4 = 208.3 orders / s, we calculate it according to 300 orders per second.
How to configure the server is only the first level!
The second level question: if the response time is required to be controlled within 100ms, how to achieve it?
Pressure test, tuning!
9. Interview summary
9.1,part1
How to support the large-scale ticket grabbing during the Spring Festival in 12306?
12306 is known as the second kill website with the largest concurrency in China, with a concurrency of one million.
Ordinary E-Commerce orders -- > place orders -- > order system (IO) inventory reduction > waiting for user payment
12306 a possible model: Order -- > inventory reduction and order (redis, kafka) make -- > and other payments asynchronously at the same time
But inventory reduction will eventually put pressure on a server. how?
Distributed local inventory + separate server for inventory balancing!
9.2,part2
Question 1: there is a 500000 PV information website (extracting documents from disk to memory). The original server is a 32-bit, 1.5G heap, and the user feedback website is relatively slow. Therefore, the company decided to upgrade. The new server has 64 bits and 16G heap memory. As a result, the user feedback that the jam is very serious, but the efficiency is lower than before!
1. Why is the original website slow?
Frequent GC, long STW time and slow response time!
2. Why is it more Caton?
The larger the memory space, the longer the FullGC time and the longer the latency
3. What should I do?
>Garbage collector: parallel GC; ParNew+CMS; G1
>Configure GC parameters: - XX:MaxGCPauseMillis, - XX:ConcGCThreads
>Optimize the proportion of memory space according to the analysis of log and dump files
jstat jinfo jstack jmap
Question 2: the system CPU is often 100%. How to tune it? (interview frequency)
If CPU100%, there must be threads occupying system resources. The specific steps have been mentioned earlier.
Note: sometimes the working thread occupies 100% of the CPU, and the garbage collection thread may occupy 100%
Question 3: how to find the problem when the system memory is soaring? (interview frequency)
On the one hand: jmap -heap;jstat;gc log condition
On the other hand: dump file analysis
Question 4: how to monitor the JVM
>Command line tools
>Graphical interface