
Preface
What is elastic search? Since it's English, let's take a look at its literal meaning with the help of an elastic search. It can be divided into two independent words, elastic and search. In this case, we have no brain and have a wave. The explanation is as follows:
From the perspective of a reasonable explanation, we can simply understand it as follows: elastic search is an elastic, flexible, elastic and searchable tool. o(*≧▽≦)ツ┏━┓
Baidu Encyclopedia explains it as follows:
Elasticsearch is a Lucene based search server. It provides a distributed multi-user full-text search engine based on RESTful web interface. Elasticsearch is developed in Java language and released as open source under Apache license. It is a popular enterprise search engine. Elasticsearch is used in cloud computing, which can achieve real-time search, stability, reliability, fast, easy to install and use. Official clients are available in Java,. NET (C), PHP, Python, Apache, Groovy, Ruby, and many other languages. According to the ranking of DB engines, elastic search is the most popular enterprise search engine, followed by Apache Solr, which is also based on Lucene.
From the above information, we can know that Elasticsearch is a real-time, distributed storage search engine. In the actual development process, we often put the data in the Elasticsearch search search engine, and then get the actual data from the engine. And in the actual search process, we will also have a lot of Api support to retrieve data, such as sorting, condition query and so on. The most powerful part of elastic search is its fuzzy retrieval function. When it comes to this, a friend who has some Mysql experience but has not been exposed to elastic search may have a question: isn't Mysql invincible? Can't the like statement fuzzy query? where and can't be conditionally retrieved? Can't orderby sort data? I just picked up a Sql statement at random. Can't I fulfill the business requirements
select department_name, count(*) Number of employees
from departments d, employees e
where d.department_id = e.department_id
group by d.department_id
having count(*)>5
order by count(*) desc;
It's true that the above SQL code can meet the actual needs, but when our business becomes more and more complex and huge, and our number of users is increasing, we have to think about it from the perspective of users. Imagine what kind of screen it would be if Taobao's users had to wait tens of seconds every day to search for the data they wanted. For example, when we open common files to retrieve the data we need, such as txt, word and excel, we can open them quickly. That's because these files occupy too little actual space. Most of these files are only a few kb. Suppose we open a log file with G as a single bit, can the system be as normal as before? In other words, Elasticsearch uses index search, which has powerful search ability and can achieve real-time search, stability, reliability, speed and installation.
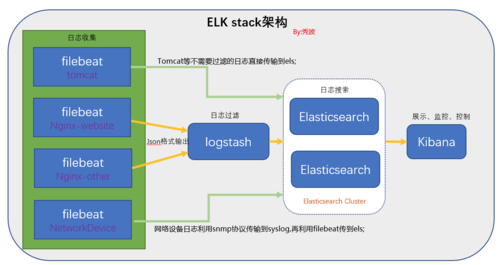
In addition, in the process of processing logs, elastic search is often used in conjunction with Logstash, the data collection and log analysis engine, and the analysis and visualization platform named Kibana, which is often called ELK system. The text will mainly introduce the following aspects
- Building ELK system based on Docker container
- The construction of elastic search cluster
- Introducing the IK word breaker plug-in in elastic search
- Focus on the operation of elastic search based on spring data es
- Finally, based on the data in the database of this small program to skillfully operate elastic search
Construction of ELK system
Elasticsearch is a real-time full-text search and analysis engine, which provides three functions of data collection, analysis and storage. It is a set of open REST and JAVA API structures that provide efficient search functions and can be extended distributed system. It is built on the Apache Lucene search engine library.
Logstash is a tool for collecting, analyzing and filtering logs. It supports almost any type of log, including system log, error log, and custom application log. It can receive logs from many sources, including syslog, messaging (such as RabbitMQ), and JMX, which can output data in many ways, including email, websockets, and elastic search.
1
Kibana is a Web-based graphical interface for searching, analyzing, and visualizing log data stored in elastic search metrics. It uses elastic search's REST interface to retrieve data. It not only allows users to create customized dashboard views of their own data, but also allows them to query and filter data in special ways
 Note: image source network
The summary is that elastic search is used for search, Kibana is used for visualization, and Logstash is used for collection. Next, we will build an ELK system based on Docker. The previous articles have been recorded about the installation and basic use of Docker. There is no more introduction here. In addition, it is worth noting the version relationship among the three (if other versions of tools are used, other problems may occur if they are built as follows):
- Elasticsearch:5.6.8
- Kibana:5.6.8
- Logstash:lastest
Installation of Elasticsearch
- Docker pulls Elasticsearch image
docker pull elasticsearch:5.6.8
- Create the configuration file and data directory mapped by the elastic search container locally
# Create a profile locally in centos and configure
mkdir -p /resources/elasticsearch/config        # Create config directory
mkdir -p /resources/elasticsearch/data             # Create data directory
# Configure http.host as the authorization object of 0.0.0.0, and write the configuration to the elasticsearch.yml configuration file in the config directory
echo "http.host: 0.0.0.0" >> /resources/elasticsearch/config/elasticsearch.yml
- Create an elastic search container and turn it on
# Create a container and start it (single node refers to single node mode, and the construction of elastic search in cluster mode will be introduced later)
# Note: in docker \ indicates line breaking
docker run --name elasticsearch -p 9200:9200 \
-e "discovery.type=single-node" \
-e ES_JAVA_OPTS="-Xms256m -Xmx256m" \
-v /resources/elasticsearch/config/elasticsearch.yml:/usr/share/elasticsearch/config/elasticsearch.yml \
-v /resources/elasticsearch/data:/usr/share/elasticsearch/data -d elasticsearch:5.6.8
# Parameter introduction:
# --name: create an alias for the container
# -p: Map the running port of the container to the local port
# -E "discovery. Type = single node": it means to create in a single node mode. Later, the construction of cluster mode will be introduced
# -v: Indicates that the configuration files and data files in the container are mapped to the files created locally above for later configuration

# Set the elasticsearch container to boot from
docker update new-elasticsearch --restart=always
In this way, we have installed elasticsearch. We can use the curl command to test:
# Using curl to access the running port of elastic search
curl localhost:9200
# Run the output as follows to install successfully
{
  "name" : "XwmNOpR",
  "cluster_name" : "elasticsearch",
  "cluster_uuid" : "yB3VNHxmQzevk1vXUQTkcg",
  "version" : {
    "number" : "5.6.8",
    "build_hash" : "688ecce",
    "build_date" : "2018-02-16T16:46:30.010Z",
    "build_snapshot" : false,
    "lucene_version" : "6.6.1"
  },
  "tagline" : "You Know, for Search"
}
Of course, we can also use a browser to access it. The access method is http://[ip]:9200, and the port is the virtual machine ip. The corresponding results can also be obtained. In addition, if Alibaba cloud or Tencent cloud server is used, the corresponding security group needs to be configured in the console, otherwise it cannot be accessed
Install kibana
- Docker pulls Kibana image
# Docker pulls Kibana image
docker pull kibana:5.6.8
- Create a container and set up boot
# Create the kibana container. The corresponding parameters are as above. In addition, you need to specify the address of elasticsearch
docker run --name kibana -e ELASTICSEARCH_URL=http://[ip]:9200 -p 5601:5601 \
-d kibana:5.6.8
# Configure power on self start
docker update new-kibana --restart=always
After the installation, we can curl the address of kibana or visit http://[ip]:5601 in the browser:
[root@iZm5eei156c9h3hrdjpe77Z ~]# curl localhost:5601
<script>var hashRoute = '/app/kibana';
var defaultRoute = '/app/kibana';

var hash = window.location.hash;
if (hash.length) {
  window.location = hashRoute + hash;
} else {
  window.location = defaultRoute;
}</script>[root@iZm5eei156c9h3hrdjpe77Z ~]#
Install logstash
- Pull Logstash image
# Pull mirror image
docker pull logstash
- Create a configuration file and configure input and output
# Create the logstash.conf file in / resources/logstash and use vim to edit it
mkdir /resources/logstash
# Edit with vim
vim logstash.conf
# The content of the configuration file is as follows. Replace it with your own Elasticsearch ip
input {
    tcp {
        port => 4560
        codec => json_lines
    }
}
output{
  elasticsearch {
  hosts => ["[ip]:9200"]
  index => "applog"
  }
  stdout { codec => rubydebug }
}- Create a container and boot it
# To create a container, you need to specify Elasticsearch to link
docker run -d -p 4560:4560 \
-v /resources/logstash/logstash.conf:/etc/logstash.conf \
--link elasticsearch:elasticsearch \
--name logstash logstash \
logstash -f /etc/logstash.conf

# Power on self start
docker update new-logstash --restart=always
- The above is the installation process of Logstash. We can enter the Logstash container to simply use the following
Enter the Logstash container and cd it to the bin directory
docker exec -it logstash /bin/bash
cd /usr/share/logstash/bin
Execute logstash command
# Note: you need to specify the -- path.data parameter here, otherwise there will be errors in the running process
logstash -e 'input { stdin { } } output { stdout {} }' --path.data=/root/
After running, we enter hello world in the console, and the following results will appear
Import and export of data in Elasticsearch index base based on Logstash
Application requirements: there is no info index library in es of 192.168.220.201 host, but there is an info index library in es of 192.168.220.202. At this time, we can try to export skuinfo index library from 192.168.220.202 to a json file by using logstash, and then import the file into es index library of 192.168.220.201 by using logstash.
Using logstash to export es data from index library
Create a temporary folder to save the exported data and configuration files
mkdir /resources/mydata/logstash_temp
Use vim to create and configure an export.conf configuration file
vim export.conf
The contents of the export.conf file are as follows
#  Export the info index library in 192.168.220.202 Elasticsearch to an info.json file
input{
     elasticsearch {
        hosts => ["192.168.220.202:9200"]   # Specifies the address of Elasticsearch, which contains the target data
                index => "info"             # Specify the index library to export
                size => 200                 # Specify the size of each batch of exported data. Note that it cannot be set too large, otherwise an error will occur
            scroll => "5m"
                docinfo => false
    }
}
output{
   file {
     path => "skuinfo.json"                 # Specify the saved data path and the name of the json file
   }
 }
Use the docker cp command to copy the exported configuration file to the bin directory of the logstash container
# cp the export.conf file to the logstash container
docker cp ./export.conf logstash:/usr/share/logstash/bin
Enter the logstash container and execute the configuration file
# Enter logstash and execute the configuration file
docker exec -it logstash /bin/bash
cd /usr/share/logstash/bin
./logstash -f ./export.conf --path.data=/root/ # Be sure to specify the path.data property, otherwise an error will be reported
After execution, an info.json file will be generated in the current directory, and the data file will be exported to centos
# After execution, an info.json file will be generated in the current directory and exported to centos
docker cp logstash:/usr/share/logstash/bin/info.json /resources/mydata/
You can export the data in the index library to a JSON file, which exists in / resources/mydata/info.json
logstash's import of data in Elasticsearch index library
- Complete the import of json data and the configuration of conf file
# 1. Import the info.json file in 192.168.220.202 to windows local using xftp tool
# 2. Import the file into 192.168.220.201 / resources / mydata / logstash_tempthrough xftp
cd /mydata/mysources/logstash_temp
# Use vim to configure import.conf
vim import.conf
- The configuration file of import.conf is as follows
# Read json file
input {
  file {
    # Set json file path. Multiple file paths can be set to array [], fuzzy matching*
    path => "/root/skuinfo.json"
    start_position => "beginning"
    # Set encoding
    codec => json {charset => "UTF-8"}
    # When there are multiple files, you can use type to specify the input / output path
    type => "json_index"
  }
}

# Filter formatted data
filter {
    mutate{
        #Delete invalid field
        remove_field => ["@version","message","host","path"]
    }
    # Add a timestamp field to increase @ timestamp time by 8 hours
    ruby { code => "event.set('timestamp', event.get('@timestamp').time.localtime + 8*60*60)" }

}

# Data output to ES
output {
    #Log output format, json_lines;rubydebug, etc
    stdout {
        codec => rubydebug
    }
    #Output to es
    if[type] == "json_index"{
        #Unresolved json is not recorded in elasticsearch
        if "_jsonparsefailure" not in [tags] {
            elasticsearch {
                #es address ip port
                hosts => "192.168.220.201:9200"
                # Configuration data transferred to es
                index => "info"
                #type
                document_type => "skuinfo"
            }
        }
    }
}- After completing the configuration of the import.conf file, we can actually import the data
# Import the import.conf file and info.json file into the logstash container
docker cp ./import.conf logstash:/usr/share/logstash/bin    # Import conf configuration file
docker cp ./skuinfo.json logstash:/root/                    # Import the json data file. The imported path should be consistent with the configuration path in the conf configuration file
# Enter the logstash container and execute the logstash command to complete the data import
docker exec -it logstash /bin/bash
cd /usr/share/logstash/bin
./logstash -f ./import.conf --path.data=/root/
Wait for the execution to finish, and then visit 192.168.220.201:5601 to access the data in the info index library
Install ik Chinese word segmentation
The installation of ik Chinese word segmentation plug-in
Pit 1: when we install the ik word breaker, we usually download the zip file in github, then transfer it to centos, and finally upload it to the elastic server container. However, the version marked in github is not the same as the actual version. On the other hand, when we download different versions of elastic search, some versions of the container will run in error, some of them are normal. So when we build elk, we will install version 5.6.8 at the same time
Pit 2: we usually download the zip file (no matter what file) on github very slowly (not generally), so we can use gitee (code cloud) to download when we use github later. When creating a warehouse in the code cloud, we choose to import the existing warehouse, and then copy and paste the git connection of the original github Post create. Once created, we can use the code cloud to indirectly download any file of github warehouse, and the download speed will be greatly accelerated
ik participator link: https://gitee.com/tianxingjian123/elasticsearch-analysis-ik
# IK participator link: https://gitee.com/tianxingjian123/elasticsearch-analysis-ik
# After downloading the 5.6.8 ik word breaker, we need to use maven to package it
cd C:\Users\M\Desktop\code-demo\elasticsearch-analysis-ik
mvn package -Pdist,native -DskipTests -Dtar
# After packaging with maven, you can generate a target folder with. / releases/elasticsearch-analysis-ik-5.6.8.zip
# Create an ik folder in the virtual machine
mkdir ik
# Then use xftp to upload the zip file to ik folder, unzip the zip file with unzip command, and delete the zip file after unzip
unzip elasticsearch-analysis-ik-5.6.8.zip
rm -rf elasticsearch-analysis-ik-5.6.8.zip
# Then use docker to transfer the ik folder to the plugins of the elastic search container
docker cp ./ik elasticsearch:/usr/share/elasticsearch/plugins
# Enter the elastic search container
docker exec -it new-elasticsearch /bin/bash
# After that, the following command can be used to check whether the ik folder has been uploaded successfully
root@78f36ce60b3f:/usr/share/elasticsearch# cd plugins/
root@78f36ce60b3f:/usr/share/elasticsearch/plugins# ls
ik
root@78f36ce60b3f:/usr/share/elasticsearch/plugins# cd ik
root@78f36ce60b3f:/usr/share/elasticsearch/plugins/ik# ls
commons-codec-1.9.jar        httpclient-4.5.2.jar
commons-logging-1.2.jar        httpcore-4.4.4.jar
config             plugin-descriptor.properties
elasticsearch-analysis-ik-5.6.8.jar
root@78f36ce60b3f:/usr/share/elasticsearch/plugins/ik#
# Then go to bin directory and check the installed ik word breaker plug-in
root@78f36ce60b3f:cd /usr/share/elasticsearch/bin
root@78f36ce60b3f:/usr/share/elasticsearch/bin# elasticsearch-plugin list
ik
After the above operations are completed, even if the ik Chinese word breaker plug-in has been introduced into elastic search, note: the above steps must be completely consistent, otherwise various problems will be caused.
Segmentation result test
# Open the Chrome browser and visit: http://192.168.220.201:5601/. If the kibana interface appears, the kibana installation is normal
# Enter the Dev Tools interface of kibana, and then use the following to test whether the ik Chinese word breaker plug-in is installed normally
GET bank/_analyze
{
  "text": "It's 1:30 a.m. on New Year's Eve. It's a little cold. I'll go to bed after I finish this article!",
  "analyzer": "ik_smart"
}
After running, the test results of ik Chinese word segmentation are as follows. It can be seen that the Chinese sentence segmentation has been completed
The construction of elastic search cluster
Create the configuration files and data files needed by the cluster for container mapping
mkdir /mydata
cd /mydata
mkdir elasticsearch1
cd elasticsearch1
mkdir data # Make sure the data directory is empty, otherwise there will be errors in the actual operation process
mkdir config
cd conf
vim elasticsearch.yml
# The configuration information of elasticsearch.yml file is as follows
Configuration information of elasticsearch.yml file:
# Turn on cross domain. In order for ES head to be accessible, additional header plug-ins need to be installed here
http.cors.enabled: true
http.cors.allow-origin: "*"

# Name of cluster (same)
cluster.name: elasticsearch
# Name of the node (different, configured by alias)
node.name: es1
# Specifies whether the node is eligible to be elected as the master node. The default is true. es is the first machine in the cluster to be the master. If the machine is suspended, the master will be re elected
node.master: true
# Allow this node to store data (on by default)
node.data: true
# Allow any ip access
network.host: 0.0.0.0
# Through this ip list for node discovery, I configure the ip address of each container here
discovery.zen.ping.unicast.hosts: ["192.168.220.200:9300","192.168.220.200:9301","192.168.220.200:9302"]
#Without this setup, clusters that suffer from network failures are likely to be divided into two separate clusters - leading to brain splitting - which can lead to data loss
discovery.zen.minimum_master_nodes: 2
After the first elastic search configuration file is created, the other two nodes are created in the same way
# Configure es2
cd /mydata
cp -r ./elasticsearch1 ./elasticsearch2
# Modify a piece of information in conf/elasticsearch.yml
node.name=es2

# Configure es3
cd /mydata
cp -r ./elasticsearch1 ./elasticsearch3
# Modify a piece of information in conf/elasticsearch.yml
node.name=es3
Create the elasticsearch container and start
# Create es1 container and start
docker run --name es1 -p 9200:9200 -p 9300:9300 \
-e ES_JAVA_OPTS="-Xms256m -Xmx256m" \
-v /mydata/elasticsearch1/config/elasticsearch.yml:/usr/share/elasticsearch/config/elasticsearch.yml \
-v /mydata/elasticsearch1/data:/usr/share/elasticsearch/data -d elasticsearch:5.6.8

# Introducing ik word breaker
docker cp ./ik es1:/usr/share/elasticsearch/plugins

# Create es2 container and start
docker run --name es2 -p 9201:9200 -p 9301:9300 \
-e ES_JAVA_OPTS="-Xms256m -Xmx256m" \
-v /mydata/elasticsearch2/config/elasticsearch.yml:/usr/share/elasticsearch/config/elasticsearch.yml \
-v /mydata/elasticsearch2/data:/usr/share/elasticsearch/data -d elasticsearch:5.6.8

# Create the es3 container and start it
docker run --name es3 -p 9202:9200 -p 9302:9300 \
-e ES_JAVA_OPTS="-Xms256m -Xmx256m" \
-v /mydata/elasticsearch3/config/elasticsearch.yml:/usr/share/elasticsearch/config/elasticsearch.yml \
-v /mydata/elasticsearch3/data:/usr/share/elasticsearch/data -d elasticsearch:5.6.8
At this point, the above operations can be completed to build the elastic search cluster
- Visit http://192.168.220.200:9200, http://192.168.220.200:9201, and http://192.168.220.200:9202, respectively, to find that the building has been completed, and display the corresponding information of each es node.
- Visit http://192.168.220.200:9200/_cat/nodes to view the cluster nodes.
- Visit http://192.168.220.200:9200// cat/health to view health (green, yellow, red)
Problems encountered
- After instantiating the container, it may be limited by the number of processes. We need to increase the number of processes in the virtual machine
vim /etc/sysctl.conf
# Add the following configuration
vm.max_map_count=655360
# Restart configuration after exiting
sysctl -p
- After instantiating the above three es containers, there may be some memory problems. At this time, we need to improve the memory of the virtual machine
# After instantiating the above three es containers, view the currently available memory
free -m
# After running the above command, you may find that the current available configuration is only more than 50, and when we visit http://192.168.220.200:9200, we also find that the request fails. At this time, we open the settings of the corresponding virtual machine, set the memory to 3GB, and then re-enter the virtual machine in a short time. Using the free-m command, we can find that there are more than 1000 available memory at this time

# After the above configuration, we restart the three es containers
docker restart es1 es2 es3 || docker start es1 es2 es3

# Wait for the container to restart, and then use the Chrome browser to access es
http://192.168.220.200:9200
http://192.168.220.200:9201
http://192.168.220.200:9202
# It can be found that the building has been completed and the corresponding information of each es node is displayed

# View the cluster nodes in kibana's dev tools
GET /_cat/nodes
# View health status (green, yellow, red)
GET /_cat/health