linux index monitoring
Since I was responsible for the production environment deployment, I have encountered a number of online environment memory and CPU problems. Because of the popularity of microservices and containers, K8s + prometheus + grafana + alert can be easily used for monitoring, which is enough to cover most scenarios.
The most important things have been assigned to the most appropriate components, but it is also necessary to understand some commands and indicators on the bare metal machine:
- Understand what indicators to monitor
- Usually, writing some scripts often leads to OO or high CPU utilization.
First with a picture from linuxperf As an outline, I try to sort out some indicators in case of any emergency.
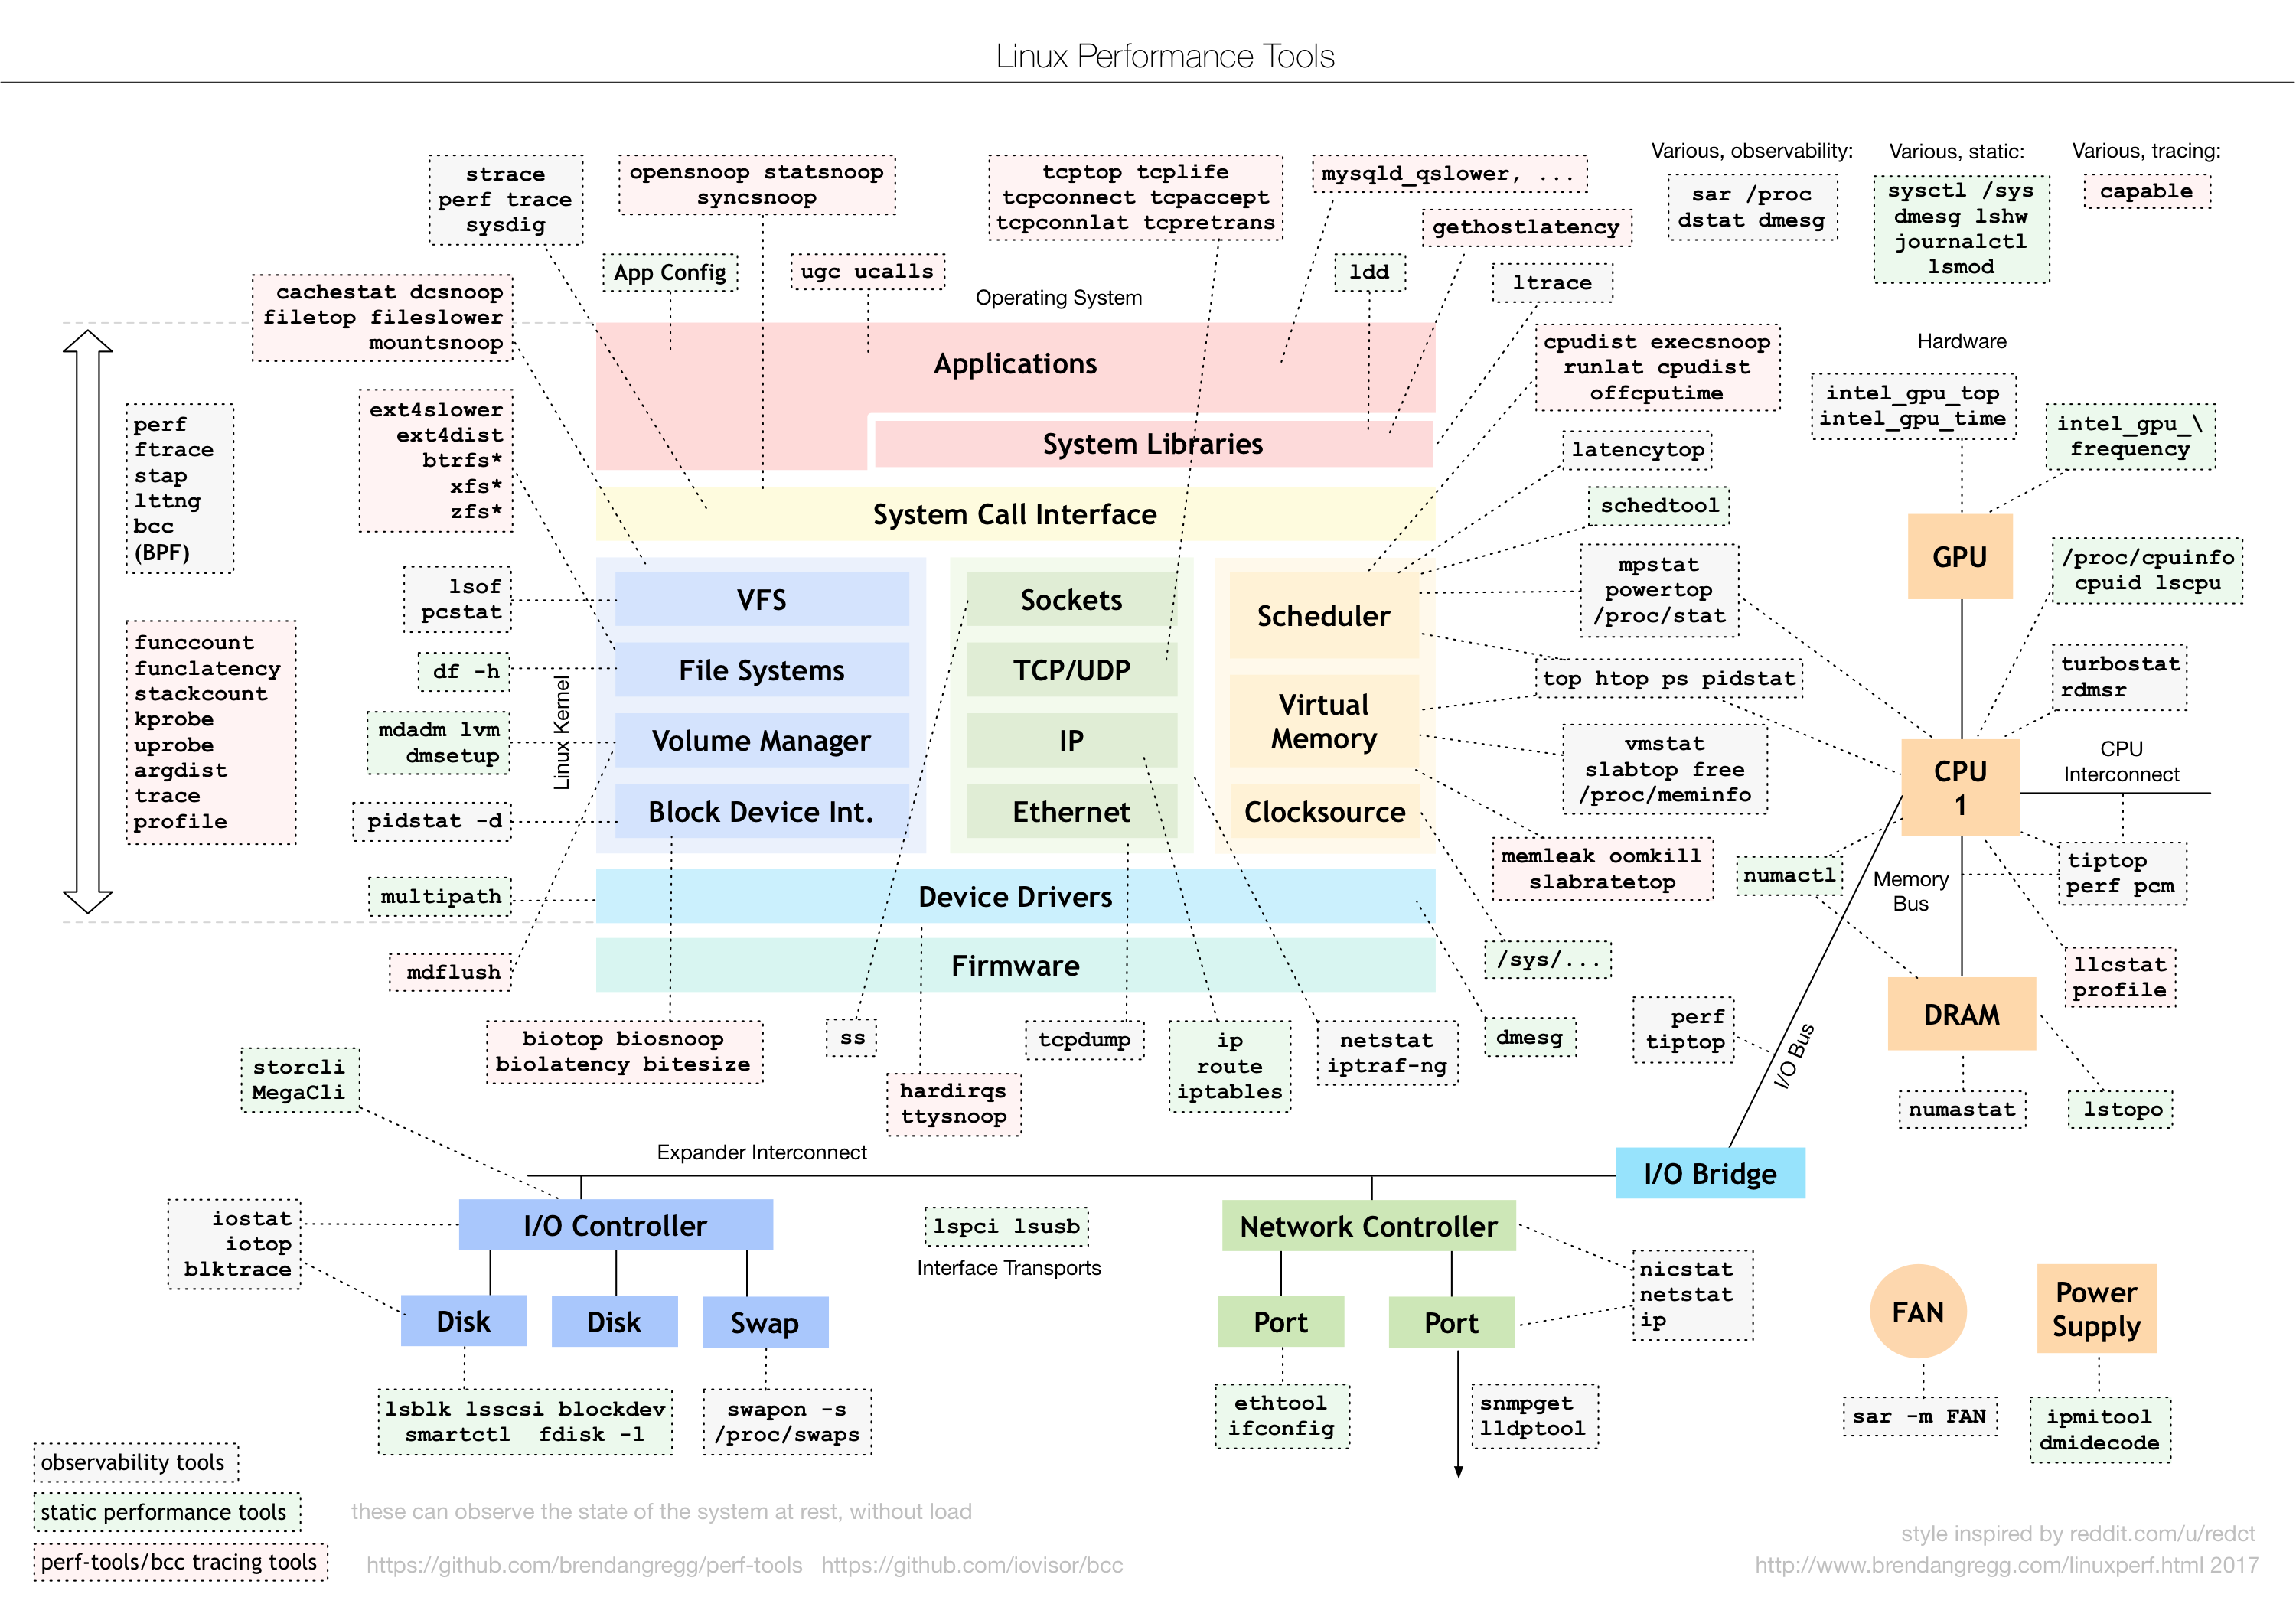
- Original address: A note on the monitoring of linux indexes · github
- Series: Server operation and Maintenance Notes · github
htop/top
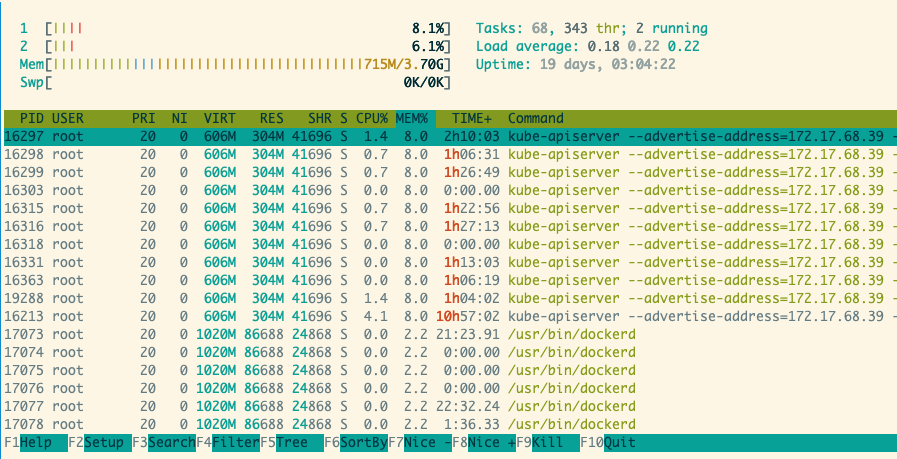
htop is enough to cover most indicators, and you can view help directly in detail.
TIME here refers to CPU TIME
The number of tasks in htop refers to the process tree, and the number of tasks in top refers to the number of process tree + kernel threads. Refer to the article. https://www.cnblogs.com/arnoldlu/p/8336998.html
- sort: by mem/cpu/state. Sorting by process state is also crucial, especially when the load average is too high. Sort by memory and CPU usage to locate high resource users.
- filter
- fields
- process/ count
- ...
CPU basic information
In linux, everything is a file. Check / proc/cpuinfo for information. Other derivative issues
- How to view the number of CPU s
- How to view CPU model
- How to view the main frequency of CPU
cat /proc/cpuinfo
cat /proc/stat
Average load
uptime and w can print out the average load of the system in the past 1, 5 and 15 minutes. At the same time, you can use sar-q to see the dynamic average load.
$ uptime
 19:28:49 up 290 days, 20:25,  1 user,  load average: 2.39, 2.64, 1.55
$ w
 19:29:50 up 290 days, 20:26,  1 user,  load average: 2.58, 2.63, 1.61
USER     TTY      FROM          LOGIN@   IDLE   JCPU   PCPU WHAT
root     pts/0    172.16.0.1    19:27    6.00s  0.05s  0.00s tmux a
Explain the average load in uptime's man manual
System load averages is the average number of processes that are either in a runnable or uninterruptable state.
It refers to the average number of processes in the running and non interruptible state in the system.
For 4-core CPU, if the average load is higher than 4, it means the load is too high.
Dynamic average load
$ sar -q 1 100
Linux 3.10.0-957.21.3.el7.x86_64 (shanyue)      10/21/19        _x86_64_        (2 CPU)

16:55:52      runq-sz  plist-sz   ldavg-1   ldavg-5  ldavg-15   blocked
16:55:53            0       464      0.07      0.11      0.13         0
16:55:54            0       464      0.06      0.10      0.13         0
16:55:55            0       464      0.06      0.10      0.13         0
16:55:56            0       464      0.06      0.10      0.13         0
16:55:57            0       464      0.06      0.10      0.13         0
16:55:57            0       464      0.06      0.10      0.13         0
Average:            0       464      0.06      0.10      0.13         0
CPU usage
You can directly use the command of htop/top to view the cpu utilization, and idle's cpu time can also be directly displayed through top.
CPU utilization = 1 - CPU idle time / CPU time
$ top
%Cpu(s):  7.4 us,  2.3 sy,  0.0 ni, 90.1 id,  0.0 wa,  0.0 hi,  0.2 si,  0.0 st
- User: user state, excluding nice
- system: kernel state
- Nice: low priority user state, nice value is 1-19 CPU time
- idle (id)
- iowait (wa)
- irq (hi)
- softirq (si)
- steal (st)
system call
strace view system calls
- -p specifies pid
- -c count the number of system calls and CPU time.
# Used to see the system calls used by a process
# -p: specify process 7477
$ strace -p 7477

# Used to view system calls needed for a command
$ strace cat index.js

# Statistics about system calls
$ strace -p 7477 -c
Memory
free to view system memory.
If viewing process memory, use pidstat -r or htop
$ free -h
              total        used        free      shared  buff/cache   available
Mem:           3.7G        682M        398M        2.1M        2.6G        2.7G
Swap:            0B          0B          0B
process
Derivative problem
- How to find a process based on the command name
- How to find a process by parameter name
- What are the process states
- How to get process status
- How to get the CPU usage of a process
- How to get the memory usage of a process
# View 122 PID process
$ ps 122

# Find PID according to command
$ pgrep -a node
26464 node /code/node_modules/.bin/ts-node index.ts
30549 node server.js

# Find PID based on command name and parameters
$ pgrep -af ts-node
26464 node /code/node_modules/.bin/ts-node index.ts

# View 122 PID process information
$ cat /proc/122/status
$ cat /proc/122/*

# Print parent process tree
# -S -- show parents: Show parent processes
# -a --arguments: display parameters, such as hello in echo hello.
$ pstree 122 -sap
procfs
http://man7.org/linux/man-pages/man5/proc.5.html
Status of the process
- D uninterruptible sleep (usually IO)
- R running or runnable (on run queue)
- S interruptible sleep (waiting for an event to complete)
- T stopped by job control signal
- t stopped by debugger during the tracing
- W paging (not valid since the 2.6.xx kernel)
- X dead (should never be seen)
- Z defunct ("zombie") process, terminated but not reaped by its parent
Using htop/top, you can view the status information of all processes, especially in several cases.
- View too many zombie processes
- When the average load is too large
# The second line can count the status information of all processes.
$ top
...
Tasks: 214 total,   1 running, 210 sleeping,   0 stopped,   3 zombie
...
Process memory
ps -O rss specifies that rss can view the memory of the process. In addition, there are commands top/htop and pidstat -r
# View memory of 2579 PID
# -O rss print on behalf of additional RSS information
$ ps -O rss 2579
 PID   RSS S TTY          TIME COMMAND
 2579 19876 S pts/10   00:00:03 node index.js
View process memory in real time
pidstat -sr
# Check the memory information of 23097 PID and print it every second
# -r: view the memory information of the process
# -s: view the stack information of the process
# -p: specify PID
# 1: print once every 1s
# 5: Print 5 groups in total
$ pidstat -sr -p 23097 1 5
Linux 3.10.0-693.2.2.el7.x86_64 (shanyue)       07/18/19        _x86_64_        (2 CPU)

18:56:07      UID       PID  minflt/s  majflt/s     VSZ    RSS   %MEM StkSize  StkRef  Command
18:56:08        0     23097      0.00      0.00  366424  95996   2.47    136      80  node

18:56:08      UID       PID  minflt/s  majflt/s     VSZ    RSS   %MEM StkSize  StkRef  Command
18:56:09        0     23097      0.00      0.00  366424  95996   2.47    136      80  node

18:56:09      UID       PID  minflt/s  majflt/s     VSZ    RSS   %MEM StkSize  StkRef  Command
18:56:10        0     23097      0.00      0.00  366424  95996   2.47    136      80  node

18:56:10      UID       PID  minflt/s  majflt/s     VSZ    RSS   %MEM StkSize  StkRef  Command
18:56:11        0     23097      0.00      0.00  366424  95996   2.47    136      80  node

18:56:11      UID       PID  minflt/s  majflt/s     VSZ    RSS   %MEM StkSize  StkRef  Command
18:56:12        0     23097      0.00      0.00  366424  95996   2.47    136      80  node

Average:      UID       PID  minflt/s  majflt/s     VSZ    RSS   %MEM StkSize  StkRef  Command
Average:        0     23097      0.00      0.00  366424  95996   2.47    136      80  node
Page table and page missing exception
minflt and majflt in pidstat-s represent page missing exception
$ pidstat -s -p 23097 1 5
Linux 3.10.0-693.2.2.el7.x86_64 (shanyue)       07/18/19        _x86_64_        (2 CPU)

18:56:07      UID       PID  minflt/s  majflt/s     VSZ    RSS   %MEM StkSize  StkRef  Command
18:56:08        0     23097      0.00      0.00  366424  95996   2.47    136      80  node

18:56:08      UID       PID  minflt/s  majflt/s     VSZ    RSS   %MEM StkSize  StkRef  Command
18:56:09        0     23097      0.00      0.00  366424  95996   2.47    136      80  node
Standard output to file
List open files
lsof, list open files
# List open files
$ lsof
COMMAND     PID   TID     USER   FD      TYPE             DEVICE    SIZE/OFF       NODE NAME
systemd       1           root  cwd       DIR              253,1        4096          2 /
systemd       1           root  rtd       DIR              253,1        4096          2 /
Namespace PID - > Global PID mapping in container
Another problem is how to find out the corresponding pid of the docker container in the host
# Container environment

# The process PID in the container is known to be 122
# Find the corresponding PID information in the container, and include the host information in / proc/$pid/sched.
$ cat /proc/122/sched
node (7477, #threads: 7)
...
# Host environment

# 7477 is the corresponding global PID, which can be found in the host computer.
# -p for designated PID
# -f for printing more information
$ ps -fp 7477
UID        PID  PPID  C STIME TTY          TIME CMD
root      7477  7161  0 Jul10 ?        00:00:38 node index.js
Global PID - > namespace PID mapping
Another problem is how to find out the corresponding container when the PID of the host is known.
A common scenario is to use top/htop to locate a process that uses too much memory / CPU. At this time, you need to locate the container where it is located.
# Find the corresponding container through docker inspect ion
$ docker ps -q | xargs docker inspect --format '{{.State.Pid}}, {{.ID}}' | grep 22932

# Find the corresponding container through cgroupfs
$ cat /etc/22932/cgroup
Fortunately, someone has summed it up on stack overflow.
SWAP
# Find out about
$ vmstat -s
inode
# -i: print inode number
$ ls -lahi
network throughput
- Bandwidth: refers to the maximum transmission rate of the network link
- Throughput: represents the amount of data successfully transferred in unit time, in b/s (KB/s, MB/s)
- PPS: pck/s (Packet Per Second), transmission rate in network packets
# View network card information
$ ifconfig eth0

$ sar -n DEV 1 | grep eth0
#                IFACE   rxpck/s   txpck/s    rxkB/s    txkB/s   rxcmp/s   txcmp/s  rxmcst/s
16:34:37         eth0      8.00      2.00      0.69      1.90      0.00      0.00      0.00
16:34:38         eth0     39.00     27.00      2.91     38.11      0.00      0.00      0.00
16:34:39         eth0     13.00     11.00      0.92     13.97      0.00      0.00      0.00
16:34:40         eth0     16.00     16.00      1.21     20.86      0.00      0.00      0.00
16:34:41         eth0     17.00     17.00      1.51     15.27      0.00      0.00      0.00
Average:         eth0     18.60     14.60      1.45     18.02      0.00      0.00      0.00
socket status
socket information
It is recommended to use ss, but netstat still needs to be mastered. There may be no ss command in a specific condition (docker).
# -t TCP
# -a all States
# -n display digital address and port number
# -p display pid
$ netstat -tanp
Active Internet connections (servers and established)
Proto Recv-Q Send-Q Local Address           Foreign Address         State       PID/Program name
tcp        0      0 127.0.0.11:35283        0.0.0.0:*               LISTEN      -
tcp        0      0 192.168.112.2:37344     172.18.0.1:6379         ESTABLISHED 78/node
tcp        0      0 :::80                   :::*                    LISTEN      78/node
- When Recv-Q and Send-Q are not 0, it means that network packets are stacked. Please note that
Protocol information
# Show statistics for each protocol
$ netstat -s

# Show statistics for each protocol
$ ss -s
Total: 1468 (kernel 1480)
TCP:   613 (estab 270, closed 315, orphaned 0, synrecv 0, timewait 41/0), ports 0

Transport Total     IP        IPv6
*         1480      -         -
RAW       0         0         0
UDP       30        22        8
TCP       298       145       153
INET      328       167       161
FRAG      0         0         0

# You can also count the number of estab socket s in this way.
$ netstat -tanp | grep ESTAB | wc -l
Number of TCP connections
Maximum connections and current connections of PostgresSQL
-- maximum connection
show max_connections;

-- Current connections
select count(*) from pg_stat_activity;
The maximum number of mysql connections and the current number of connections
-- maximum connection
show variables like 'max_connections';

-- Current connections
show full processlist;