Preface:
The company has an asset statistics system, which is very low in usage, but requires fast query speed in use. Therefore, we want to make some caches stored in memory, not used for a long time, persistent to disk, and recycle garbage, return physical memory to the operating system, so as to save valuable resources to other businesses. System. When I do a good job of caching, I found a difficult problem. After releasing the resources through the program and notifying GC to recycle the resources, the memory used in the heap is reduced, the free memory is increased, but the memory occupied by the process is not reduced. I have consulted a lot of materials and tried many times, but I haven't solved the problem perfectly. It didn't dawn on me until I saw a comment about the G1 garbage collector.
Next, we will show you the difference between the two garbage collectors in returning physical memory through a small demo. If there is anything wrong, I hope you can correct it in the comments.
- Heap size configuration:
-Xms128M -Xmx2048M
First attach the test code:
import org.junit.Test;

import java.util.ArrayList;
import java.util.List;

public class MemoryRecycleTest {

    @Test
    public void testMemoryRecycle() throws InterruptedException {

        List list = new ArrayList();

        //Specify the size of the object to be produced to 512m
        int count = 512;

        //Create a new thread for production objects
        new Thread(() -> {
            try {
                for (int i = 1; i <= 10; i++) {
                    System.out.println(String.format("First%s Secondary production%s Objects of size", i, count));
                    addObject(list, count);
                    //Hibernation for 40 seconds
                    Thread.sleep(i * 10000);
                }
            } catch (InterruptedException e) {
                e.printStackTrace();
            }
        }).start();

        //Create a new thread that cleans the list and reclaims jvm memory
        new Thread(() -> {
            for (;;) {
                //When list memory reaches 512m, the gc reclaim heap is notified
                if (list.size() >= count) {
                    System.out.println("Clear list.... recovery jvm Memory....");
                    list.clear();
                    //Notify gc for recovery
                    System.gc();
                    //Print heap memory information
                    printJvmMemoryInfo();
                }
            }
        }).start();

        //Prevent program exit
        Thread.currentThread().join();
    }

    public void addObject(List list, int count) {
        for (int i = 0; i < count; i++) {
            OOMobject ooMobject = new OOMobject();
            //Add a 1m object to list
            list.add(ooMobject);
            try {
                //Hibernate for 100 milliseconds
                Thread.sleep(100);
            } catch (InterruptedException e) {
                e.printStackTrace();
            }
        }
    }

    public static class OOMobject{
        //Generate 1m objects
        private byte[] bytes=new byte[1024*1024];
    }

    public static void printJvmMemoryInfo() {
        // Virtual Machine Level Memory Query
        long vmFree = 0;
        long vmUse = 0;
        long vmTotal = 0;
        long vmMax = 0;
        int byteToMb = 1024 * 1024;
        Runtime rt = Runtime.getRuntime();
        vmTotal = rt.totalMemory() / byteToMb;
        vmFree = rt.freeMemory() / byteToMb;
        vmMax = rt.maxMemory() / byteToMb;
        vmUse = vmTotal - vmFree;
        System.out.println("");
        System.out.println("JVM The space used in memory is:" + vmUse + " MB");
        System.out.println("JVM The free space of memory is:" + vmFree + " MB");
        System.out.println("JVM The total memory space is:" + vmTotal + " MB");
        System.out.println("JVM The maximum heap space of total memory is:" + vmMax + " MB");
        System.out.println("");
    }

}
First, use the CMS garbage collector:
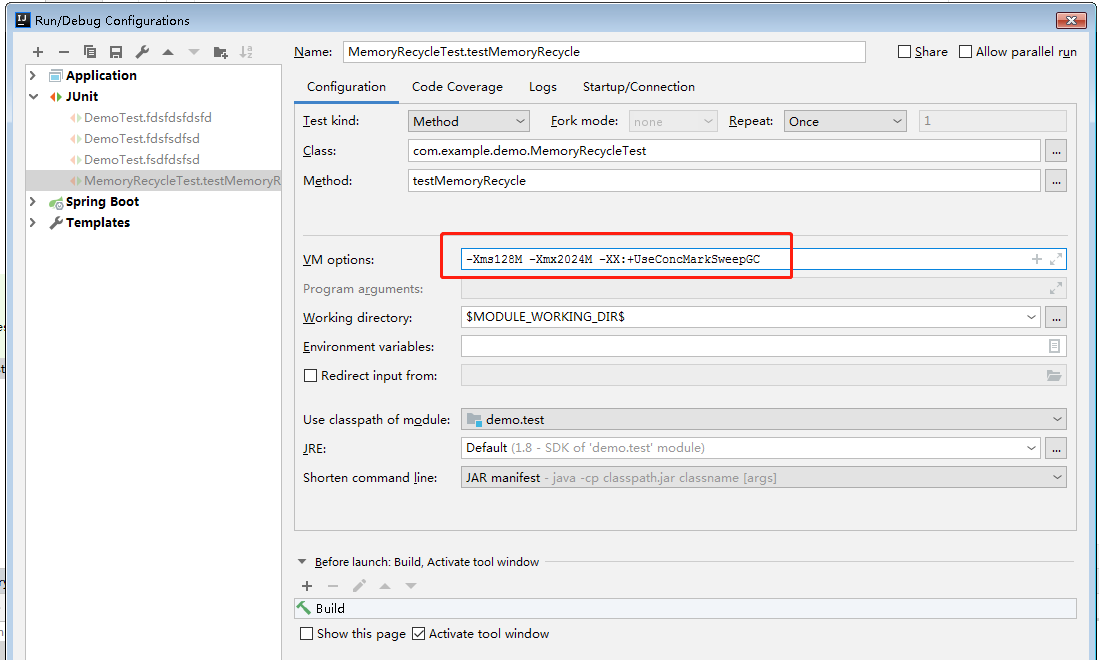
- Set the jvm running parameters as follows:
-Xms128M -Xmx2048M -XX:+UseConcMarkSweepGC
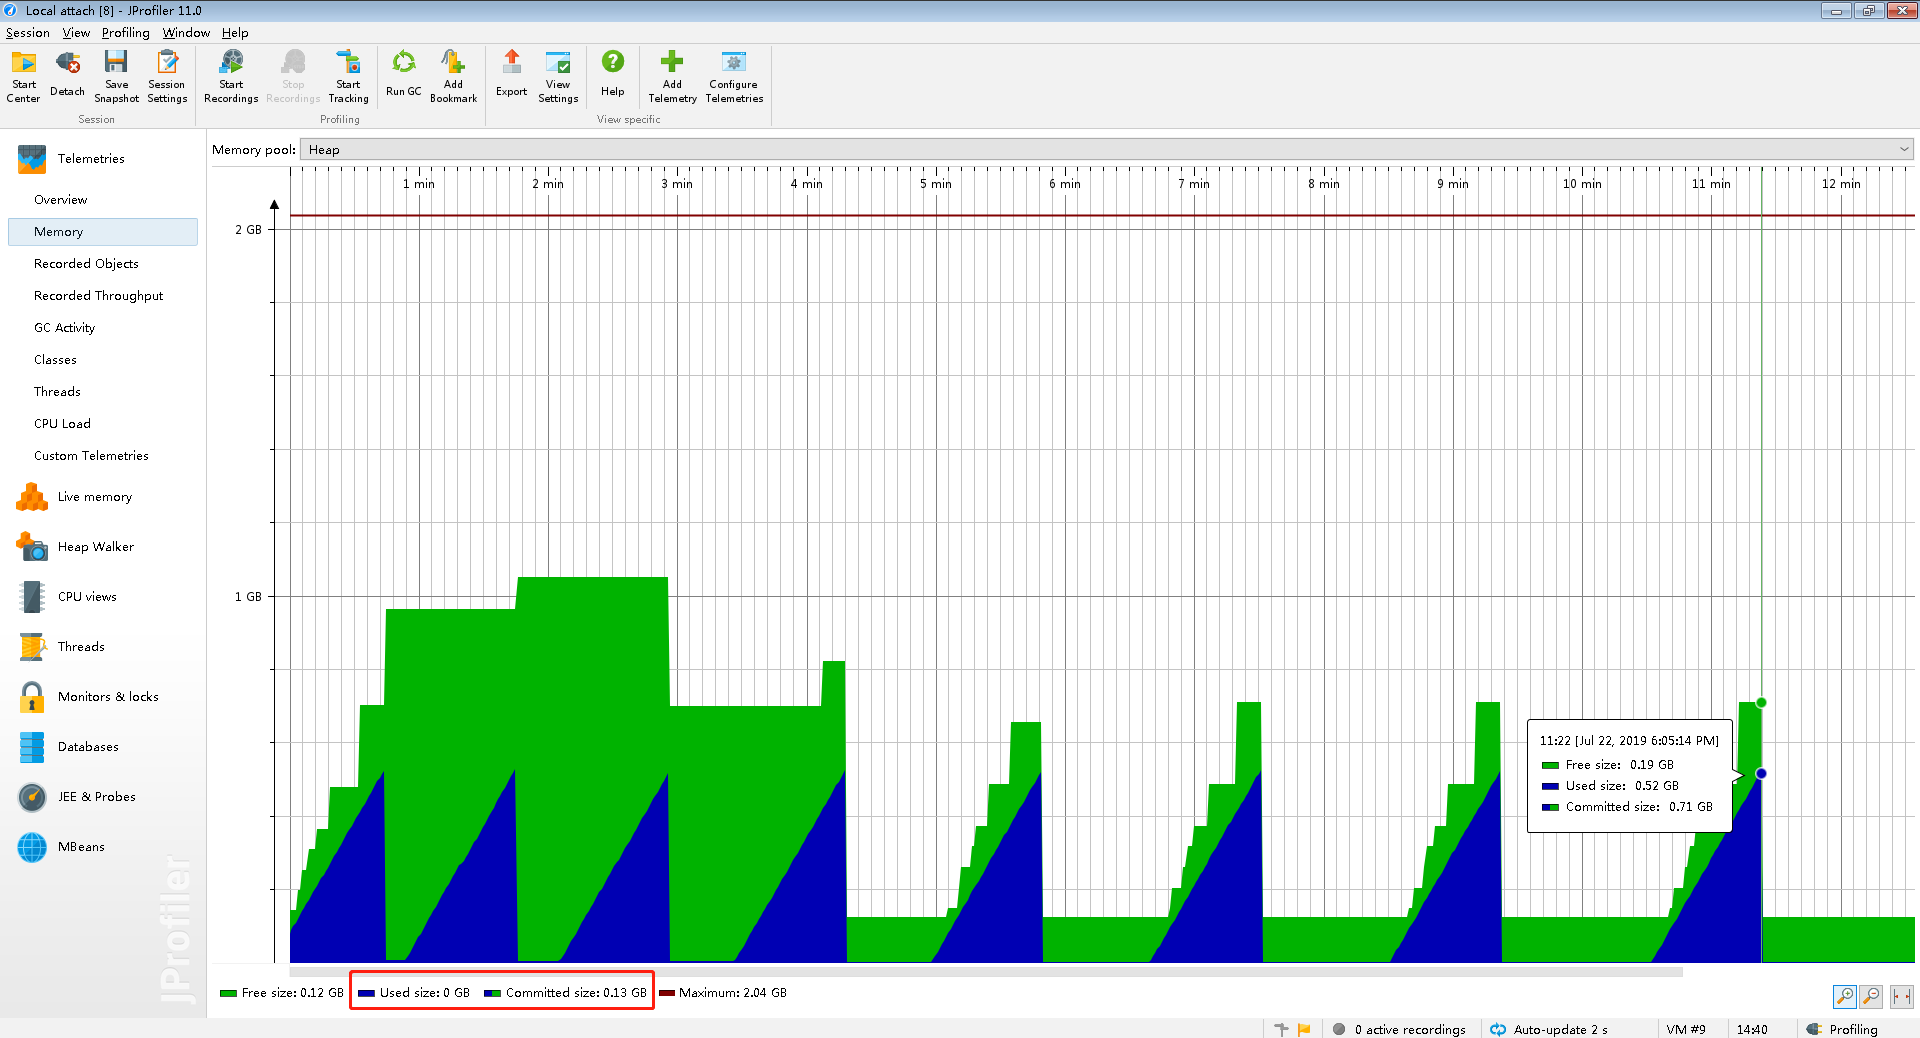
- After running the program, use JProfile to view heap memory:
- View what the console prints:
First production 512 size object
 Clean list.... Recycle jvm memory....

JVM memory used space is: 6 MB
 The free space of JVM memory is 936 MB
 The total memory space of JVM is 942 MB.
The maximum heap space of JVM total memory is: 1990 MB

Second production of 512 size objects
 Clean list.... Recycle jvm memory....

JVM memory used space is: 4 MB
 The free space of JVM memory is 1025 MB.
The total memory space of JVM is 1029 MB.
The maximum heap space of JVM total memory is: 1990 MB

Third production of 512 size objects
 Clean list.... Recycle jvm memory....

JVM memory used space is: 4 MB
 The free space of JVM memory is 680 MB
 The total memory space of JVM is 684 MB.
The maximum heap space of JVM total memory is: 1990 MB

Fourth production of 512 size objects
 Clean list.... Recycle jvm memory....

JVM memory used space is: 4 MB
 The free space of JVM memory is 119 MB
 The total memory space of JVM is 123 MB.
The maximum heap space of JVM total memory is: 1990 MB

Fifth production of 512 size objects
 Clean list.... Recycle jvm memory....

JVM memory used space is: 4 MB
 The free space of JVM memory is 119 MB
 The total memory space of JVM is 123 MB.
The maximum heap space of JVM total memory is: 1990 MB

Sixth production of 512 size objects
 Clean list.... Recycle jvm memory....

JVM memory used space is: 4 MB
 The free space of JVM memory is 119 MB
 The total memory space of JVM is 123 MB.
The maximum heap space of JVM total memory is: 1990 MB

Seventh production of 512 size objects
 Clean list.... Recycle jvm memory....

JVM memory used space is: 4 MB
 The free space of JVM memory is 119 MB
 The total memory space of JVM is 123 MB.
The maximum heap space of JVM total memory is: 1990 MB

Eighth production of 512 size objects
 Clean list.... Recycle jvm memory....

JVM memory used space is: 4 MB
 The free space of JVM memory is 119 MB
 The total memory space of JVM is 123 MB.
The maximum heap space of JVM total memory is: 1990 MB

Ninth production 512 size object
 Clean list.... Recycle jvm memory....

JVM memory used space is: 4 MB
 The free space of JVM memory is 119 MB
 The total memory space of JVM is 123 MB.
The maximum heap space of JVM total memory is: 1990 MB
- View jmap heap information:
C:\Users>jmap -heap 4716
Attaching to process ID 4716, please wait...
Debugger attached successfully.
Server compiler detected.
JVM version is 25.161-b12

using parallel threads in the new generation.
using thread-local object allocation.
Concurrent Mark-Sweep GC

Heap Configuration:
   MinHeapFreeRatio         = 40
   MaxHeapFreeRatio         = 70
   MaxHeapSize              = 2122317824 (2024.0MB)
   NewSize                  = 44695552 (42.625MB)
   MaxNewSize               = 348913664 (332.75MB)
   OldSize                  = 89522176 (85.375MB)
   NewRatio                 = 2
   SurvivorRatio            = 8
   MetaspaceSize            = 21807104 (20.796875MB)
   CompressedClassSpaceSize = 1073741824 (1024.0MB)
   MaxMetaspaceSize         = 17592186044415 MB
   G1HeapRegionSize         = 0 (0.0MB)

Heap Usage:
New Generation (Eden + 1 Survivor Space):
   capacity = 280887296 (267.875MB)
   used     = 1629392 (1.5539093017578125MB)
   free     = 279257904 (266.3210906982422MB)
   0.5800874668251284% used
Eden Space:
   capacity = 249692160 (238.125MB)
   used     = 1629392 (1.5539093017578125MB)
   free     = 248062768 (236.5710906982422MB)
   0.6525603366961942% used
From Space:
   capacity = 31195136 (29.75MB)
   used     = 0 (0.0MB)
   free     = 31195136 (29.75MB)
   0.0% used
To Space:
   capacity = 31195136 (29.75MB)
   used     = 0 (0.0MB)
   free     = 31195136 (29.75MB)
   0.0% used
concurrent mark-sweep generation:
   capacity = 624041984 (595.1328125MB)
   used     = 4169296 (3.9761505126953125MB)
   free     = 619872688 (591.1566619873047MB)
   0.6681114583470076% used

6718 interned Strings occupying 574968 bytes.
Through the statistical chart and console log, we can see that before running about 43 seconds, the memory used rises smoothly in a straight line and the opened memory rises stepwise. When the use of memory reaches 525 m, the program initiates System.gc(), at which time the garbage is recycled, so the use of memory returns to 10 m, but the memory space created by jvm is not returned to the operating system, resulting in the program occupying about 960 m of memory resources. The second production object, you can see that when running 53 seconds to 1:44 seconds, no new space is created, but the object is created by reusing the opened memory. When the second System.gc() is executed, jvm opens up a small amount of memory, this time the program occupies 1050m memory resources. The third production object, you can see that when running 2 minutes 05 seconds to 2 minutes 55 seconds, no new space is created, but reuse the opened memory to continue to create objects. When the third System.gc() is executed, jvm returns part of the memory to the operating system, which still occupies 700 meters of memory. From the general situation, we can see that as the number of System.gc() increases gradually and the time interval increases gradually, from continuing to open up memory to slowly returning memory to the operating system, until all the physical memory is returned to the operating system later.
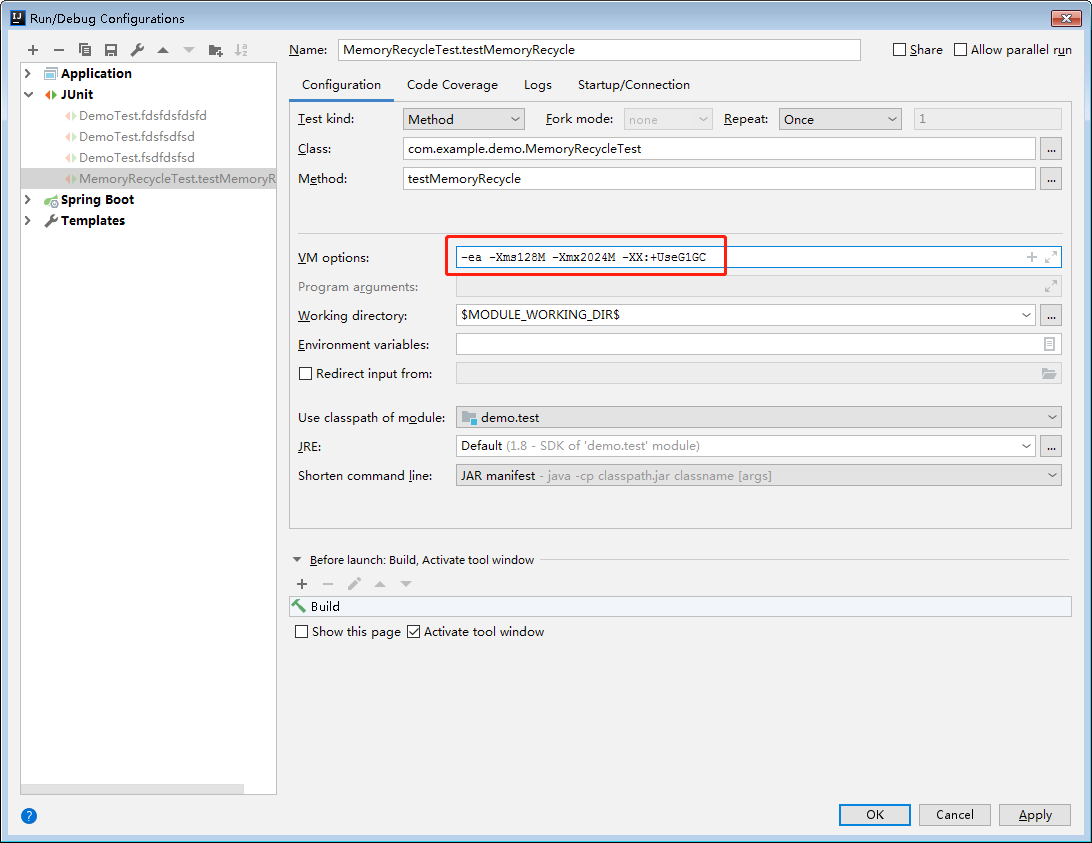
Next, use the G1 garbage collector:
-Xms128M -Xmx2048M -XX:+UseG1GC
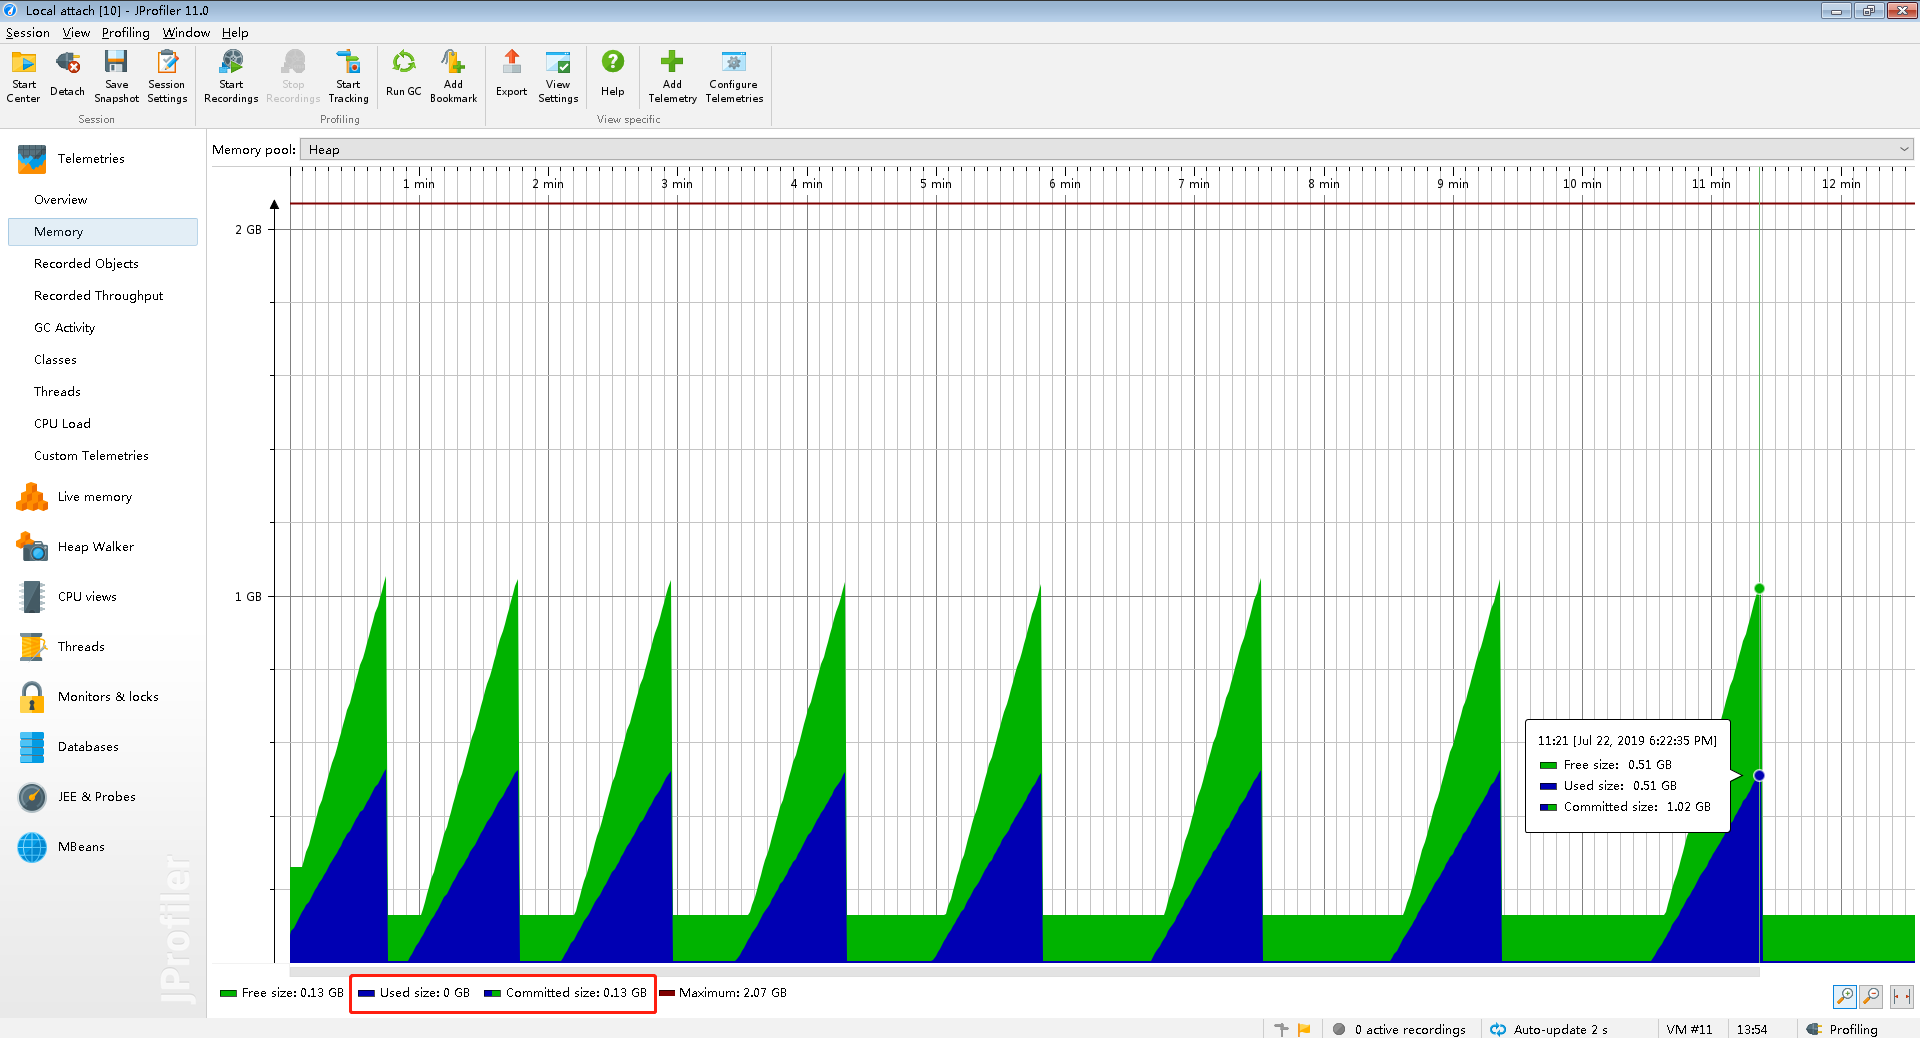
- After running the program, use JProfile to view heap memory:
- View what the console prints:
First production 512 size object
 Clean list.... Recycle jvm memory....

JVM memory used space is: 5 MB
 The free space of JVM memory is 123 MB.
The total memory space of JVM is 128 MB.
The maximum heap space of JVM total memory is 2024 MB

Second production of 512 size objects
 Clean list.... Recycle jvm memory....

JVM memory used space is: 4 MB
 The free space of JVM memory is 124 MB
 The total memory space of JVM is 128 MB.
The maximum heap space of JVM total memory is 2024 MB

Third production of 512 size objects
 Clean list.... Recycle jvm memory....

JVM memory used space is: 4 MB
 The free space of JVM memory is 124 MB
 The total memory space of JVM is 128 MB.
The maximum heap space of JVM total memory is 2024 MB

Fourth production of 512 size objects
 Clean list.... Recycle jvm memory....

JVM memory used space is: 4 MB
 The free space of JVM memory is 124 MB
 The total memory space of JVM is 128 MB.
The maximum heap space of JVM total memory is 2024 MB

Fifth production of 512 size objects
 Clean list.... Recycle jvm memory....

JVM memory used space is: 4 MB
 The free space of JVM memory is 124 MB
 The total memory space of JVM is 128 MB.
The maximum heap space of JVM total memory is 2024 MB

Sixth production of 512 size objects
 Clean list.... Recycle jvm memory....

JVM memory used space is: 4 MB
 The free space of JVM memory is 124 MB
 The total memory space of JVM is 128 MB.
The maximum heap space of JVM total memory is 2024 MB

Seventh production of 512 size objects
 Clean list.... Recycle jvm memory....

JVM memory used space is: 4 MB
 The free space of JVM memory is 124 MB
 The total memory space of JVM is 128 MB.
The maximum heap space of JVM total memory is 2024 MB

Eighth production of 512 size objects
 Clean list.... Recycle jvm memory....

JVM memory used space is: 4 MB
 The free space of JVM memory is 124 MB
 The total memory space of JVM is 128 MB.
The maximum heap space of JVM total memory is 2024 MB

Ninth production 512 size object
 Clean list.... Recycle jvm memory....

JVM memory used space is: 4 MB
 The free space of JVM memory is 124 MB
 The total memory space of JVM is 128 MB.
The maximum heap space of JVM total memory is 2024 MB
- View jmap heap information:
C:\Users>jmap -heap 18112
Attaching to process ID 18112, please wait...
Debugger attached successfully.
Server compiler detected.
JVM version is 25.161-b12

using thread-local object allocation.
Garbage-First (G1) GC with 4 thread(s)

Heap Configuration:
   MinHeapFreeRatio         = 40
   MaxHeapFreeRatio         = 70
   MaxHeapSize              = 2122317824 (2024.0MB)
   NewSize                  = 1363144 (1.2999954223632812MB)
   MaxNewSize               = 1272971264 (1214.0MB)
   OldSize                  = 5452592 (5.1999969482421875MB)
   NewRatio                 = 2
   SurvivorRatio            = 8
   MetaspaceSize            = 21807104 (20.796875MB)
   CompressedClassSpaceSize = 1073741824 (1024.0MB)
   MaxMetaspaceSize         = 17592186044415 MB
   G1HeapRegionSize         = 1048576 (1.0MB)

Heap Usage:
G1 Heap:
   regions  = 2024
   capacity = 2122317824 (2024.0MB)
   used     = 8336616 (7.950416564941406MB)
   free     = 2113981208 (2016.0495834350586MB)
   0.39280714253663074% used
G1 Young Generation:
Eden Space:
   regions  = 2
   capacity = 83886080 (80.0MB)
   used     = 2097152 (2.0MB)
   free     = 81788928 (78.0MB)
   2.5% used
Survivor Space:
   regions  = 0
   capacity = 0 (0.0MB)
   used     = 0 (0.0MB)
   free     = 0 (0.0MB)
   0.0% used
G1 Old Generation:
   regions  = 11
   capacity = 50331648 (48.0MB)
   used     = 6239464 (5.950416564941406MB)
   free     = 44092184 (42.049583435058594MB)
   12.396701176961264% used

6706 interned Strings occupying 573840 bytes.
Through the statistical chart and console log, we can see that before running about 41 seconds, the use of memory rises in a straight line smoothly, and the opened memory rises in a straight line smoothly. When using memory to reach 530m, the program initiated System.gc(), garbage was collected, so using memory back to 10m. At this point, we will find a magic phenomenon. The remaining memory space opened up before jvm is returned to the operating system, and the memory returns to the original jvm heap size of 128m we specified. By comparing production objects several times, it is found that jvm returns all physical memory without any reservation after every call to System.gc(). Has achieved the effect which I hoped!
Summary:
CMS garbage collector, after memory opening, will gradually increase with the number of System.gc() execution and recovery frequency gradually lengthen, from continue to open up memory to slowly return physical memory to the operating system, until a full return, will return all the remaining physical memory to the operating system every time the System.gc() is called. On the contrary, G1 actively returns physical memory to the operating system without any reservations after each garbage collection by JVM, which greatly reduces the memory footprint.
In addition, to view the real-time situation of the java stack, JProfile and Visual VM are recommended. If you recommend JProfiler locally, because it is powerful, but remote configuration is troublesome; if you are connected to a remote java process, you recommend Visual VM, which has enough functions and only need to configure some jvm parameters to connect to the remote.
Other notes
JDK 12 will have a G1 collector that returns memory to the operating system (without calling System.gc) "application idle time"
jdk9 adds this jvm parameter:

-XX:+ShrinkHeapInSteps
 Make the Java heap gradually shrink to the target size. This option is turned on by default, and the heap shrinks to the target size after several GC sessions. If this option is turned off, the Java heap will immediately shrink to the target size after GC. If you want to minimize the size of the Java heap, you can turn off the change option and match it with the following options:

-XX:MaxHeapFreeRatio=10 -XX:MinHeapFreeRatio=5

This will keep the Java heap space small and reduce the dynamic space occupied by the program, which is very useful for embedded applications, but for general applications, it may reduce performance.
Reference material:
http://www.imooc.com/wenda/detail/574044
https://developer.ibm.com/cn/blog/2017/still-paying-unused-memory-java-app-idle/
https://gameinstitute.qq.com/community/detail/118528
https://www.zhihu.com/question/30813753
https://www.zhihu.com/question/29161424