reference material: Silicon Valley JVM tutorial
22.JVM runtime parameters
22.1. JVM parameter options
Official website address: https://docs.oracle.com/javase/8/docs/technotes/tools/windows/java.html
22.1.1. Type I: standard parameter option
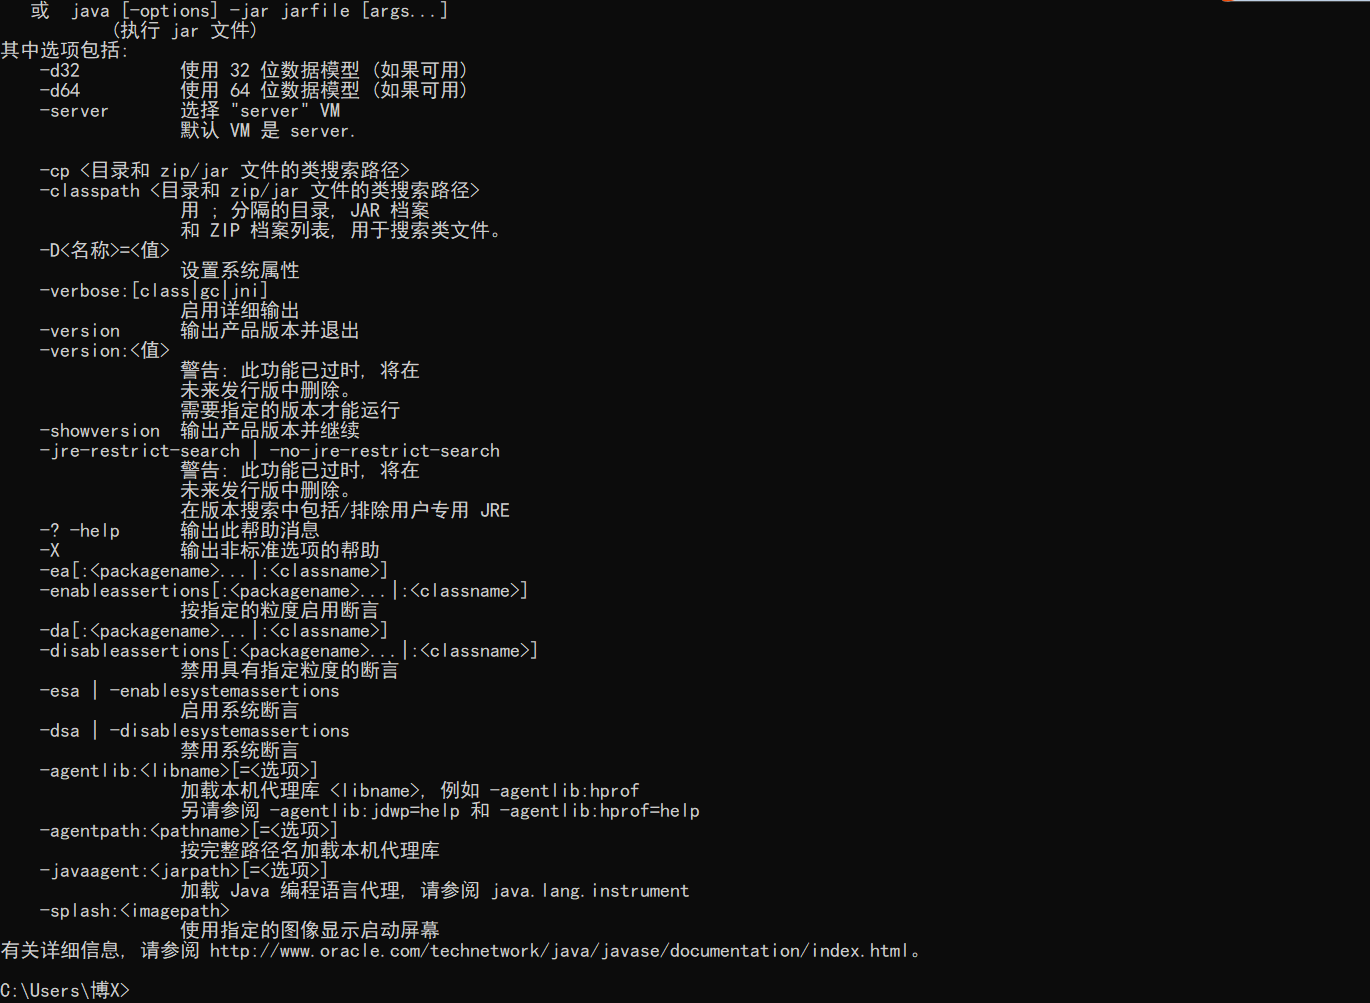
Server mode and Client mode
The Hotspot JVM has two modes, server and client, which are set through the - server and - client modes respectively
-
On 32-bit systems, the client type JVM is used by default. To use the Server mode, the machine is configured with at least 2 CPU s and more than 2G physical memory. The client mode is suitable for desktop applications that require less memory. By default, the Serial garbage collector is used
-
On 64 bit systems, only server mode JVM s are supported. It is suitable for applications requiring large memory. The parallel garbage collector is used by default
Official website address: https://docs.oracle.com/javase/8/docs/technotes/guides/vm/server-class.html
How do you know which mode the system uses by default?
Through the java -version command, you can see the word Server VM, which means that the current system uses the Server mode

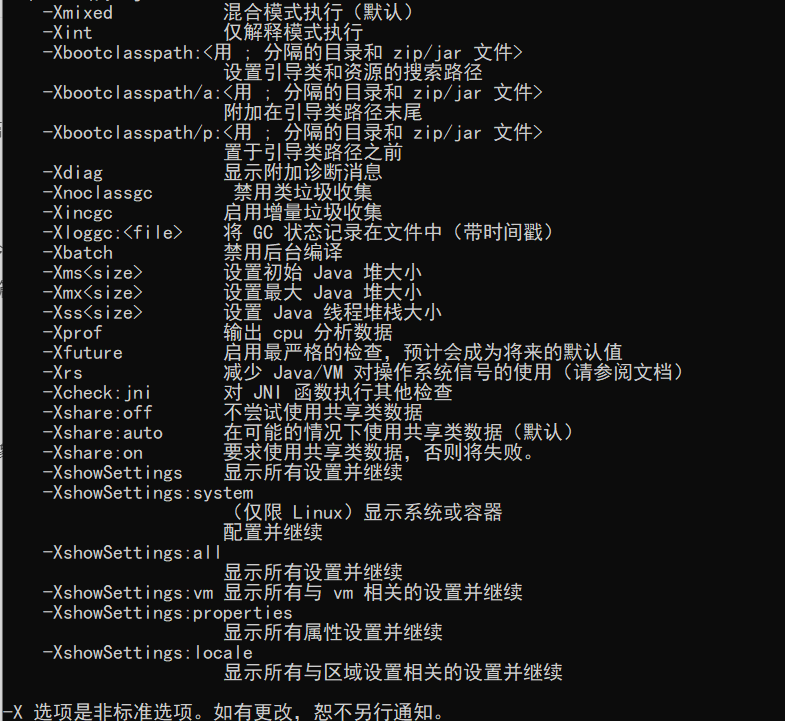
22.1.2. Type II: - X parameter option
22.1.3. Type III: - XX parameter option
Boolean type format
-XX:+<option>  Enable option attribute
-XX:-<option>  Disable option attribute
Non Boolean format
-XX:<option>=<number>  set up option Numerical value, with units, such as k/K/m/M/g/G
-XX:<option>=<string>  set up option Character value
22.2. Add JVM parameter option
Needless to say, configurations in eclipse and idea can be configured in Run Configurations and VM Options, which are similar
Run the jar package
java -Xms100m -Xmx100m -XX:+PrintGCDetails -XX:+PrintGCDateStamps -XX:+PrintGCTimeStamps -jar demo.jar
Tomcat runs the war package
# Adding catalina.sh under linux
JAVA_OPTS="-Xms512M -Xmx1024M"
# Adding catalina.bat under windows
set "JAVA_OPTS=-Xms512M -Xmx1024M"
Program running
# Set Boolean type parameters
jinfo -flag [+|-]<name> <pid>
# Set non Boolean type parameters
jinfo -flag <name>=<value> <pid>
22.3. Common JVM parameter options
22.3.1. XX option and value of print setting
-XX:+PrintCommandLineFlags Program runtime JVM Default or manually set by the user XX option
-XX:+PrintFlagsInitial Print all XX Default values for options
-XX:+PrintFlagsFinal Print all XX Actual value of option
-XX:+PrintVMOptions Print JVM Parameters of
22.3.2. Heap, stack, method area and other memory size settings
# Stack
-Xss128k <==> -XX:ThreadStackSize=128k Set the size of the thread stack to 128 K

# heap
-Xms2048m <==> -XX:InitialHeapSize=2048m set up JVM The initial heap memory is 2048 M
-Xmx2048m <==> -XX:MaxHeapSize=2048m set up JVM The maximum heap memory is 2048 M
-Xmn2g <==> -XX:NewSize=2g -XX:MaxNewSize=2g Set the younger generation size to 2 G
-XX:SurvivorRatio=8 set up Eden District and Survivor The ratio of the area is 8 by default
-XX:NewRatio=2 Set the ratio of the old generation to the young generation. The default value is 2
-XX:+UseAdaptiveSizePolicy Set size scale adaptation, on by default
-XX:PretenureSizeThreadshold=1024 Set to allow objects greater than this threshold to be allocated directly to the elderly generation, only for Serial,ParNew Collector valid
-XX:MaxTenuringThreshold=15 Set the age limit for the promotion of the new generation to the old age. The default is 15
-XX:TargetSurvivorRatio set up MinorGC After the end Survivor Expected proportion of occupied space

# Method area
-XX:MetaspaceSize / -XX:PermSize=256m Set meta space/The initial value of permanent generation is 256 M
-XX:MaxMetaspaceSize / -XX:MaxPermSize=256m Set meta space/The maximum value of permanent generation is 256 M
-XX:+UseCompressedOops Using compressed objects
-XX:+UseCompressedClassPointers Using compressed class pointers
-XX:CompressedClassSpaceSize set up Klass Metaspace The default size is 1 G

# Direct memory
-XX:MaxDirectMemorySize appoint DirectMemory Capacity, default equal to Java Heap maximum
22.3.3. OutOfMemory related options
-XX:+HeapDumpOnOutMemoryError Memory present OOM Time generation Heap Dump file, mutually exclusive
-XX:+HeapDumpBeforeFullGC appear FullGC Time generation Heap Dump file, mutually exclusive
-XX:HeapDumpPath=<path> appoint heap The storage path of the dump file. The default is the current directory
-XX:OnOutOfMemoryError=<path> Specify the path of the feasibility program or script when OOM Execute script when
22.3.4. Garbage collector related options
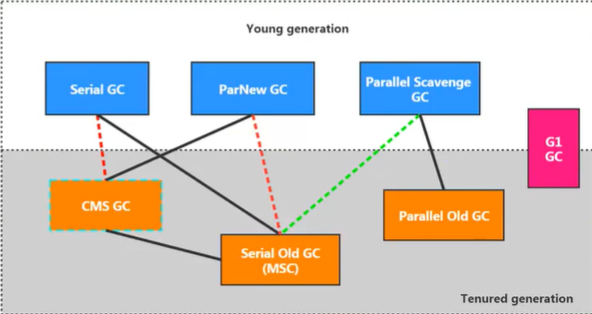
First, you need to understand the collocation relationship between garbage collectors
-
The red dotted line indicates that it is deprecated at jdk8 and deleted at jdk9
-
The green dotted line indicates that it is deprecated at jdk14
-
The green dashed box indicates that it is deprecated at jdk9 and deleted at jdk14
# Serial collector
-XX:+UseSerialGC  Young generation use Serial GC, Used in old age Serial Old GC
# ParNew recycler
-XX:+UseParNewGC  Young generation use ParNew GC
-XX:ParallelGCThreads  Sets the number of threads for the younger generation Parallel collector.
	In general, it is best to CPU Equal number to avoid excessive number of threads affecting garbage collection performance.

# Parallel collector
-XX:+UseParallelGC  Young generation use Parallel Scavenge GC,Mutual activation
-XX:+UseParallelOldGC  Used in old age Parallel Old GC,Mutual activation
-XX:ParallelGCThreads
-XX:MaxGCPauseMillis  Set the maximum garbage collector pause time (i.e STW Time in milliseconds.
	In order to control the pause time as much as possible MaxGCPauseMills Within, the collector will adjust during operation Java Heap size or some other parameters.
	For users, the shorter the pause time, the better the experience; However, the server side pays attention to high concurrency and overall throughput.
	So the server side is suitable for Parallel,Control. Use this parameter with caution.
-XX:GCTimeRatio  Proportion of garbage collection time in total time (1) / (N+1)),Used to measure throughput
	Value range (0),100),The default value is 99, that is, the garbage collection time does not exceed 1%.
	Same as previous-XX: MaxGCPauseMillis The parameters are contradictory. The longer the pause time is, Radio The parameter is easy to exceed the set proportion.
-XX:+UseAdaptiveSizePolicy  set up Parallel Scavenge The collector has an adaptive adjustment strategy.
	In this model, the size of the younger generation Eden and Survivor Parameters such as the proportion of objects, the age of objects promoted to the old age, etc. are automatically adjusted to achieve a balance between heap size, throughput and pause time.
	When manual tuning is difficult, you can directly use this adaptive method to specify only the maximum heap and target throughput of the virtual machine( GCTimeRatio)And pause time( MaxGCPauseMills),Let the virtual machine do the tuning by itself.


# CMS Reclaimer
-XX:+UseConcMarkSweepGC  Young generation use CMS GC.
	When this parameter is turned on, the-XX: +UseParNewGC Open. That is: ParNew(Young Area)+ CMS(Old Area)+ Serial Old Combination of
-XX:CMSInitiatingOccupanyFraction  Set the threshold for heap memory usage, and once the threshold is reached, recycling begins. JDK5 And previous versions, the default value is 68, DK6 The default value for versions and above is 92%.
	If the memory growth is slow, you can set a slightly larger value, and a larger threshold can be effectively reduced CMS The trigger frequency and reducing the number of recycling in the old age can significantly improve the performance of the application.
	Conversely, if application memory usage is growing rapidly, this threshold should be lowered to avoid frequent triggering of old age serial collectors.
	Therefore, this option can effectively reduce Fu1l GC Number of executions.
-XX:+UseCMSInitiatingOccupancyOnly  Is it dynamically adjustable so that CMS Keep pressing CMSInitiatingOccupancyFraction Start with the set value
-XX:+UseCMSCompactAtFullCollection  Used to specify after execution Full GC After that, the memory space is compressed
	In order to avoid memory fragmentation, however, because the memory compression and defragmentation process cannot be executed concurrently, the problem is that the pause time becomes longer.
-XX:CMSFullGCsBeforeCompaction  Set how many times to execute Full GC After that, the memory space is compressed.
-XX:ParallelCMSThreads  set up CMS Number of threads.
	CMS The default number of threads to start is(ParallelGCThreads+3)/4,ParallelGCThreads Is the number of threads of the younger generation Parallel collector.
	When CPU When resources are tight, they are affected CMS Due to the impact of collector threads, application performance can be very poor in the garbage collection phase.
-XX:ConcGCThreads  Set the number of threads for concurrent garbage collection. The default value is based on ParallelGCThreads Calculated
-XX:+CMSScavengeBeforeRemark  force hotspot stay cms remark Do it once before the stage minor gc,Used to improve remark Phase speed
-XX:+CMSClassUnloadingEnable  Enable recycling, if any Perm District( JDK8 (before)
-XX:+CMSParallelInitialEnabled  For opening CMS initial-mark The phase is marked by multithreading
	Used to improve marking speed, in Java8 Start has been turned on by default
-XX:+CMSParallelRemarkEnabled  User on CMS remark The phase is re marked in a multi-threaded manner and is enabled by default
-XX:+ExplicitGCInvokesConcurrent
-XX:+ExplicitGCInvokesConcurrentAndUnloadsClasses
	These two parameters are user specified hotspot Virtual execution System.gc()When using CMS cycle
-XX:+CMSPrecleaningEnabled  appoint CMS Is it necessary Pre cleaning stage

# G1 Reclaimer
-XX:+UseG1GC Manually specify use G1 The collector performs a memory reclamation task.
-XX:G1HeapRegionSize Set each Region The size of the.
	The value is a power of 2 and the range is 1 MB To 32 MB Between, the goal is based on the smallest Java The heap size is divided into about 2048 areas. The default is 1% of the heap memory/2000.
-XX:MaxGCPauseMillis  Set the maximum expected GC Pause time index( JVM We will try our best to achieve it, but we are not guaranteed to achieve it). The default value is 200 ms
-XX:ParallelGCThread  set up STW Time GC Value for the number of threads. Up to 8
-XX:ConcGCThreads  Sets the number of threads marked for concurrency. take n Set to the number of parallel garbage collection threads( ParallelGCThreads)Of 1/4 about.
-XX:InitiatingHeapOccupancyPercent Set trigger concurrency GC Periodic Java Heap occupancy threshold. Triggered when this value is exceeded GC. The default value is 45.
-XX:G1NewSizePercent  Minimum percentage of the entire heap memory occupied by the new generation (default 5%)
-XX:G1MaxNewSizePercent  The maximum percentage of the entire heap memory occupied by the new generation (60 by default)%)
-XX:G1ReservePercent=10  Reserve memory area to prevent to space(Survivor Medium to Overflow
How to choose a garbage collector?
-
Give priority to the JVM to adapt and adjust the heap size
-
Serial collector: the memory is less than 100M; single core and single program, and there is no pause time requirement
-
Parallel collector: multi CPU, high throughput, allowed pause time of more than 1 second
-
Concurrent collector: multi CPU, low pause time and fast response (for example, the delay cannot exceed 1 second, such as Internet Applications)
-
G1 is officially recommended with high performance. At present, most Internet projects use G1
Special note:
-
There is no best collector, and there is no universal collector
-
Tuning is always aimed at specific scenarios and specific requirements, and there is no collector once and for all
22.3.5. GC log related options
-XX:+PrintGC <==> -verbose:gc  Print brief log information
-XX:+PrintGCDetails            Print detailed log information
-XX:+PrintGCTimeStamps  Print program started to GC Time of occurrence, collocation-XX:+PrintGCDetails use
-XX:+PrintGCDateStamps  Print GC Timestamp at occurrence, matching-XX:+PrintGCDetails use
-XX:+PrintHeapAtGC  Print GC Heap information before and after, as shown in the following figure
-Xloggc:<file> output GC Export to the file under the specified path

-XX:+TraceClassLoading  Monitoring class loading
-XX:+PrintGCApplicationStoppedTime  Print GC Pause time of thread at
-XX:+PrintGCApplicationConcurrentTime  Print the uninterrupted execution time of the application before garbage collection
-XX:+PrintReferenceGC Print how many references of different reference types are recycled
-XX:+PrintTenuringDistribution  Print JVM Every time MinorGC Current used after Survivor Age distribution of objects in
-XX:+UseGCLogFileRotation Enable GC Automatic dump of log files
-XX:NumberOfGCLogFiles=1  set up GC Number of cycles in the log file
-XX:GCLogFileSize=1M  set up GC Log file size
22.3.6. Other parameters
-XX:+DisableExplicitGC  Disable hotspot implement System.gc(),Disabled by default
-XX:ReservedCodeCacheSize=<n>[g|m|k],-XX:InitialCodeCacheSize=<n>[g|m|k]  Specifies the size of the code cache
-XX:+UseCodeCacheFlushing  Discard some compiled code to avoid when the code cache is full JVM Switch to interpreted-only Situation
-XX:+DoEscapeAnalysis  Open escape analysis
-XX:+UseBiasedLocking  Open deflection lock
-XX:+UseLargePages  Open use large page
-XX:+PrintTLAB  Print TLAB Usage of
-XX:TLABSize  set up TLAB size
22.4. Get JVM parameters through Java code
Java provides the java.lang.management package, which is used to monitor and manage Java virtual machines and other components in the Java Runtime. It allows local or remote monitoring and management of running Java virtual machines. The ManagementFactory class is commonly used. In addition, the Runtime class can obtain data related to memory, CPU core, etc. by using these APIs, you can monitor the heap memory usage of the application server In case, set some thresholds for alarm and other processing.
public class MemoryMonitor {
    public static void main(String[] args) {
        MemoryMXBean memorymbean = ManagementFactory.getMemoryMXBean();
        MemoryUsage usage = memorymbean.getHeapMemoryUsage();
        System.out.println("INIT HEAP: " + usage.getInit() / 1024 / 1024 + "m");
        System.out.println("MAX HEAP: " + usage.getMax() / 1024 / 1024 + "m");
        System.out.println("USE HEAP: " + usage.getUsed() / 1024 / 1024 + "m");
        System.out.println("\nFull Information:");
        System.out.println("Heap Memory Usage: " + memorymbean.getHeapMemoryUsage());
        System.out.println("Non-Heap Memory Usage: " + memorymbean.getNonHeapMemoryUsage());

        System.out.println("=======================adopt java To get the relevant system status============================ ");
        System.out.println("Current heap memory size totalMemory " + (int) Runtime.getRuntime().totalMemory() / 1024 / 1024 + "m");// Current heap memory size
        System.out.println("Free heap memory size freeMemory " + (int) Runtime.getRuntime().freeMemory() / 1024 / 1024 + "m");// Free heap memory size
        System.out.println("Maximum available total heap memory maxMemory " + Runtime.getRuntime().maxMemory() / 1024 / 1024 + "m");// Maximum available total heap memory size

    }
}