Summary of Common JVM Commands:
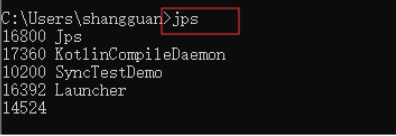
jps:
View process ID s for each application

Jmap:
View memory information, number of instances, and memory footprint
Jmap-heap 10200 (process ID)
View heap information

Jmap-dump:format=b, file=dump.hprof 10200 (process ID)
Manual dump of heap memory information

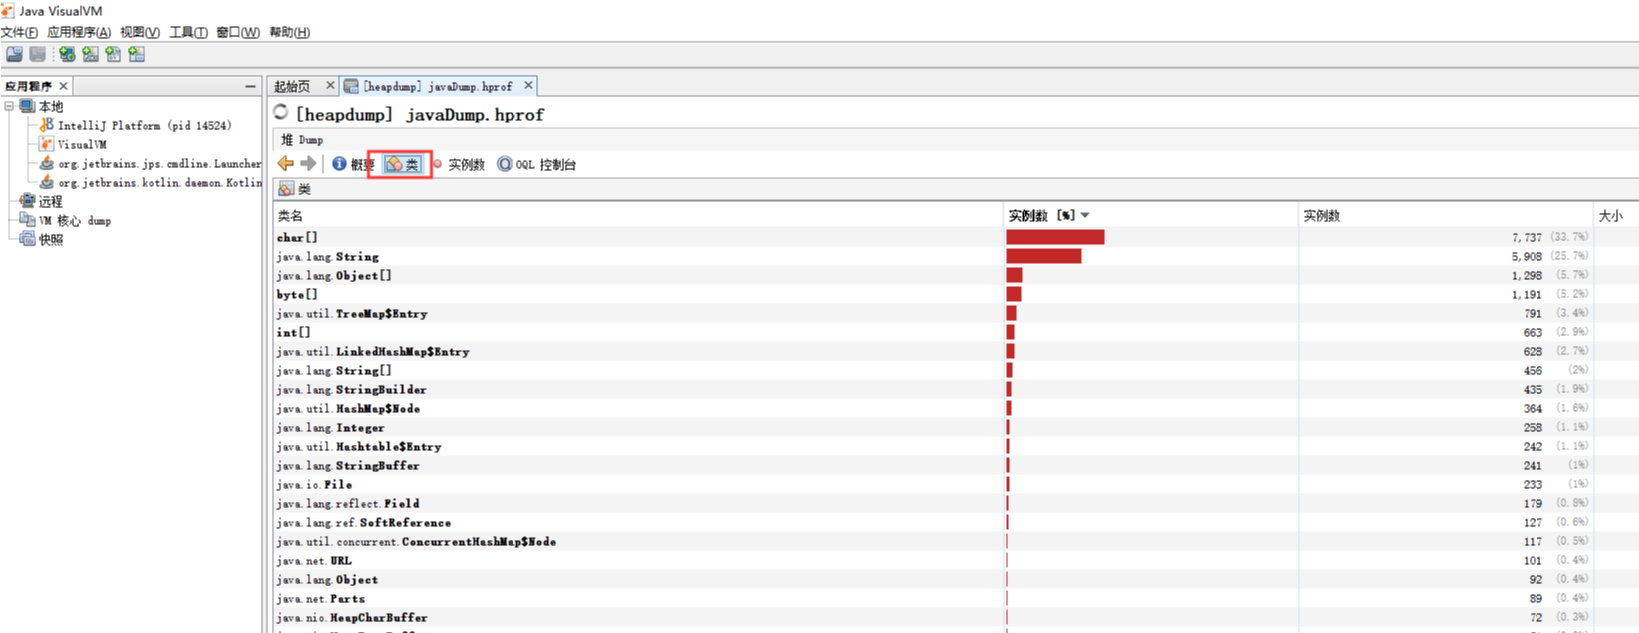
jvisualvm:
Launch jvisualvm to view heap information using the JvisualVM tool
Start jvisualvm

Load dump file

See


Print dump stack automatically when memory overflows
‐XX:+PrintGCDetails -XX:+HeapDumpOnOutOfMemoryError -XX:HeapDumpPath=D:\heapDump.dump
Sample code:
JVM Settings: -Xms10M-Xmx10M-XX:+PrintGCDetails-XX:+HeapDumpOnOutOfMemoryError-XX:HeapDumpPath=D:\heapDump.dump
import java.util.ArrayList;
import java.util.List;

public class TestAutoDump {

    public static void main(String args[]) {
        List<byte[]> lists = new ArrayList<>();
        while(true) {
            byte[] bytes = new byte[1000*1024];
            lists.add(bytes);
        }
    }

}
// The results are as follows:
[GC (Allocation Failure) [PSYoungGen: 1734K->488K(2560K)] 1734K->740K(9728K), 0.0007782 secs] [Times: user=0.00 sys=0.00, real=0.00 secs]
[GC (Allocation Failure) [PSYoungGen: 1548K->504K(2560K)] 1800K->1780K(9728K), 0.0008307 secs] [Times: user=0.00 sys=0.00, real=0.00 secs]
[GC (Allocation Failure) [PSYoungGen: 2541K->488K(2560K)] 3817K->3780K(9728K), 0.0009803 secs] [Times: user=0.00 sys=0.00, real=0.00 secs]
[GC (Allocation Failure) [PSYoungGen: 2534K->504K(2560K)] 5826K->5804K(9728K), 0.0006492 secs] [Times: user=0.00 sys=0.00, real=0.00 secs]
[Full GC (Ergonomics) [PSYoungGen: 504K->0K(2560K)] [ParOldGen: 5300K->5601K(7168K)] 5804K->5601K(9728K), [Metaspace: 3200K->3200K(1056768K)], 0.0045009 secs] [Times: user=0.16 sys=0.00, real=0.01 secs]
[Full GC (Ergonomics) [PSYoungGen: 2044K->1000K(2560K)] [ParOldGen: 5601K->6601K(7168K)] 7645K->7601K(9728K), [Metaspace: 3202K->3202K(1056768K)], 0.0047187 secs] [Times: user=0.00 sys=0.00, real=0.01 secs]
[Full GC (Ergonomics) [PSYoungGen: 2006K->2000K(2560K)] [ParOldGen: 6601K->6597K(7168K)] 8607K->8597K(9728K), [Metaspace: 3209K->3209K(1056768K)], 0.0050641 secs] [Times: user=0.00 sys=0.00, real=0.00 secs]
[Full GC (Allocation Failure) [PSYoungGen: 2000K->2000K(2560K)] [ParOldGen: 6597K->6579K(7168K)] 8597K->8579K(9728K), [Metaspace: 3209K->3209K(1056768K)], 0.0049375 secs] [Times: user=0.00 sys=0.00, real=0.00 secs]
java.lang.OutOfMemoryError: Java heap space
Dumping heap to D:\heapDump.dump ...
Heap dump file created [9656073 bytes in 0.018 secs]
Exception in thread "main" java.lang.OutOfMemoryError: Java heap space
	at TestAutoDump.main(TestAutoDump.java:9)
[Full GC (Ergonomics) [PSYoungGen: 2048K->0K(2560K)] [ParOldGen: 6619K->602K(7168K)] 8667K->602K(9728K), [Metaspace: 3240K->3240K(1056768K)], 0.0045889 secs] [Times: user=0.02 sys=0.02, real=0.02 secs]
Heap
 PSYoungGen      total 2560K, used 20K [0x00000000ffd00000, 0x0000000100000000, 0x0000000100000000)
  eden space 2048K, 1% used [0x00000000ffd00000,0x00000000ffd05228,0x00000000fff00000)
  from space 512K, 0% used [0x00000000fff80000,0x00000000fff80000,0x0000000100000000)
  to   space 512K, 0% used [0x00000000fff00000,0x00000000fff00000,0x00000000fff80000)
 ParOldGen       total 7168K, used 602K [0x00000000ff600000, 0x00000000ffd00000, 0x00000000ffd00000)
  object space 7168K, 8% used [0x00000000ff600000,0x00000000ff696b30,0x00000000ffd00000)
 Metaspace       used 3246K, capacity 4496K, committed 4864K, reserved 1056768K
  class space    used 353K, capacity 388K, committed 512K, reserved 1048576K
Jstack:
Used to find deadlocks
// The sample code is as follows:
public class DeadLockTest {

    public static void main(String args[]) {

        new Thread(new Runnable() {
            @Override
            public void run() {
                synchronized(A.class) {
                    try {
                        Thread.sleep(5000);
                    } catch (InterruptedException e) {
                        e.printStackTrace();
                    }
                    synchronized (B.class) {

                    }
                }

            }
        }).start();

        new Thread(new Runnable() {
            @Override
            public void run() {
                synchronized(B.class) {
                    try {
                        Thread.sleep(5000);
                    } catch (InterruptedException e) {
                        e.printStackTrace();
                    }
                    synchronized (A.class) {

                    }
                }
            }
        }).start();

    }

}
class A {}
class B {}
The jstack run result log is as follows:jstack 14452

2019-11-09 13:08:54
Full thread dump Java HotSpot(TM) 64-Bit Server VM (25.201-b09 mixed mode):

"DestroyJavaVM" #14 prio=5 os_prio=0 tid=0x0000000000f6e800 nid=0x17c8 waiting on condition [0x0000000000000000]
   java.lang.Thread.State: RUNNABLE

"Thread-1" #13 prio=5 os_prio=0 tid=0x000000001e982800 nid=0x3cd4 waiting for monitor entry [0x000000002062f000]
   java.lang.Thread.State: BLOCKED (on object monitor)
        at DeadLockTest$2.run(DeadLockTest.java:33)
        - waiting to lock <0x000000076b423028> (a java.lang.Class for A)
        - locked <0x000000076b6b2778> (a java.lang.Class for B)
        at java.lang.Thread.run(Thread.java:748)

"Thread-0" #12 prio=5 os_prio=0 tid=0x000000001e971800 nid=0x45bc waiting for monitor entry [0x000000002052f000]
   java.lang.Thread.State: BLOCKED (on object monitor)
        at DeadLockTest$1.run(DeadLockTest.java:16)
        - waiting to lock <0x000000076b6b2778> (a java.lang.Class for B)
        - locked <0x000000076b423028> (a java.lang.Class for A)
        at java.lang.Thread.run(Thread.java:748)
......
If the program is running locally, we can use jvisualvm to automatically detect deadlocks
Use the command jvisualvm to open the tool while the program is running


jstack finds stack information that consumes the highest CPU
Display java's memory using the command top-p 14552 (java process ID)
Press H to get the memory condition of each thread and find the thread tid with the highest CPU usage
Convert to hexadecimal to 0x1371, which is the hexadecimal representation of the thread id
Execute jstack 4977|grep-A 10 1371 to get the last 10 rows of thread 1371 in the thread stack information
Look at the stack information to find out what might be wrong with the code
Jinfo
View extended parameters for a running java application
Jstat
The jstat command can see how much heap memory is being used and how many classes are being loaded.
The format of the command is as follows: jstat [-Command Options] [vmid] [Interval (milliseconds)] [Number of queries]
Jstat-gc PID is most commonly used to assess program memory usage and overall GC pressure
S0C: Size of the first survivor zone
S1C: Size of the second survival zone
S0U: usage size of first survivor
S1U: Usage size of second survivor
EC: Size of Eden Park
EU: Size of use of Eden Park
OC: Older generation size
OU: Older generation usage size
MC: Method area size (metaspace)
MU: Method Area Usage Size
CCSC: Compressed class space size
CCSU: Compressed class space usage size
YGC: Junior generation garbage collection times
YGCT: Younger generation waste collection time, units s
FGC: Older generation garbage collection times
FGCT: Older generation waste collection consumption time, units
sGCT: Total garbage collection time in s
You can continuously observe the trends in various parts of memory, as well as the frequencies of Young GC and Full GC, and determine the rationality of memory size for each area (Eden, S0,S1, and Old) in the heap.
Continuous Watch Command Example:
jstat -gc 10200 1000 100
Watch each region of thread 10200 for memory changes and GC conditions, print one log per second, print 100 times

The idea of optimization is simply to try to keep the survivors of each Young GC smaller than 50% of the Survivor region in the younger generation.Try not to let people get older.Minimize the frequency of Full GC and avoid the impact of frequent Full GC on JVM performance
Memory leak:
Refers to an object that is no longer in use but still takes up space in memory and the garbage collection mechanism is unable to reclaim that memory space
How to analyze GC logs:
Getting GC logs:
Application configuration automatically dumps GC information: XX:+PrintGCDetails XX:+PrintGCTimeStamps XX:+PrintGCDateStamps Xloggc:./gc.log
GC Log Online Analysis Tool https://gceasy.io/
Analyzing GC logs for free and viewing tuning plan fees

The analysis results are as follows:

