1, jps (Java Process status) view the running java process
Start the following procedure:
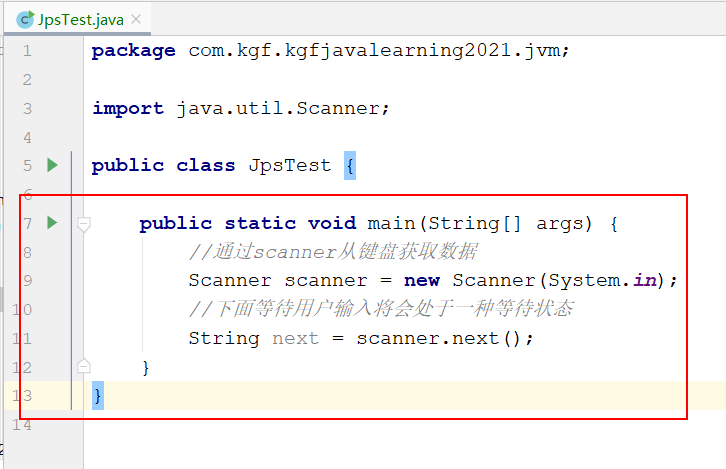
Parameters:
-
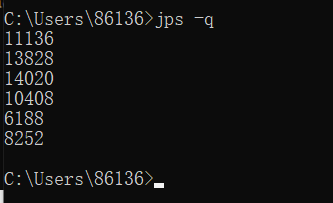
-q: Show ID ONLY
-
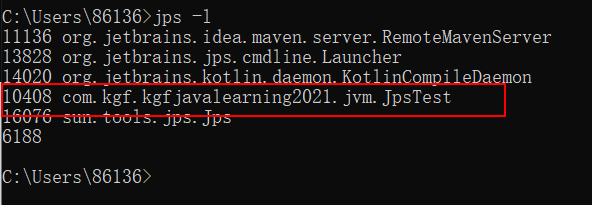
-l fully qualified name of the output program
-
-m output the parameters passed to main when the process starts
-
-v list JVM parameters
View process details by jps Name:
1,jps
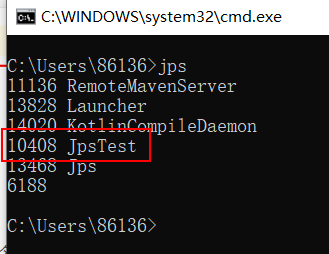
2,jps -q
3,jps -l
4,jps -m
Add parameters on idea
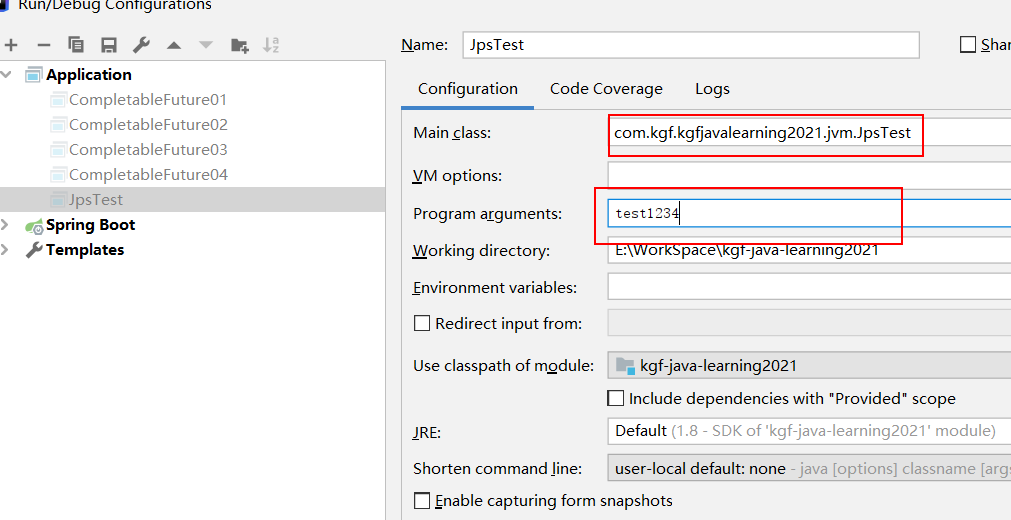
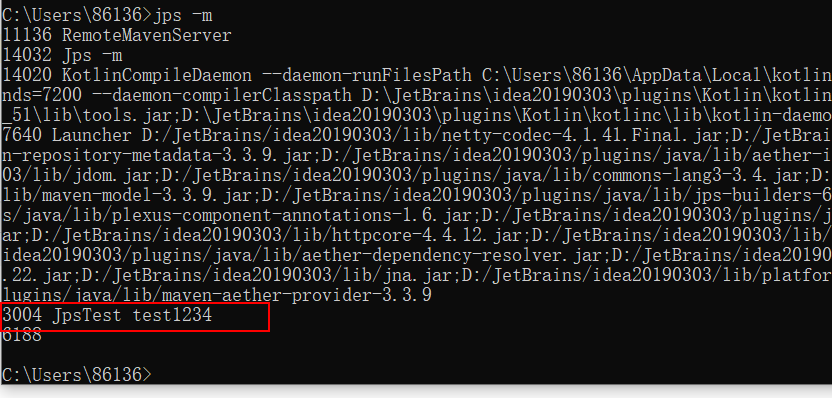
5,jps -v
Set the jvm parameters on the idea 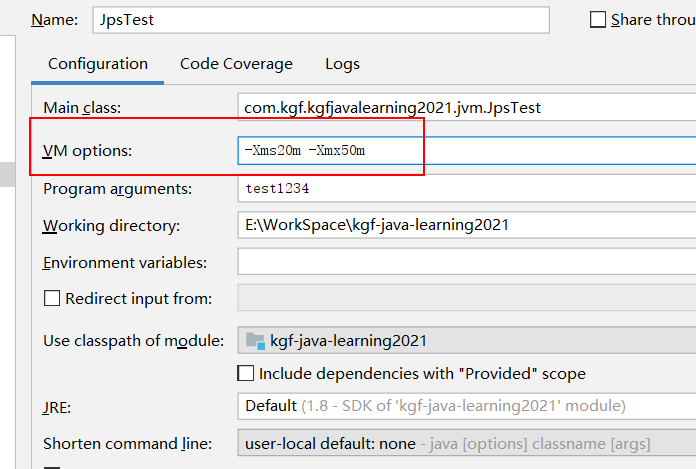
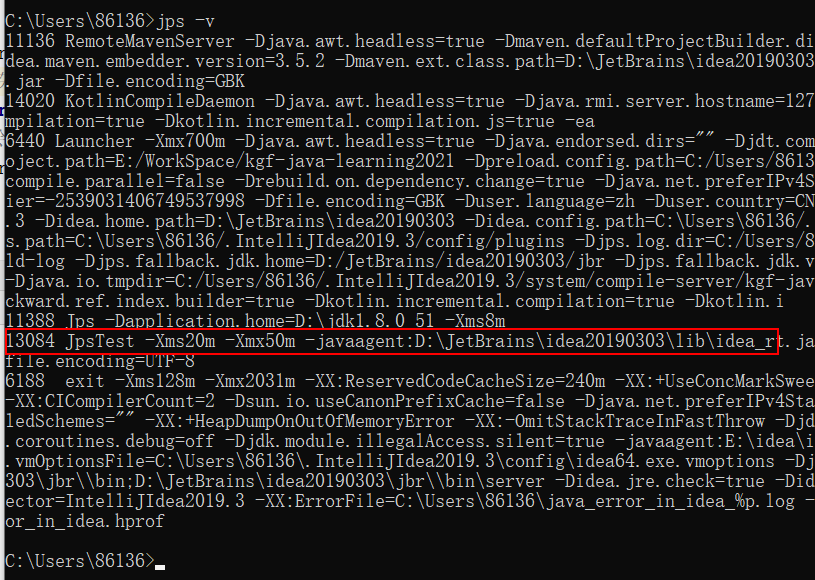
be careful:
If the Java process turns off the UserPerfData parameter, which is turned on by default, jps cannot detect.
Configure - XX:-UsePerfData on idea
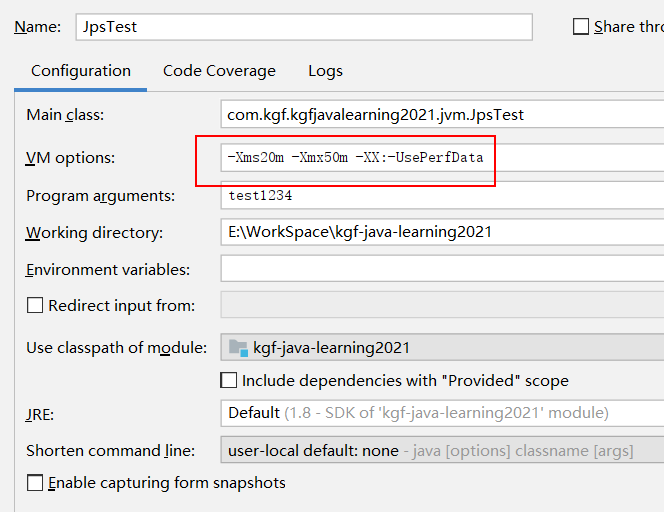
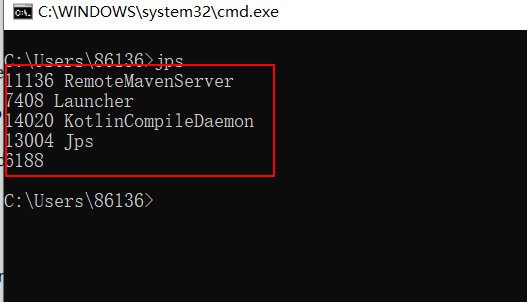
You can find that you can't see the process of JpsTest above
2, jstat viewing JVM statistics
1. Introduction
jstat( JVM Statistics Monitoring TooL):
Command line tool for monitoring various running status information of virtual machine. It can show the class loading, memory, garbage collection, JIT compilation and other running data in the local or remote virtual machine process.
On servers that do not have a GUI Graphical interface and only provide a plain text console environment, it will be the preferred tool for locating virtual machine performance problems at run time. It is often used to detect garbage collection problems and memory leaks
2. Command: jstat - class process id
Displays information about ClassLoader , The test program still uses the above program, JpsTest
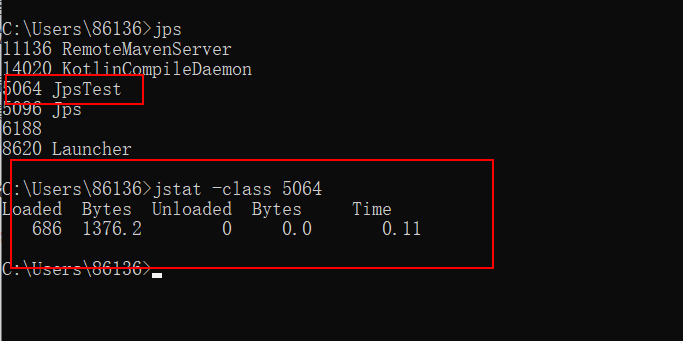
- Loaded: the number of classes that have been loaded
- Bytes: the number of bytes occupied by loading the class
- Unloaded: the number of unloaded classes
- Bytes: bytes of unloaded class
- Time: time spent loading and unloading classes
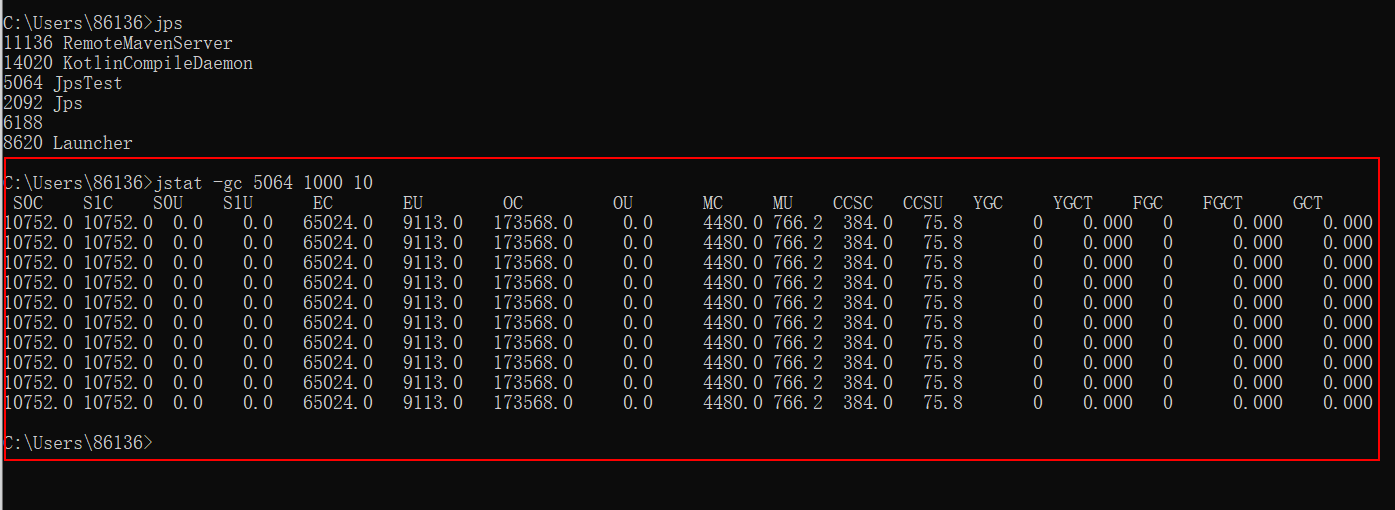
3. Command: jstat -gc process id, Displays GC related heap information
Display gc related heap information, view gc times, and execution time
- S0C: capacity of the first survivor in the younger generation (bytes)
- S1C: capacity of the second survivor in the younger generation (bytes)
- S0U: space (bytes) used by the first survivor in the younger generation
- S1U: space (bytes) used by the second survivor in the younger generation
- EC: capacity of Eden in the younger generation (bytes)
- EU: space (bytes) used by Eden (Eden) in the younger generation
- OC: capacity of Old generation (bytes)
- OU: used space of Old generation (bytes)
- MC: capacity of Metaspace (bytes)
- MU: Metaspace currently used space (bytes)
- YGC: the number of gc in the younger generation from application startup to sampling
- YGCT: time taken by gc in the younger generation from application startup to sampling (s)
- FGC: number of old generation (full gc)gc from application startup to sampling
- FGCT: time (s) spent in old generation (full gc)gc from application startup to sampling
- GCT: total time from application startup to gc sampling (s)
4. interval specifies the period for updating statistics, in ms, and is entered every n milliseconds
Note: both - class and - gc above can add the interval parameter to continue printing. For example, we can print - class
jstat -class 5064 1000 It means that it is printed once every 1 second, so that we can continuously monitor it
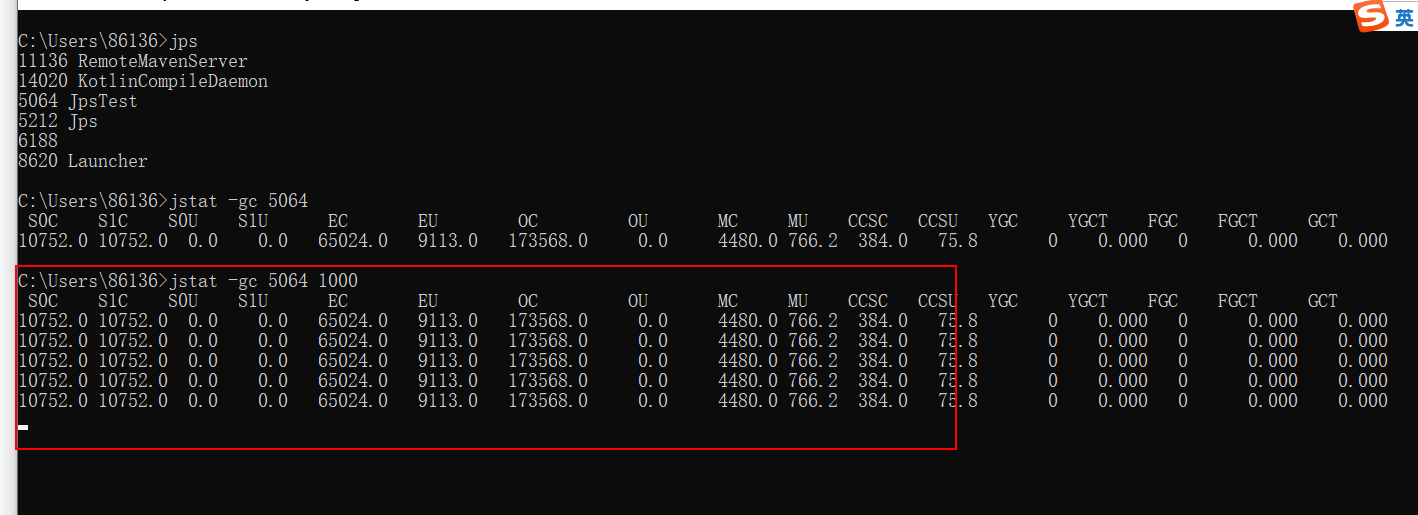
Of course, we can also specify the number of times to print and add the count parameter, such as printing 10 times
jstat -class 5064 1000 10 It means that it is printed once every 1 second, 10 times in total
5. - t means to add a time stamp before the output information, indicating the running time unit of the program, s
jstat -class -t 5064 1000 10 It means that it is printed once every 1 second, a total of 10 times, and preceded by the date

6. - h indicates the number of rows of content, and then enter header information once
jstat -class -t -h5 5064 1000 10 It means that it is printed once every 1 second, a total of 10 times, preceded by the date, and the header information is entered once after 5 lines

7,jstat -compiler [pid] Displays information such as the number of VM jits
Command: jstat -compiler 5064
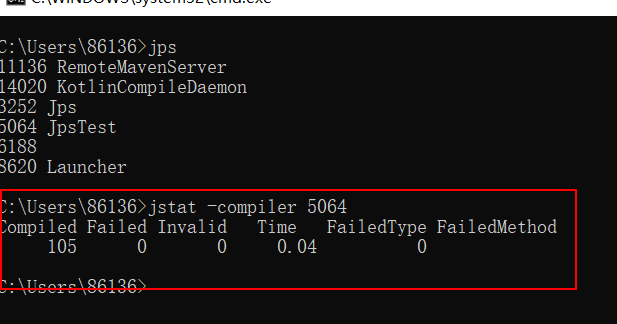
- Compiled: number of compiled tasks executed
- Failed: number of compilation task execution failures
- Invalid: invalid number of compilation task execution
- Time: time consumed by compilation task
- FailedType: the type of the last compilation failed task
- FailedMethod: the class and method of the last compilation failed task
8,jstat -printcompilation [pid], information of current VM execution
Command: jstat -printcompilation five thousand and sixty-four

- Compiled: number of compiled tasks
- Size: the size of the bytecode generated by the method
- Type: compile type
- Method: the class name and method name are used to identify the compiled method. The class name uses / as a namespace separator. The method name is the method in the given class. The above format is set by the - XX: + printcompilation option
3, Best practices
1. Use gc to check the gc situation of the program over a period of time and whether there is a risk of memory overflow
1.1. First, we create a test program as follows:
package com.kgf.kgfjavalearning2021.jvm;

import java.util.ArrayList;

/***
 * Frequency of testing GC:
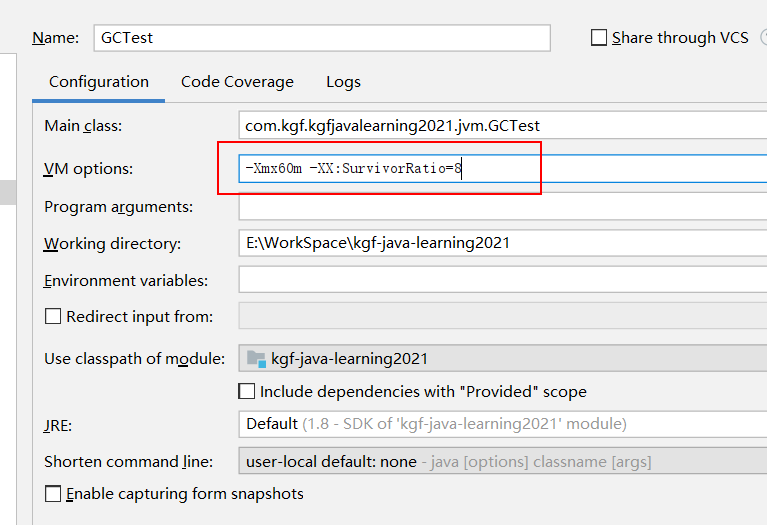
 * Set memory size: - Xmx60m -XX:SurvivorRatio=8
 *
 * -Xmx60m: Indicates the maximum heap size, that is, after your virtual machine starts, it will allocate such a large heap memory to you
 * -XX:SurvivorRatio=8:
 *      Set the proportion of eden and S0/S1 space in the Cenozoic
 *      default
 *          -XX:SurvivorRatio=8,Eden:S0:S1=8:1:1
 *      If
 *          -XX:SurvivorRatio=4,Eden:S0:S1=4:1:1
 *          SurvivorRatio The value is the proportion of Eden area. S0/S1 is the same
 *
 */
public class GCTest {

    public static void main(String[] args) {

        ArrayList<byte[]> list = new ArrayList<>();

        for (int i = 0; i < 1000; i++) {
            byte[] arr = new byte[1024*100];//Store a 100kb byte array into the list each time
            list.add(arr);
            try {
                Thread.sleep(100);
            } catch (InterruptedException e) {
                e.printStackTrace();
            }
        }
    }

}
Set the maximum heap memory to 60M, and the memory occupied by each region is as follows:
Cenozoic + old age = 60m
Cenozoic: old age = 1:2
Cenozoic: 20M
Old age: 40M
Cenozoic= Eden+S0+S1 = 20M
Eden:S0:S1 = 8:1:1
Therefore, the final results are as follows:
Eden: 16M
S0: 2M
S1:2M
Set heap memory in idea:
Start the program and use the jstat command to view:
Command: jstat -gc -t 2504 1000 30 means to print once every 1 second, a total of 30 times, and preceded by the date
C:\Users\86136>jps
13524 Jps
5252
12664 KotlinCompileDaemon
2504 GCTest
4904 Launcher
7100 RemoteMavenServer

C:\Users\86136>jstat -gc -t 2504 1000 30
Timestamp        S0C    S1C    S0U    S1U      EC       EU        OC         OU       MC     MU    CCSC   CCSU   YGC     YGCT    FGC    FGCT     GCT
           19.0 2048.0 2048.0  0.0   2032.2 16384.0   5759.2   40960.0    11116.1   4864.0 3733.9 512.0  410.2       1    0.003   0      0.000    0.003
           20.0 2048.0 2048.0  0.0   2032.2 16384.0   6567.6   40960.0    11116.1   4864.0 3733.9 512.0  410.2       1    0.003   0      0.000    0.003
           21.0 2048.0 2048.0  0.0   2032.2 16384.0   7376.1   40960.0    11116.1   4864.0 3733.9 512.0  410.2       1    0.003   0      0.000    0.003
           22.0 2048.0 2048.0  0.0   2032.2 16384.0   8184.5   40960.0    11116.1   4864.0 3733.9 512.0  410.2       1    0.003   0      0.000    0.003
           23.1 2048.0 2048.0  0.0   2032.2 16384.0   9397.2   40960.0    11116.1   4864.0 3733.9 512.0  410.2       1    0.003   0      0.000    0.003
           24.0 2048.0 2048.0  0.0   2032.2 16384.0  10205.7   40960.0    11116.1   4864.0 3733.9 512.0  410.2       1    0.003   0      0.000    0.003
           25.1 2048.0 2048.0  0.0   2032.2 16384.0  11014.1   40960.0    11116.1   4864.0 3733.9 512.0  410.2       1    0.003   0      0.000    0.003
           26.1 2048.0 2048.0  0.0   2032.2 16384.0  12226.8   40960.0    11116.1   4864.0 3733.9 512.0  410.2       1    0.003   0      0.000    0.003
           27.1 2048.0 2048.0  0.0   2032.2 16384.0  13035.3   40960.0    11116.1   4864.0 3733.9 512.0  410.2       1    0.003   0      0.000    0.003
           28.1 2048.0 2048.0  0.0   2032.2 16384.0  13843.7   40960.0    11116.1   4864.0 3733.9 512.0  410.2       1    0.003   0      0.000    0.003
           29.1 2048.0 2048.0  0.0   2032.2 16384.0  14652.2   40960.0    11116.1   4864.0 3733.9 512.0  410.2       1    0.003   0      0.000    0.003
           30.1 2048.0 2048.0  0.0   2032.2 16384.0  15864.9   40960.0    11116.1   4864.0 3733.9 512.0  410.2       1    0.003   0      0.000    0.003
           31.1 2048.0 2048.0  0.0    0.0   16384.0   100.0    40960.0    29273.4   4864.0 3734.0 512.0  410.2       2    0.007   1      0.010    0.017
           32.1 2048.0 2048.0  0.0    0.0   16384.0   1012.4   40960.0    29273.4   4864.0 3734.0 512.0  410.2       2    0.007   1      0.010    0.017
           33.1 2048.0 2048.0  0.0    0.0   16384.0   2012.6   40960.0    29273.4   4864.0 3734.0 512.0  410.2       2    0.007   1      0.010    0.017
           34.1 2048.0 2048.0  0.0    0.0   16384.0   2912.7   40960.0    29273.4   4864.0 3734.0 512.0  410.2       2    0.007   1      0.010    0.017
           35.2 2048.0 2048.0  0.0    0.0   16384.0   3812.8   40960.0    29273.4   4864.0 3734.0 512.0  410.2       2    0.007   1      0.010    0.017
           36.2 2048.0 2048.0  0.0    0.0   16384.0   4813.0   40960.0    29273.4   4864.0 3734.0 512.0  410.2       2    0.007   1      0.010    0.017
           37.2 2048.0 2048.0  0.0    0.0   16384.0   5713.1   40960.0    29273.4   4864.0 3734.0 512.0  410.2       2    0.007   1      0.010    0.017
           38.2 2048.0 2048.0  0.0    0.0   16384.0   6613.3   40960.0    29273.4   4864.0 3734.0 512.0  410.2       2    0.007   1      0.010    0.017
           39.2 2048.0 2048.0  0.0    0.0   16384.0   7513.4   40960.0    29273.4   4864.0 3734.0 512.0  410.2       2    0.007   1      0.010    0.017
           40.2 2048.0 2048.0  0.0    0.0   16384.0   8413.6   40960.0    29273.4   4864.0 3734.0 512.0  410.2       2    0.007   1      0.010    0.017
           41.2 2048.0 2048.0  0.0    0.0   16384.0   9313.7   40960.0    29273.4   4864.0 3734.0 512.0  410.2       2    0.007   1      0.010    0.017
           42.2 2048.0 2048.0  0.0    0.0   16384.0  10213.8   40960.0    29273.4   4864.0 3734.0 512.0  410.2       2    0.007   1      0.010    0.017
           43.2 2048.0 2048.0  0.0    0.0   16384.0  11214.0   40960.0    29273.4   4864.0 3734.0 512.0  410.2       2    0.007   1      0.010    0.017
           44.2 2048.0 2048.0  0.0    0.0   16384.0  12114.1   40960.0    29273.4   4864.0 3734.0 512.0  410.2       2    0.007   1      0.010    0.017
           45.3 2048.0 2048.0  0.0    0.0   16384.0  13014.3   40960.0    29273.4   4864.0 3734.0 512.0  410.2       2    0.007   1      0.010    0.017
           46.3 2048.0 2048.0  0.0    0.0   16384.0  13914.4   40960.0    29273.4   4864.0 3734.0 512.0  410.2       2    0.007   1      0.010    0.017
           47.3 2048.0 2048.0  0.0    0.0   16384.0  14814.6   40960.0    29273.4   4864.0 3734.0 512.0  410.2       2    0.007   1      0.010    0.017
           48.2 2048.0 2048.0  0.0    0.0   16384.0  15714.7   40960.0    29273.4   4864.0 3734.0 512.0  410.2       2    0.007   1      0.010    0.017

C:\Users\86136>
So what can we find from the above information?
EU : The capacity (bytes) used by Eden in the younger generation can be found to be 16M full
OU: the space (bytes) used by the Old generation is 40M, so the program should overflow memory
