if fast or switch fast? Do you want to specify the initialization size of HashMap? How much performance can be improved after it is specified? Which serialization method takes less time?
No matter what the reason is, it is necessary to evaluate the performance.
In most cases, it is not enough to simply answer who is fast and who is slow. How to quantify program performance?
This requires our protagonist JMH to appear!
JMH introduction
JMH(Java Microbenchmark Harness) is a tool suite for code microbenchmark testing, which is mainly based on method level benchmarking, and its precision can reach nanosecond level. This tool is written by Oracle's internal implementation of JIT. They should know more about JIT and the impact of JVM on benchmark than anyone else.
When you locate the hot method and want to further optimize the performance of the method, you can use JMH to conduct quantitative analysis of the optimization results.
Typical application scenarios of JMH are as follows:
- Want to know exactly how long a method takes to execute and the correlation between execution time and input
- Compare the throughput of different interfaces under given conditions
- See what percentage of requests are completed in how long
Next, we take two methods of string splicing as examples to benchmark with JMH.
Join dependency
Because JMH comes with JDK9, if it is a version before JDK9, the following dependencies need to be added (currently, the latest version of JMH is 1.23):
<dependency>
    <groupId>org.openjdk.jmh</groupId>
    <artifactId>jmh-core</artifactId>
    <version>1.23</version>
</dependency>
<dependency>
    <groupId>org.openjdk.jmh</groupId>
    <artifactId>jmh-generator-annprocess</artifactId>
    <version>1.23</version>
</dependency>
Write benchmark
Next, create a JMH test class to determine + and StringBuilder.append() which of the two string splicing takes less time, the specific code is as follows:
@BenchmarkMode(Mode.AverageTime)
@Warmup(iterations = 3, time = 1)
@Measurement(iterations = 5, time = 5)
@Threads(4)
@Fork(1)
@State(value = Scope.Benchmark)
@OutputTimeUnit(TimeUnit.NANOSECONDS)
public class StringConnectTest {

    @Param(value = {"10", "50", "100"})
    private int length;

    @Benchmark
    public void testStringAdd(Blackhole blackhole) {
        String a = "";
        for (int i = 0; i < length; i++) {
            a += i;
        }
        blackhole.consume(a);
    }

    @Benchmark
    public void testStringBuilderAdd(Blackhole blackhole) {
        StringBuilder sb = new StringBuilder();
        for (int i = 0; i < length; i++) {
            sb.append(i);
        }
        blackhole.consume(sb.toString());
    }

    public static void main(String[] args) throws RunnerException {
        Options opt = new OptionsBuilder()
                .include(StringConnectTest.class.getSimpleName())
                .result("result.json")
                .resultFormat(ResultFormatType.JSON).build();
        new Runner(opt).run();
    }
}
The methods to be tested are identified with @ Benchmark annotations. The specific meanings of these annotations are described below.
In the main() function, first configure the test case, use the Builder mode to configure the test, save the configuration parameters into the Options object, and use the Options object to construct the Runner to start the test.
In addition, you can see the official jmh example demo: http://hg.openjdk.java.net/code-tools/jmh/file/tip/jmh-samples/src/main/java/org/openjdk/jmh/samples/
Perform benchmarking
The preparations are ready. Next, run the code, wait for a moment, and the test results will come out. Here is a brief description of the results:
# JMH version: 1.23
# VM version: JDK 1.8.0_201, Java HotSpot(TM) 64-Bit Server VM, 25.201-b09
# VM invoker: D:\Software\Java\jdk1.8.0_201\jre\bin\java.exe
# VM options: -javaagent:D:\Software\JetBrains\IntelliJ IDEA 2019.1.3\lib\idea_rt.jar=61018:D:\Software\JetBrains\IntelliJ IDEA 2019.1.3\bin -Dfile.encoding=UTF-8
# Warmup: 3 iterations, 1 s each
# Measurement: 5 iterations, 5 s each
# Timeout: 10 min per iteration
# Threads: 4 threads, will synchronize iterations
# Benchmark mode: Average time, time/op
# Benchmark: com.wupx.jmh.StringConnectTest.testStringBuilderAdd
# Parameters: (length = 100)
This part is the basic information of the test, such as the Java path used, the number of iterations to warm up the code, the number of iterations to measure the code, the number of threads used, the statistical unit of the test, etc.
# Warmup Iteration   1: 1083.569 ±(99.9%) 393.884 ns/op
# Warmup Iteration   2: 864.685 ±(99.9%) 174.120 ns/op
# Warmup Iteration   3: 798.310 ±(99.9%) 121.161 ns/op
This part is the performance index of each warm-up, and the preheating test will not be taken as the final statistical result. The purpose of preheating is to let the JVM optimize the tested code enough. For example, after preheating, the tested code should be fully JIT compiled and optimized.
Iteration   1: 810.667 ±(99.9%) 51.505 ns/op
Iteration   2: 807.861 ±(99.9%) 13.163 ns/op
Iteration   3: 851.421 ±(99.9%) 33.564 ns/op
Iteration   4: 805.675 ±(99.9%) 33.038 ns/op
Iteration   5: 821.020 ±(99.9%) 66.943 ns/op

Result "com.wupx.jmh.StringConnectTest.testStringBuilderAdd":
  819.329 ±(99.9%) 72.698 ns/op [Average]
  (min, avg, max) = (805.675, 819.329, 851.421), stdev = 18.879
  CI (99.9%): [746.631, 892.027] (assumes normal distribution)

Benchmark                               (length)  Mode  Cnt     Score     Error  Units
StringConnectTest.testStringBuilderAdd       100  avgt    5   819.329 ±  72.698  ns/op
This section shows the measurement iteration, and each iteration shows the current execution rate, i.e. the time spent on an operation. After five iterations, statistics are made. In this case, the average execution time of testStringBuilderAdd method is 819.329 ns with length of 100, and the error is 72.698 ns.
The final test results are as follows:
Benchmark                               (length)  Mode  Cnt     Score     Error  Units
StringConnectTest.testStringAdd               10  avgt    5   161.496 ±  17.097  ns/op
StringConnectTest.testStringAdd               50  avgt    5  1854.657 ± 227.902  ns/op
StringConnectTest.testStringAdd              100  avgt    5  6490.062 ± 327.626  ns/op
StringConnectTest.testStringBuilderAdd        10  avgt    5    68.769 ±   4.460  ns/op
StringConnectTest.testStringBuilderAdd        50  avgt    5   413.021 ±  30.950  ns/op
StringConnectTest.testStringBuilderAdd       100  avgt    5   819.329 ±  72.698  ns/op
The results show that the more characters are spliced, the more characters are spliced, StringBuilder.append() is better.
Generate jar package execution
For some small tests, just write a main function in the above way and execute it manually.
For large-scale tests, the test time is relatively long and the number of threads is relatively large. In addition, the test server needs to be executed in the Linux server.
JMH officially provides a way to generate jar packages for execution. We need to add a plugin in maven. The specific configuration is as follows:
<plugins>
    <plugin>
        <groupId>org.apache.maven.plugins</groupId>
        <artifactId>maven-shade-plugin</artifactId>
        <version>2.4.1</version>
        <executions>
            <execution>
                <phase>package</phase>
                <goals>
                    <goal>shade</goal>
                </goals>
                <configuration>
                    <finalName>jmh-demo</finalName>
                    <transformers>
                        <transformer
                                implementation="org.apache.maven.plugins.shade.resource.ManifestResourceTransformer">
                            <mainClass>org.openjdk.jmh.Main</mainClass>
                        </transformer>
                    </transformers>
                </configuration>
            </execution>
        </executions>
    </plugin>
</plugins>
Then execute the command of maven to generate the executable jar package and execute:
mvn clean install
java -jar target/jmh-demo.jar StringConnectTest
JMH Foundation
In order to make better use of various functions of JMH, the basic concepts of JMH are explained as follows:
@BenchmarkMode
It is used to configure mode options, which can be used in classes or methods. The value of this annotation is an array, and several modes can be combined for execution, such as @ BenchmarkMode({Mode.SampleTime, Mode.AverageTime }) can also be set to Mode.All , i.e. perform it all once.
- Throughput: the overall throughput. How many calls are made per second, in ops/time
- Average time: the average time used, the average time of each operation, in time/op
- SampleTime: random sampling, and finally output the distribution of sampling results
- SingleShotTime: only run once, often set the number of warmups to 0 at the same time, used to test the performance of cold start
- All: all modes above are executed once
@State
Through state, you can specify the scope of an object. JMH instantiates and shares objects according to the scope. @State can be used by inheritance. If the parent class defines the annotation, the child class does not need to be defined. Because JMH allows multiple threads to execute tests at the same time, the meanings of different options are as follows:
- Scope.Benchmark : all test threads share an instance, and test the performance of stateful instances under multithreading sharing
- Scope.Group : the same thread shares the instance in the same group
- Scope.Thread : default State, one instance per test thread
@OutputTimeUnit
Is the time unit of statistical results, which can be used for class or method annotation
@Warmup
Some basic test parameters that need to be configured for preheating can be used on classes or methods. Generally, the previous several program tests will be slow, so it is necessary to let the program warm up for several rounds to ensure the accuracy of the test. The parameters are as follows:
- iterations: number of preheating
- Time: time of each preheating
- timeUnit: unit of time, default second
- batchSize: batch size, calling methods several times per operation
Why preheat?
Because of the existence of the JIT mechanism of the JVM, if a function is called multiple times, the JVM will try to compile it into machine code, so as to improve the execution speed, so in order to make the result of the benchmark closer to the real situation, it needs to be preheated.
@Measurement
Some basic test parameters that need to be configured to actually call a method can be used on a class or method. The parameters are the same as @ Warmup.
@Threads
The test thread in each process, which can be used on a class or method.
@Fork
The number of times to fork, which can be used on a class or method. If the fork number is 2, JMH will fork out two processes for testing.
@Param
Many cases of specifying a parameter are particularly suitable for testing the performance of a function in the case of different parameter input. It can only work on fields. The @ State annotation must be defined when using this annotation.
After introducing the common annotations, let's take a look at the pitfalls of JMH.
JMH trap
Some pitfalls must be avoided when using JMH.
For example, dead code elimination in JIT optimization, such as the following code:
@Benchmark
public void testStringAdd(Blackhole blackhole) {
    String a = "";
    for (int i = 0; i < length; i++) {
        a += i;
    }
}
The JVM may think that variable a has never been used, so it optimizes to remove the whole method's internal code, which will affect the test results.
JMH provides two ways to avoid this problem. One is to use this variable as the return value of the method return a, and the other is to use Blackhole's consume to avoid JIT optimization elimination.
Other pitfalls include constant folding and constant propagation, never write loops in tests, use Fork to isolate multiple test methods, method inlining, pseudo sharing and caching rows, branch prediction, multithreaded tests, etc., which can be read by interested users https://github.com/lexburner/JMH-samples Understand all the pitfalls.
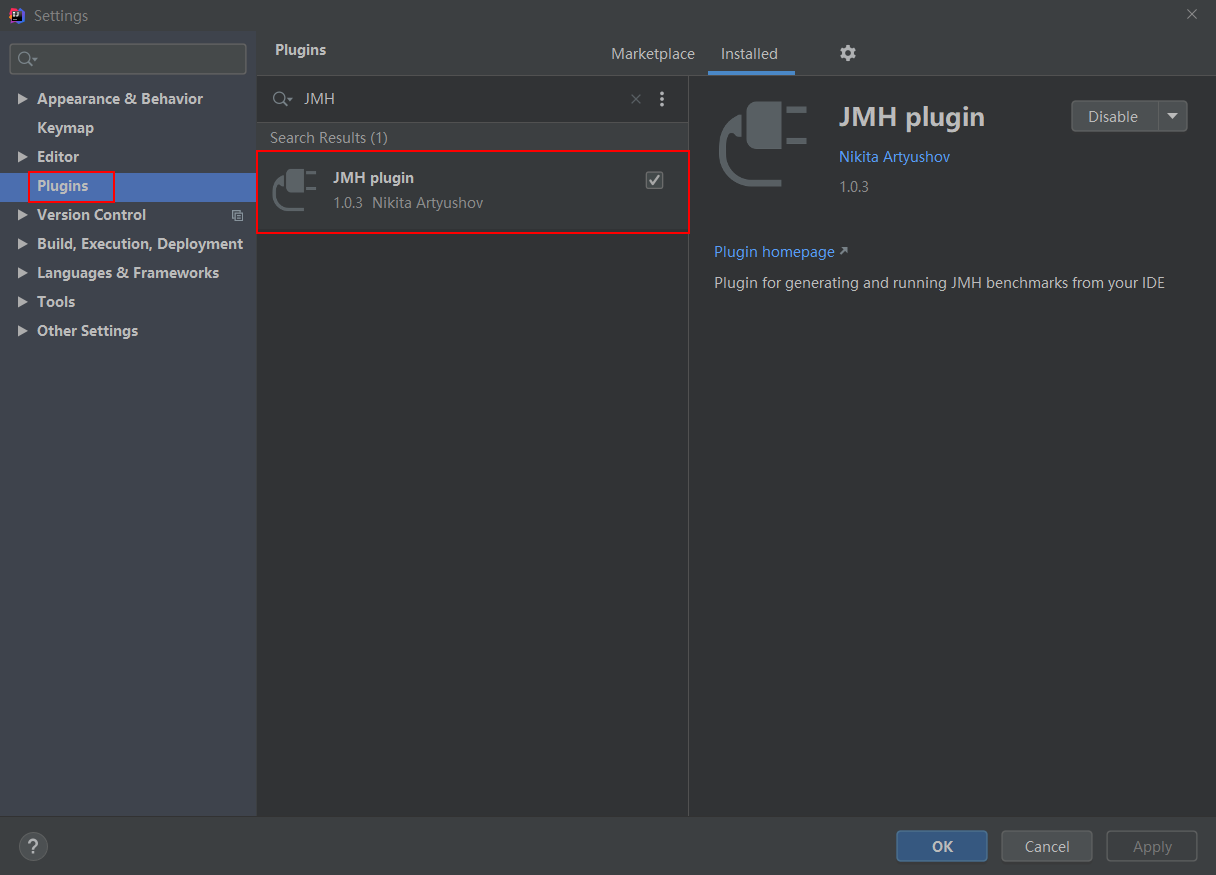
JMH plug in
You can also install jmh plug-ins through IDEA to make it easier for jmh to implement benchmark test. In IDEA, click file - > Settings... - > plugins, search jmh, and choose to install JMH plugin:
This plug-in allows us to use JMH in the same way as JUnit. The main functions are as follows:
- Automatically generate methods with @ Benchmark
- Like JUnit, run a separate Benchmark method
- Run all Benchmark methods in the class
For example, you can right-click Generate... And select Generate JMH benchmark to Generate a method with @ Benchmark.
You can also Run a separate Benchmark method by moving the cursor to the method declaration and calling the Run operation.
Move the cursor to the line of the class name, right-click Run to Run, and all the methods annotated by @ Benchmark under the class will be executed.
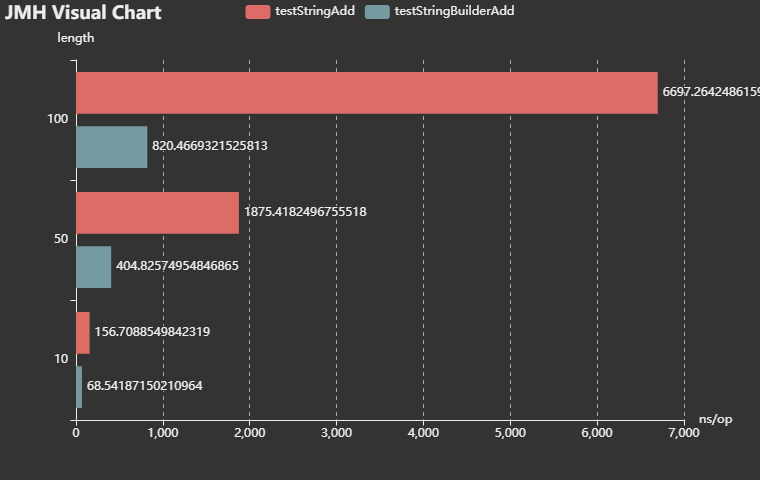
JMH visualization
In addition, if you want to visualize test results in the form of graphs, try these websites:
- JMH Visual Chart: http://deepoove.com/jmh-visual-chart/
- JMH Visualizer: https://jmh.morethan.io/
For example, you can import the json file of the above test example results to realize visualization:
summary
This paper mainly introduces the performance benchmarking tool JMH, which can avoid the impact of JIT or other optimizations in JVM on performance testing through some functions.
Just mark the business logic to be tested with @ Benchmark annotation, and JMH's annotation processor can automatically generate real performance test code and corresponding performance test configuration files.
The best relationship is mutual achievement. Everyone's watching, forwarding and leaving messages are the biggest driving force of my creation.
reference resources
http://openjdk.java.net/projects/code-tools/jmh/
Deep dismantling of Java virtual machine
Practical Java high concurrency programming