JavaScript Canvas implementation of custom polyline graph
Hello everyone, I'm the spirit of Mengxin studio. Today, I'll tell you how to realize a good-looking custom polyline chart. According to the Convention, the implementation effect is as follows: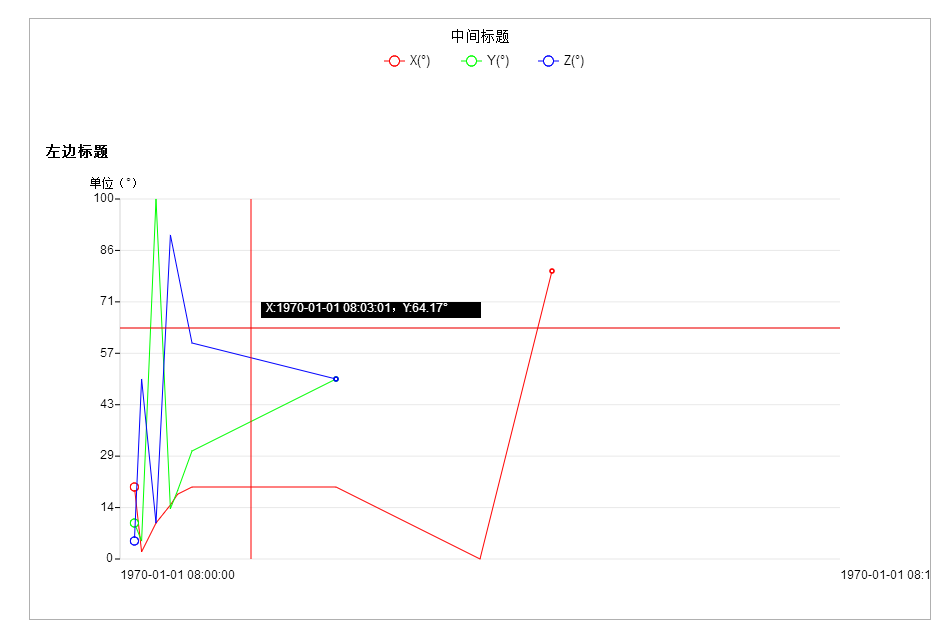
The picture effect is still OK. The color and content can be customized. Let me tell you my drawing logic. We need to encapsulate the drawing into an object, and give some default values first, such as the width and height of the canvas. We divide the canvas into two parts: the top 30% is used to draw the title and leave some blank. The chart takes up 60%, and the rest 10% is left blank To display the value of abscissa, and look like this: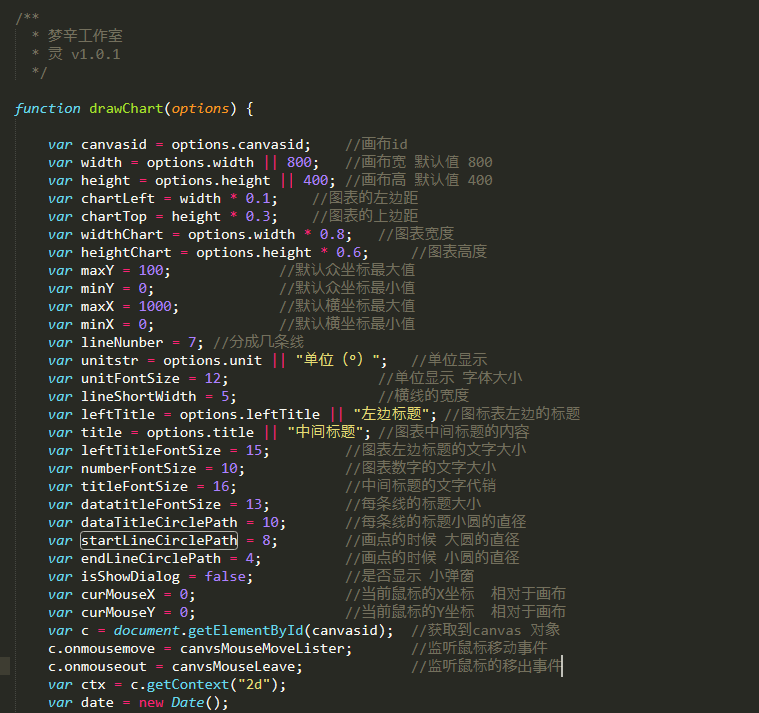
Also provide an object for loading data, which I define as follows: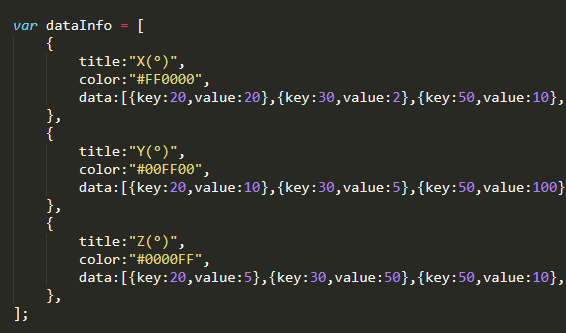
The title will be displayed in the middle title, and according to the corresponding color value, the data in the data is the data of the chart, and the external set method is provided to facilitate the external modification of the data content. When setting again, we need to sort all the data and obtain the maximum and minimum values of the horizontal and vertical coordinates in the data, which will be used when we calculate the coordinates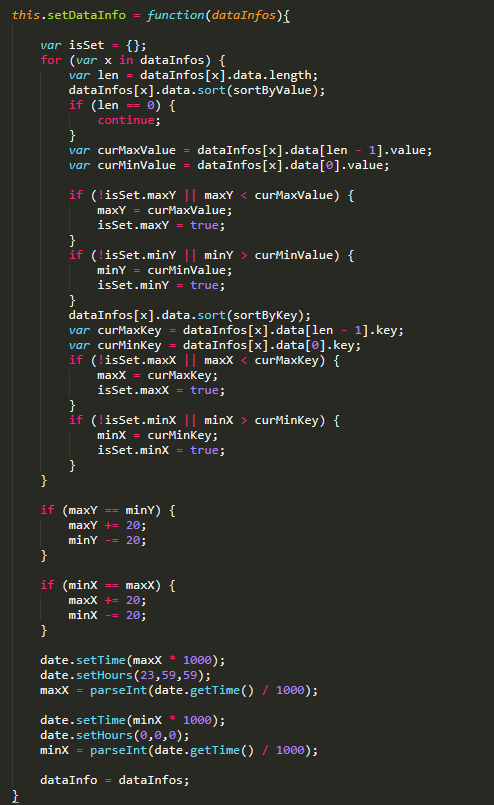
The next step is to start drawing. Put the drawing operation into the same drawing function: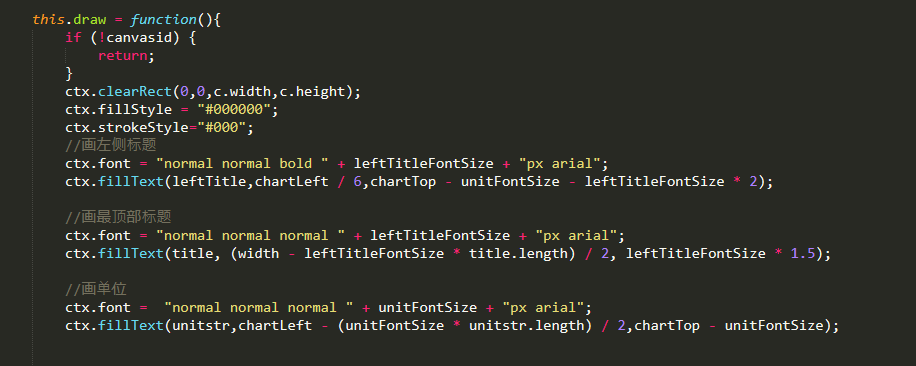
Clear the canvas before drawing to prevent drawing multiple times, then set the current style information, start filling in the text of the left title, the text of the top title, the unit text above the chart, and the dash information at the top, and then draw the chart content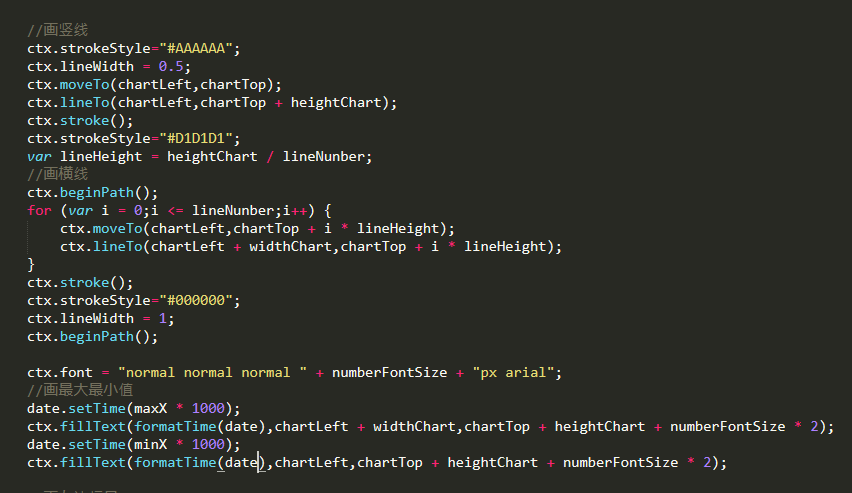
Set the color and width of the line, move the brush to the top left corner of the chart, that is, x is the left margin of the chart, y is the top margin of the chart, and then draw to
x is the left margin of the chart y is the top margin of the chart plus the height of the chart. Continue with the abscissa line, first calculate the interval height of each abscissa line,
Then draw horizontal lines according to each height, and then draw the display of maximum and minimum values;
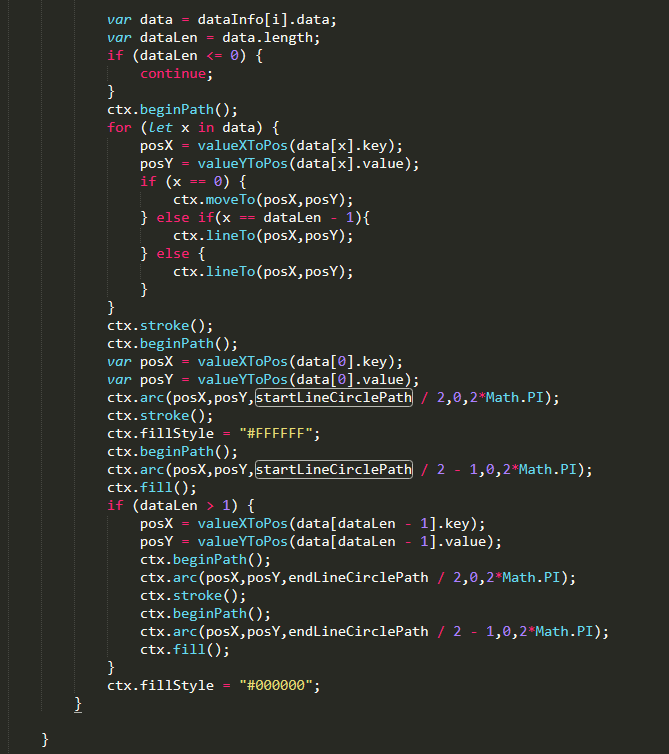
The next step is to start drawing each point. Here we have to provide several methods first, that is, calculate the data corresponding to the current abscissa according to the x coordinate, calculate the current x coordinate according to the data, calculate the data corresponding to the current ordinate according to the y coordinate, and calculate the current y coordinate according to the data. The approximate calculation method is to use the maximum value and the maximum value Divide the difference of small value by the difference between the maximum coordinate value and the minimum coordinate value to obtain a corresponding proportion, then multiply the current coordinate value by this proportion and add the minimum value to obtain the data value corresponding to the current coordinate value, as follows: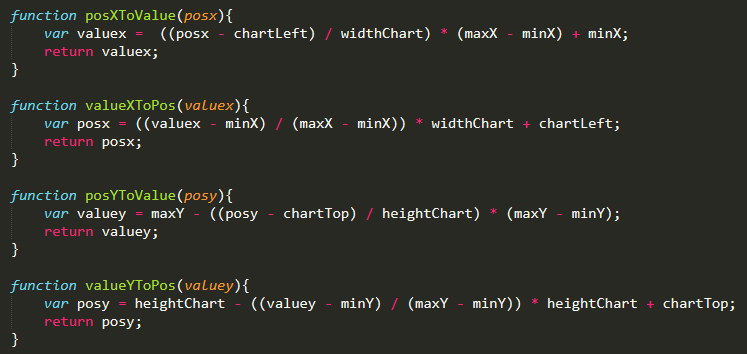
In this way, the polyline of our data will be simple. You can directly submit the value to get the corresponding coordinate value and draw a picture
Finally, there is a small pop-up window to draw, which needs to monitor the mouse movement event and determine whether it is in the chart. If it is allowed to draw pop-up window, it is not allowed to draw chart if it is not: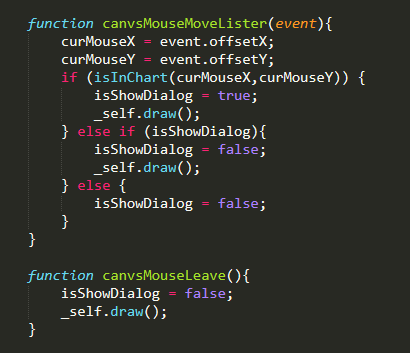
Determine whether the mouse is in the chart
Then a pop-up window drawing operation is performed on the last face of the draw method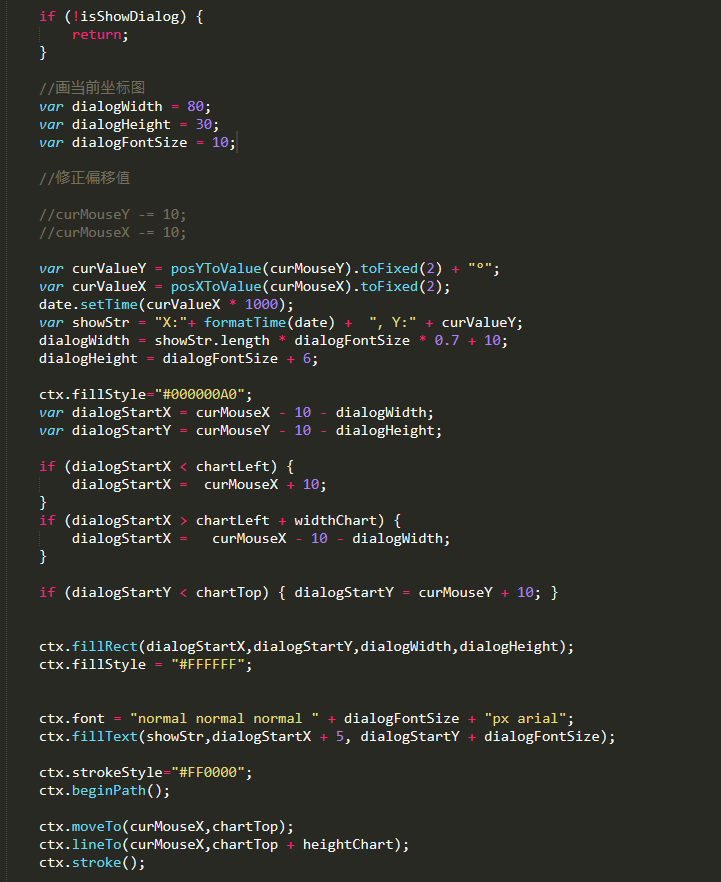
Here I add an interpretation. When the pop-up window is going beyond the boundary line, I will change the drawing direction of the pop-up window,
Finally, I put all the source code for your reference. If there are any mistakes, please point out
First, html file:
<!doctype html>
<html>
<!DOCTYPE >
<html>
<head>
	<meta http-equiv="Content-Type" content="text/html,charset=utf-8">
	<meta name="viewport" content="width=device-width,initial-scale=1.0,maximum-scale=1.0,user-scalable=0">
</head>
<body>
	<div id="Contents" >
		<div style="width:100%;height:auto;margin-top:40px;text-align: center;">
			 <canvas id="myCanvas" width="900" height="600" style="background:#fff;margin-top:10px;border:1px solid #b0b0b0;">Your browser does not support HTML5 canvas Label.</canvas>
		</div>
	</div>

 <script type="text/javascript" src="chart.js"></script>
 <script type="text/javascript" src="index.js"></script>
</body>
</html>
Then index.js:
window.onload =  (argument) => {

	var chartutil = new drawChart({
		 	width:900,
		 	height:600,
		 	canvasid:"myCanvas"
		 });

	chartutil.setDataInfo([]);
	chartutil.draw();

}
Then chart.js:
/**
  * Mengxin studio
  *	Ling v1.0.1
  */

function drawChart(options) {

	var canvasid = options.canvasid;	//Canvas id
	var width = options.width || 800;	//Canvas width default 800
	var height = options.height || 400;	//Canvas height default value 400
	var chartLeft = width * 0.1;	//Left margin of chart
	var chartTop = height * 0.3;	//Top margin of chart
	var widthChart = options.width * 0.8;	//Chart width
	var heightChart = options.height * 0.6; 	//Chart height
	var maxY = 100;				//Default multi coordinate maximum
	var minY = 0;				//Default multi coordinate minimum
	var maxX = 1000;			//Default abscissa Max
	var minX = 0;				//Default abscissa minimum
	var lineNunber = 7;	//Divided into several lines
	var unitstr = options.unit || "Unit (°)";	//Unit display
	var unitFontSize = 12;					//Unit display font size
	var lineShortWidth = 5;					//Width of horizontal line
	var leftTitle = options.leftTitle || "Left heading";	//Title to the left of the icon table
	var title = options.title || "Middle title";	//Contents of the middle title of the chart
	var leftTitleFontSize = 15;			//Text size of the title on the left side of the chart
	var numberFontSize = 10;			//Text size of chart numbers
	var titleFontSize = 16;				//Text selling of middle title
	var datatitleFontSize = 13;			//Title size of each line
	var dataTitleCirclePath = 10;		//Diameter of the title circle of each line
	var startLineCirclePath = 8;		//The diameter of the big circle when drawing points
	var endLineCirclePath = 4;			//The diameter of the small circle when drawing points
	var isShowDialog = false;			//Show pop ups or not
	var curMouseX = 0;					//The X coordinate of the current mouse is relative to the canvas
	var curMouseY = 0;  				//Y coordinate of current mouse relative to canvas
	var c = document.getElementById(canvasid);	//Get to canvas object
	c.onmousemove = canvsMouseMoveLister;		//Listening for mouse movement events
	c.onmouseout = canvsMouseLeave;				//Listen for mouse removal events
	var ctx = c.getContext("2d");
	var date = new Date();

	var dataInfo = [
		{
			title:"X(°)",
			color:"#FF0000",
			data:[{key:20,value:20},{key:30,value:2},{key:50,value:10},{key:70,value:15},{key:80,value:18},{key:100,value:20},{key:300,value:20},{key:500,value:0},{key:600,value:80}]
		},
		{
			title:"Y(°)",
			color:"#00FF00",
			data:[{key:20,value:10},{key:30,value:5},{key:50,value:100},{key:70,value:14},{key:80,value:19},{key:100,value:30},{key:300,value:50}]
		},
		{
			title:"Z(°)",
			color:"#0000FF",
			data:[{key:20,value:5},{key:30,value:50},{key:50,value:10},{key:70,value:90},{key:80,value:80},{key:100,value:60},{key:300,value:50}]
		},
	];

	var _self = this;

	this.init = function(options){
		canvasid = options.canvasid;
		width = options.width || 800;
		height = options.height || 400;
		chartLeft = width * 0.1;
		chartTop = height * 0.3;
		widthChart = options.width * 0.8;
		heightChart = options.height * 0.6;
		maxY = 100;
		minY = 0;
		maxX = 1000;
		minX = 0;
		lineNunber = 7;	//Divided into several lines
		unitstr = options.unit || "Unit (°)";
		unitFontSize = 12;
		lineShortWidth = 5;
		leftTitle = options.leftTitle || "Inclinometer-1";
		title = options.title || "Sampling frequency: not recorded and reported frequency: not recorded and reported frequency: not recorded yet";
		leftTitleFontSize = 15;
		numberFontSize = 10;
		titleFontSize = 16;
		datatitleFontSize = 13;
		dataTitleCirclePath = 10;
		startLineCirclePath = 8;
		endLineCirclePath = 4;
		c = document.getElementById(canvasid);
		c.onmousemove = canvsMouseMoveLister;
		c.onmouseout = canvsMouseLeave;
		ctx = c.getContext("2d");
	}


	this.setDataInfo = function(dataInfos){

		var isSet = {};
		for (var x in dataInfos) {
			var len = dataInfos[x].data.length;
			dataInfos[x].data.sort(sortByValue);
			if (len == 0) {
				continue;
			}
			var curMaxValue = dataInfos[x].data[len - 1].value;
			var curMinValue = dataInfos[x].data[0].value;

			if (!isSet.maxY || maxY < curMaxValue) {
				maxY = curMaxValue;
				isSet.maxY = true;
			}
			if (!isSet.minY || minY > curMinValue) {
				minY = curMinValue;
				isSet.minY = true;
			}
			dataInfos[x].data.sort(sortByKey);
			var curMaxKey = dataInfos[x].data[len - 1].key;
			var curMinKey = dataInfos[x].data[0].key;
			if (!isSet.maxX || maxX < curMaxKey) {
				maxX = curMaxKey;
				isSet.maxX = true;
			}
			if (!isSet.minX || minX > curMinKey) {
				minX = curMinKey;
				isSet.minX = true;
			}
		}

		if (maxY == minY) {
			maxY += 20;
			minY -= 20;
		}

		if (minX == maxX) {
			maxX += 20;
			minX -= 20;
		}

		date.setTime(maxX * 1000);
		date.setHours(23,59,59);
		maxX = parseInt(date.getTime() / 1000);

		date.setTime(minX * 1000);
		date.setHours(0,0,0);
		minX = parseInt(date.getTime() / 1000);

		dataInfo = dataInfos;
	}

	this.setMaxX = function(value){
		maxX = value;
	}

	this.setMaxY = function(value){
		maxY = value;
	}

	this.setMinX = function(value){
		minX = value;
	}

	this.setMinY = function(value){
		minY = value;
	}

	this.addMaxX = function(value){
		maxX += value;
	}

	this.addMaxY = function(value){
		maxY += value;
	}

	this.addMinX = function(value){
		minX += value;
	}

	this.addMinY = function(value){
		minY += value;
	}


	function canvsMouseMoveLister(event){
		curMouseX = event.offsetX;
		curMouseY = event.offsetY;
		if (isInChart(curMouseX,curMouseY)) {
			isShowDialog = true;
			_self.draw();
		} else if (isShowDialog){
			isShowDialog = false;
			_self.draw();
		} else {
			isShowDialog = false;
		}
	}

	function canvsMouseLeave(){
		isShowDialog = false;
		_self.draw();
	}

	this.draw = function(){
		if (!canvasid) {
			return;
		}
		ctx.clearRect(0,0,c.width,c.height);
		ctx.fillStyle = "#000000";
		ctx.strokeStyle="#000";
		//Draw the title on the left
		ctx.font = "normal normal bold " + leftTitleFontSize + "px arial";
		ctx.fillText(leftTitle,chartLeft / 6,chartTop - unitFontSize - leftTitleFontSize * 2);

		//Draw top title
		ctx.font = "normal normal normal " + leftTitleFontSize + "px arial";
		ctx.fillText(title, (width - leftTitleFontSize * title.length) / 2, leftTitleFontSize * 1.5);

		//Painting unit
		ctx.font =  "normal normal normal " + unitFontSize + "px arial";
		ctx.fillText(unitstr,chartLeft - (unitFontSize * unitstr.length) / 2,chartTop - unitFontSize);


		//Draw vertical lines
		ctx.strokeStyle="#AAAAAA";
		ctx.lineWidth = 0.5;
		ctx.moveTo(chartLeft,chartTop);
		ctx.lineTo(chartLeft,chartTop + heightChart);
		ctx.stroke();
		ctx.strokeStyle="#D1D1D1";
		var lineHeight = heightChart / lineNunber;
		//Draw horizontal line
		ctx.beginPath();
		for (var i = 0;i <= lineNunber;i++) {
			ctx.moveTo(chartLeft,chartTop + i * lineHeight);
			ctx.lineTo(chartLeft + widthChart,chartTop + i * lineHeight);
		}
		ctx.stroke();
		ctx.strokeStyle="#000000";
		ctx.lineWidth = 1;
		ctx.beginPath();

		ctx.font = "normal normal normal " + numberFontSize + "px arial";
		//Draw max min
		date.setTime(maxX * 1000);
		ctx.fillText(formatTime(date),chartLeft + widthChart,chartTop + heightChart + numberFontSize * 2);
		date.setTime(minX * 1000);
		ctx.fillText(formatTime(date),chartLeft,chartTop + heightChart + numberFontSize * 2);

		//Draw the left ruler
		for (var i = 0;i <= lineNunber;i++) {
			var curvalue  = (maxY - (i * lineHeight) / heightChart * (maxY - minY)).toFixed(0);
			ctx.fillText(curvalue,chartLeft - (numberFontSize * curvalue.length) / 1.5 - lineShortWidth - 2,chartTop + i * lineHeight + numberFontSize / 3);
			ctx.moveTo(chartLeft - lineShortWidth,chartTop + i * lineHeight);
			ctx.lineTo(chartLeft,chartTop + i * lineHeight);
		}
		ctx.stroke();

		//Draw data title
		ctx.font = "normal normal normal " + datatitleFontSize + "px arial";
		//Calculate total length
		var dataTitleLength = 0;

		if (dataInfo.length > 0) {

			for (let i in dataInfo) {
			 	dataTitleLength += dataInfo[i].title.length * datatitleFontSize;
			}

			var datatitleStartPos = (width - (dataTitleLength + (dataTitleCirclePath + dataInfo.length * lineShortWidth) + (dataInfo.length - 1) * 5)) / 2;

			var dataInfoHeight = leftTitleFontSize * 1.5 + datatitleFontSize * 1.5;
			for (let i in dataInfo) {

				var lineStartPos = datatitleStartPos + i *  (dataTitleCirclePath + 2 * lineShortWidth + dataInfo[i].title.length * datatitleFontSize + 5);
				var lineEndPos = lineStartPos + lineShortWidth;
				var lineRightStartPos = lineEndPos + dataTitleCirclePath;
				var lineRightEndPos = lineRightStartPos + lineShortWidth;

				ctx.fillText(dataInfo[i].title,lineRightEndPos + 5,dataInfoHeight + datatitleFontSize / 3);
				ctx.strokeStyle = dataInfo[i].color;
				ctx.beginPath();
				ctx.moveTo(lineStartPos,dataInfoHeight);
				ctx.lineTo(lineEndPos,dataInfoHeight);
				ctx.moveTo(lineRightStartPos,dataInfoHeight);
				ctx.lineTo(lineRightEndPos,dataInfoHeight);
				ctx.stroke();
				ctx.beginPath();
				ctx.arc(lineEndPos + dataTitleCirclePath / 2,dataInfoHeight,dataTitleCirclePath / 2,0,2*Math.PI);
				ctx.stroke();

				//Drawing data

				var data = dataInfo[i].data;
				var dataLen = data.length;
				if (dataLen <= 0) {
					continue;
				}
				ctx.beginPath();
				for (let x in data) {
					posX = valueXToPos(data[x].key);
					posY = valueYToPos(data[x].value);
					if (x == 0) {
						ctx.moveTo(posX,posY);
					} else if(x == dataLen - 1){
						ctx.lineTo(posX,posY);
					} else {
						ctx.lineTo(posX,posY);
					}
				}
				ctx.stroke();
				ctx.beginPath();
				var posX = valueXToPos(data[0].key);
				var posY = valueYToPos(data[0].value);
				ctx.arc(posX,posY,startLineCirclePath / 2,0,2*Math.PI);
				ctx.stroke();
				ctx.fillStyle = "#FFFFFF";
				ctx.beginPath();
				ctx.arc(posX,posY,startLineCirclePath / 2 - 1,0,2*Math.PI);
				ctx.fill();
				if (dataLen > 1) {
					posX = valueXToPos(data[dataLen - 1].key);
					posY = valueYToPos(data[dataLen - 1].value);
					ctx.beginPath();
					ctx.arc(posX,posY,endLineCirclePath / 2,0,2*Math.PI);
					ctx.stroke();
					ctx.beginPath();
					ctx.arc(posX,posY,endLineCirclePath / 2 - 1,0,2*Math.PI);
					ctx.fill();
				}
				ctx.fillStyle = "#000000";
			}

		}

		if (!isShowDialog) {
			return;
		}

		//Draw the current coordinate chart
		var dialogWidth = 80;
		var dialogHeight = 30;
		var dialogFontSize = 10;

		//Correction of offset value

		//curMouseY -= 10;
		//curMouseX -= 10;

		var curValueY = posYToValue(curMouseY).toFixed(2) + "°";
		var curValueX = posXToValue(curMouseX).toFixed(2);
		date.setTime(curValueX * 1000);
		var showStr = "X:"+ formatTime(date) +  ",Y:" + curValueY;
		dialogWidth = showStr.length * dialogFontSize * 0.7 + 10;
		dialogHeight = dialogFontSize + 6;

		ctx.fillStyle="#000000A0";
		var dialogStartX = curMouseX - 10 - dialogWidth;
		var dialogStartY = curMouseY - 10 - dialogHeight;

		if (dialogStartX < chartLeft) {
			dialogStartX =  curMouseX + 10;
		}
		if (dialogStartX > chartLeft + widthChart) {
			dialogStartX =   curMouseX - 10 - dialogWidth;
		}

		if (dialogStartY < chartTop) { dialogStartY = curMouseY + 10; }


		ctx.fillRect(dialogStartX,dialogStartY,dialogWidth,dialogHeight);
		ctx.fillStyle = "#FFFFFF";


		ctx.font = "normal normal normal " + dialogFontSize + "px arial";
		ctx.fillText(showStr,dialogStartX + 5, dialogStartY + dialogFontSize);

		ctx.strokeStyle="#FF0000";
		ctx.beginPath();

		ctx.moveTo(curMouseX,chartTop);
		ctx.lineTo(curMouseX,chartTop + heightChart);
		ctx.stroke();

		ctx.beginPath();
		ctx.moveTo(chartLeft,curMouseY);
		ctx.lineTo(chartLeft + widthChart,curMouseY);

		ctx.stroke();

	}
	const formatNumber = n => {
	  n = n.toString()
	  return n[1] ? n : '0' + n
	}
	function formatTime(date){
	  const year = date.getFullYear()
	  const month = date.getMonth() + 1
	  const day = date.getDate()
	  const hour = date.getHours()
	  const minute = date.getMinutes()
	  const second = date.getSeconds()

	  return [year, month, day].map(formatNumber).join('-') + ' ' + [hour, minute, second].map(formatNumber).join(':')
	}

	function formatTimeYMD(date){
	  const year = date.getFullYear()
	  const month = date.getMonth() + 1
	  const day = date.getDate()

	  return [year, month, day].map(formatNumber).join('-')
	}

	function posXToValue(posx){
		var valuex =  ((posx - chartLeft) / widthChart) * (maxX - minX) + minX;
		return valuex;
	}

	function valueXToPos(valuex){
		var posx = ((valuex - minX) / (maxX - minX)) * widthChart + chartLeft;
		return posx;
	}

	function posYToValue(posy){
		var valuey = maxY - ((posy - chartTop) / heightChart) * (maxY - minY);
		return valuey;
	}

	function valueYToPos(valuey){
		var posy = heightChart - ((valuey - minY) / (maxY - minY)) * heightChart + chartTop;
		return posy;
	}

	function isInChart(x,y){
		return ((x > chartLeft - 10 && x < chartLeft + widthChart + 10)) && ((y > chartTop - 10 && y < chartTop + heightChart + 10));
	}
}

function sortByKey(a,b){
	return a.key - b.key;
}

function sortByValue(a,b){
	return a.value - b.value;
}

