Java JVM diagnostic tool Arthas
https://arthas.aliyun.com/doc/ Official website
introduce
Arthas is an open source Java diagnostic tool of Alibaba, which is deeply loved by developers.
When you encounter the following similar problems and are helpless, Arthas can help you solve them:
- Which jar package is this class loaded from? Why are all kinds of related exceptions reported?
- Why didn't the code I changed execute? Am I not commit ted? Wrong branch?
- You can't debug online when you encounter a problem. Can you only republish it by adding a log?
- There is a problem with the data processing of a user online, but it is also impossible to debug online and reproduce offline!
- Is there a global perspective to view the health of the system?
- Is there any way to monitor the real-time running status of the JVM?
- How to quickly locate application hotspots and generate flame diagrams?
- How do I find an instance of a class directly from within the JVM?
Arthas supports JDK 6 +, Linux/Mac/Windows, adopts command-line interaction mode, and provides rich Tab automatic completion functions to further facilitate problem location and diagnosis.
Note: it is not applicable to microservices, but only to single service code troubleshooting,
For example, two services A and B, Arthas, are installed on service A, so A requests B. using Arthas can only track all links of code A, but the links of service B cannot
If you don't have time and trouble, you can install Arthas in both service providers at the same time. This can also be achieved, but the effect is not as good as microservice link tracking
You can search on the Internet, microservice link tracking tutorial
express setup
Create directory mkdir /usr/src/jvm
Enter the directory cd /usr/src/jvm
Note that curl - O cannot be used directly https://arthas.aliyun.com/math-game.jar
We need to go to github and download it manually
https://github.com/alibaba/arthas/releases
If it's too slow, I have an online version of arthas-3.5.3
Link: https://pan.baidu.com/s/19sx20oNxqA_322t3ySt-yA
Extraction code: 1234
Unzip the command Yum - y install unzip unzip - O Arthas bin.zip
Create directory mkdir /usr/src/java
Enter the directory cd /usr/src/java
Here we provide a program that can be executed all the time (random number) to facilitate learning arthas
Link: https://pan.baidu.com/s/1Z50cPpNgzJEMtFvD11c_rA
Extraction code: 1234
Start program
Use FinalSell or XShell
Open a window cd /usr/src/java
Start the applet java -jar math-game.jar provided by us
The effects are as follows:

Then open a window cd /usr/src/jvm
Start our performance monitor java -jar arthas-boot.jar
You can also start Java - jar arthas-boot.jar in the background&
If there is a problem, you can check the Arthas boot log under cd ~/logs/arthas /
The starting effect is as follows:

This startup method is to automatically query all programs on the current server, and then manually select the id for monitoring. According to the above, we can directly enter 1
Manually select the specified program for monitoring, and the effect is as follows:
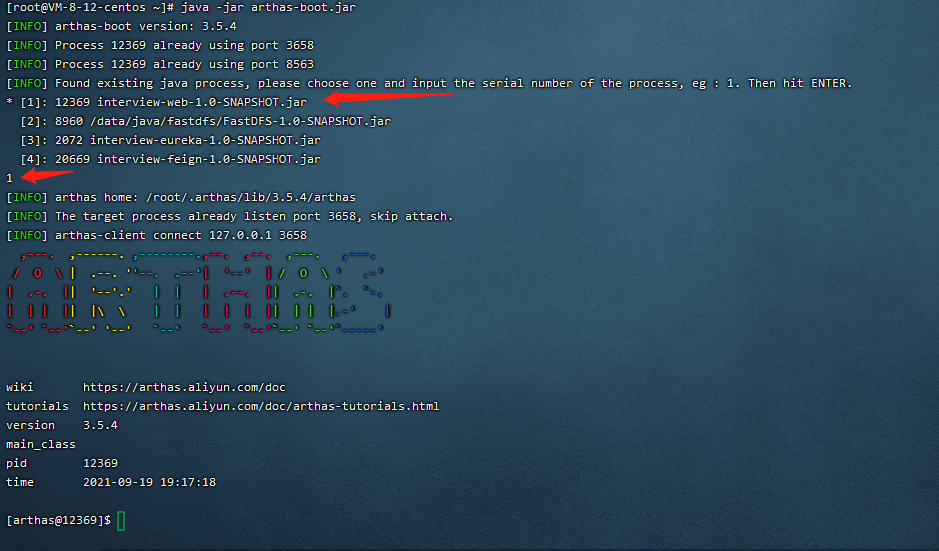
This page is the console for operating math Gome. You can monitor various commands
Note: arthas can open multiple clients in linux to monitor different java commands. The above startup method is still used
Common command manual
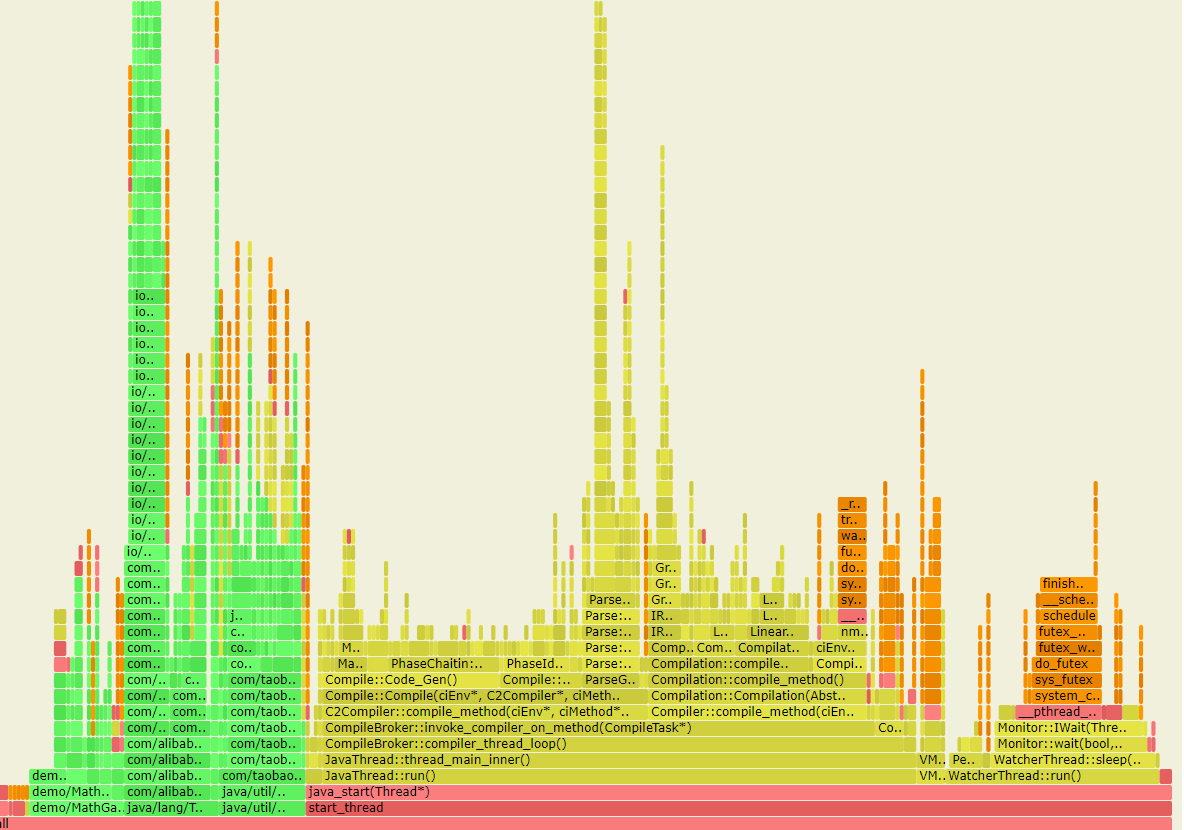
For more complete commands, you can enter help on the console
Arthas 3.5.3 complete explanation of commands
All of the following commands are used in the console entering the Arthas thread
Basic command
| NAME | DESCRIPTION |
|---|---|
| help | View command help information |
| cat | Print the contents of the file, similar to the cat command in linux |
| echo | Print parameters, similar to echo command in linux |
| grep | Matching search is similar to grep command in linux |
| base64 | Base64 encoding conversion is similar to the base64 command in linux |
| tee | Copy the standard input to the standard output and the specified file, which is similar to the tee command in linux |
| pwd | Returns the current working directory, similar to the linux command |
| cls | Clear the current screen area |
| session | View information about the current session |
| reset | Reset the enhanced classes to restore all the classes enhanced by Arthas. When the Arthas server is closed, all the enhanced classes will be reset |
| version | Output the version number of Arthas loaded by the current target Java process |
| history | Print command history |
| quit | Exit the current Arthas client, and other Arthas clients will not be affected |
| stop | Close the Arthas server and all Arthas clients exit |
Show only commonly used
[arthas@126997]$ cls
[arthas@126997]$ reset
Affect(class count: 0 , method count: 0) cost in 1 ms, listenerId: 0
[arthas@126997]$ history
    1  dashboard
    2  dashboard
    3  thread  16
[arthas@126997]$ quit
[root@localhost jvm]#
jvm related
| NAME | DESCRIPTION |
|---|---|
| dashboard | Real time data panel of current system |
| thread | View the thread stack information of the current JVM |
| jvm | View information about the current JVM |
| sysprop | View and modify the system properties of the JVM |
| sysenv | View the environment variables for the JVM |
| vmoption | View and modify diagnostic related option s in the JVM |
| perfcounter | View Perf Counter information of the current JVM |
| logger | Viewing and modifying logger s |
| getstatic | View static properties of a class |
| ognl | Execute ognl expression |
| mbean | View Mbean information |
| heapdump | dump java heap, similar to the heap dump function of jmap command |
| vmtool | Query the object from the jvm and execute forceGc |
dashboard
[arthas@126997]$ dashboard
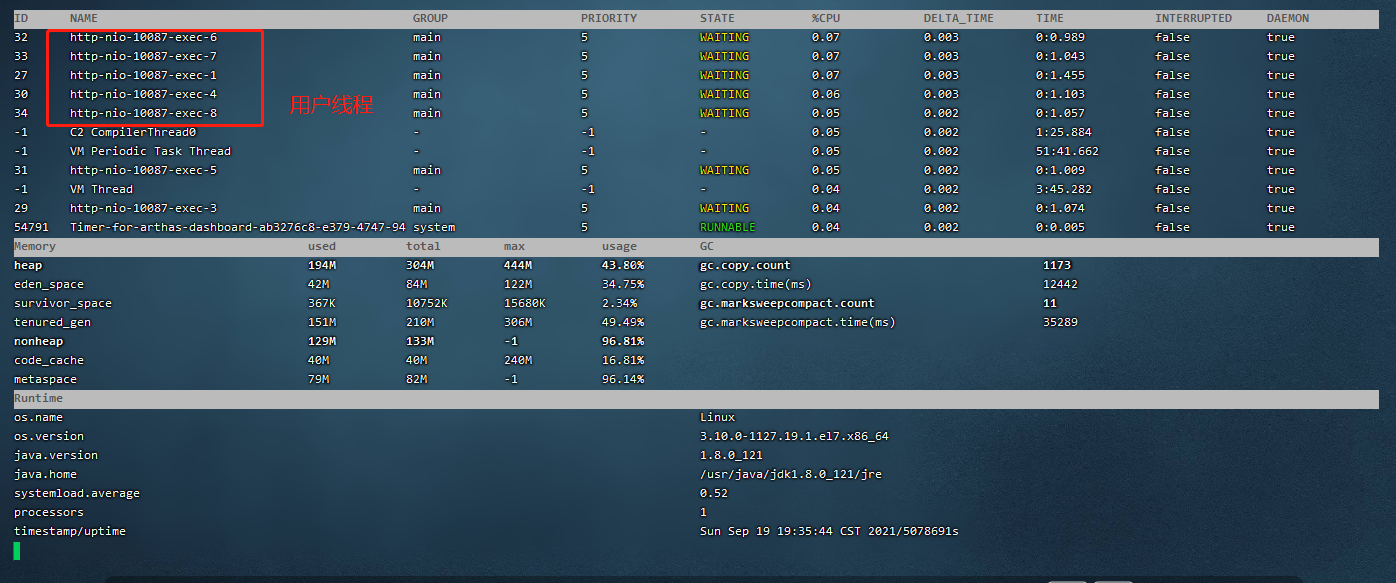
The first area mainly displays the operation of cpu. Through this area, we can observe the threads that occupy cpu, such as deadlock and dead loop
The main view is HTTP NiO XXX exec XX. Generally, the user thread accesses our system
thread
From the above figure, we can see that there is something wrong with the main thread, so we use the thread command to view the jvm stack information of the thread
Syntax: thread id
[arthas@126997]$ thread 1
"main" Id=1 TIMED_WAITING
    at java.lang.Thread.sleep(Native Method)
    at java.lang.Thread.sleep(Thread.java:340)
    at java.util.concurrent.TimeUnit.sleep(TimeUnit.java:386)
    at demo.MathGame.main(MathGame.java:17)
After reading the above code, we can find that Thread.sleep is mainly called internally, and the specific code location causing the delay is also displayed
at demo.MathGame.main(MathGame.java:17)
thread -n 3 view the current top n busiest threads and print the stack
JVM internal information
[arthas@126997]$ jvm
Main concerns:
THREAD related
- Count: the number of threads currently active in the JVM
- Daemon-count: the number of daemon threads currently active in the JVM
- PEAK-COUNT: the maximum number of threads that have been alive since the JVM was started
- STARTED-COUNT: the total number of threads started since the JVM was started
- Deadlock-count: number of threads currently deadlocked by the JVM (key)
File descriptor related
- MAX-FILE-DESCRIPTOR-COUNT: the maximum number of file descriptors that a JVM process can open
- OPEN-FILE-DESCRIPTOR-COUNT: the number of file descriptors currently open by the JVM
getstatic
View member variables
Syntax: getstatic classpath variable name
getstatic demo.MathGame random
For example, suppose n is a Map and the key of the Map is Enum. If we want to query the value of the key corresponding to the Map, we can write the following command
$ getstatic com.alibaba.arthas.Test n 'entrySet().iterator.{? #this.key.name()=="STOP"}'
field: n
@ArrayList[
    @Node[STOP=bbb],
]
Affect(row-cnt:1) cost in 68 ms.
If the key is not an object, then
$ getstatic com.alibaba.arthas.Test m 'entrySet().iterator.{? #this.key=="a"}'
field: m
@ArrayList[
    @Node[a=aaa],
]
Gets the static field of the static class
Syntax: ognl '@ classpath @ static variable'
ognl '@demo.MathGame@random'
class/classloader related
| NAME | DESCRIPTION |
|---|---|
| sc | View the class information loaded by the JVM |
| sm | View the method information of the loaded class |
| jad | Decompile the source code of the specified loaded class |
| mc | Memory compiler, which compiles. java files into. class files |
| retransform | Load the external. class file and retransform it into the JVM |
| dump | dump has loaded the byte code of the class to a specific directory |
| classloader | View the inheritance tree, urls and class loading information of the classloader, and use the classloader to get resource |
sc
Fuzzy search, search all class files in the demo directory
[arthas@126997]$ sc demo.*
demo.MathGame
Affect(row-cnt:1) cost in 12 ms.
Print the details of the class. You can know whether the file is an interface, an enumeration, or an abstract... Type
[arthas@126997]$ sc -d demo.MathGame
 class-info        demo.MathGame
 code-source       /usr/src/java/math-game.jar
 name              demo.MathGame
 isInterface       false
 isAnnotation      false
 isEnum            false
 isAnonymousClass  false
 isArray           false
 isLocalClass      false
 isMemberClass     false
 isPrimitive       false
 isSynthetic       false
 simple-name       MathGame
 modifier          public
 annotation
 interfaces
 super-class       +-java.lang.Object
 class-loader      +-sun.misc.Launcher$AppClassLoader@5c647e05
                     +-sun.misc.Launcher$ExtClassLoader@677327b6
 classLoaderHash   5c647e05

Affect(row-cnt:1) cost in 10 ms.
Print out the Field information of the class, and you can query the variables and specific types in the class
[arthas@126997]$ sc -d -f demo.MathGame
 class-info        demo.MathGame
 code-source       /usr/src/java/math-game.jar
 name              demo.MathGame
 isInterface       false
 isAnnotation      false
 isEnum            false
 isAnonymousClass  false
 isArray           false
 isLocalClass      false
 isMemberClass     false
 isPrimitive       false
 isSynthetic       false
 simple-name       MathGame
 modifier          public
 annotation
 interfaces
 super-class       +-java.lang.Object
 class-loader      +-sun.misc.Launcher$AppClassLoader@5c647e05
                     +-sun.misc.Launcher$ExtClassLoader@677327b6
 classLoaderHash   5c647e05
 fields            name     random
                   type     java.util.Random
                   modifier private,static
                   value    java.util.Random@2a9d2ddf

                   name     illegalArgumentCount
                   type     int
                   modifier private


Affect(row-cnt:1) cost in 7 ms.
sm
Print all method information in the class
(5) No return value
[arthas@126997]$ sm   demo.MathGame
demo.MathGame <init>()V
demo.MathGame main([Ljava/lang/String;)V
demo.MathGame run()V
demo.MathGame print(ILjava/util/List;)V
demo.MathGame primeFactors(I)Ljava/util/List;
Affect(row-cnt:5) cost in 8 ms.
heapdump
[arthas@126997]$ heapdump  /usr/src/java/arthas-output/dump.hprof
Dumping heap to /usr/src/java/arthas-output/dump.hprof ...
Heap dump file created
Outputs the current stack information to the specified file
jad
Decompile class
The jad command decompiles the byte code of the class actually running in the JVM into java code to facilitate you to understand the business logic;
- On the Arthas Console, the decompiled source code is highlighted with syntax, which is more convenient to read
- Of course, the decompiled java code may have syntax errors, but it will not affect your reading and understanding
jad demo.MathGame
By default, the decompilation result will contain ClassLoader information. Only the source code can be printed through the -- source only option.
jad --source-only demo.MathGame
Decompile the specified function (method)
jad --source-only demo.MathGame main
Specify ClassLoader when decompiling
When multiple classloaders load this class, the jad command will output the hashcode corresponding to the ClassLoader instance. Then you just need to re execute the jad command and use the parameter - C < hashcode > to decompile the class loaded by the specified ClassLoader
$ jad org.apache.log4j.Logger

Found more than one class for: org.apache.log4j.Logger, Please use jad -c hashcode org.apache.log4j.Logger
HASHCODE  CLASSLOADER
69dcaba4  +-monitor's ModuleClassLoader
6e51ad67  +-java.net.URLClassLoader@6e51ad67
            +-sun.misc.Launcher$AppClassLoader@6951a712
            +-sun.misc.Launcher$ExtClassLoader@6fafc4c2
2bdd9114  +-pandora-qos-service's ModuleClassLoader
4c0df5f8  +-pandora-framework's ModuleClassLoader

Affect(row-cnt:0) cost in 38 ms.
$ jad org.apache.log4j.Logger -c 69dcaba4
monitor/watch/trace related
Please note that these commands are implemented through bytecode enhancement technology. Some aspects will be inserted into the methods of the specified class to realize data statistics and observation. Therefore, when online and pre issued for use, please try to clarify the classes, methods and conditions to be observed. After diagnosis, stop or reset the enhanced class.
| NAME | DESCRIPTION |
|---|---|
| monitor | Method. |
| watch | Methods perform data observation |
| trace | Method calls the path internally and outputs the time-consuming data on each node on the method path |
| stack | Output the call path where the current method is called |
| tt | Method executes the spatiotemporal tunnel of data, records the input and return information of each call of the specified method, and can observe these different time calls |
monitor
Method. Note that it is not real-time monitoring. It will take a while to display after interface access
[arthas@51319]$ monitor  com.test.web.TestController test
Press Q or Ctrl+C to abort.
Affect(class count: 1 , method count: 1) cost in 45 ms, listenerId: 2
 timestamp                          class                                                method                                                total            success           fail              avg-rt(ms)       fail-rate
--------------------------------------------------------------------------------------------------------------------------------------------------------------------------------------------------------------------------------------
 2021-08-22 01:41:37                com.test.web.TestController                          test                                                  1                1                 0                 10013.89         0.00%
Dimension description of monitoring
| Monitoring item | explain |
|---|---|
| timestamp | time stamp |
| class | Java class |
| method | Method (construction method, general method) |
| total | Number of calls |
| success | Success times |
| fail | Number of failures |
| rt | Average RT |
| fail-rate | Failure rate |
watch
Method to perform data observation, so that you can easily observe the call of the specified method. The observable range is: return value, throw exception and enter parameter
Special note:
- The watch command defines four observation event points, that is, before the call of the - b method, - after the exception of the - e method, - after the return of the - s method, and after the end of the - f method
- The four observation event points - b, - e, - s are closed by default and - f are open by default. When the specified observation point is opened, the observation expression will be evaluated and output at the corresponding event point
- Attention should be paid to the difference between method input and method output. It may be modified in the middle, resulting in inconsistency. Except that -b event point params represents method input, other events represent method output
- When - b is used, the return value or exception does not exist because the observation event point is before the method call
- -x indicates that the deeper the observation method is, the more observations are made
Observe method output and return value
watch com.test.web.TestController test "{params,returnObj}" -x 2
Methods of observation
watch com.test.web.TestController test "{params,returnObj}" -x 2 -b
- The event point is before the method is executed, so the return value cannot be obtained
Observe both before method call and after method return
watch com.test.web.TestController test "{params,target,returnObj}" -x 2 -b -s -n 2
- In the parameter - n 2, it means that it is only executed twice
- Among the output results here, the first output is the result of the observation expression before the method call, and the second output is the result of the expression returned by the method
- The output order of the results is consistent with the sequence of events, independent of the order of - s -b in the command
Adjust the value of - x and observe the specific method parameter value
watch com.test.web.TestController test "{params,target}" -x 3
- -x indicates the traversal depth, which can be adjusted to print specific parameters and results. The default value is 1.
Examples of conditional expressions
watch demo.MathGame primeFactors "{params[0],target}" "params[0]<0"
- Only calls that meet the conditions will have a response.
Examples of observing abnormal information
watch demo.MathGame primeFactors "{params[0],throwExp}" -e -x 2
- -e means it is triggered when an exception is thrown
- In express, the variable representing exception information is throwExp
Filter by time
watch com.test.web.TestController test '{params, returnObj}' '#cost>200' -x 2
- #Cost > 200 (unit: ms) means that it will be output only when the time is greater than 200ms, and calls with execution time less than 200ms will be filtered out
Observe the attributes in the current object
If you want to view the properties in the current object before and after the method runs, you can use the target keyword to represent the current object, and then. Specific properties
watch demo.MathGame primeFactors 'target.illegalArgumentCount'
trace
Method calls the path internally and outputs the time-consuming data on each node on the method path
trace com.test.web.TestController test
If the method is called many times and I only want to see it once, I can use the - n parameter to specify the number of times to capture the result
Column: exit the command after capturing one call.
trace com.test.web.TestController test -n 1
By default, trace does not include function calls in the jdk. If you want to use the functions in trace jdk, you need to explicitly set -- skipJDKMethod false.
Columns:
trace --skipJDKMethod false com.test.web.TestController test -n 1
Filter according to call time
Column: only call paths that take more than 100ms will be displayed, which helps to focus only on exceptions when troubleshooting problems
trace --skipJDKMethod false com.test.web.TestController test -n 1 '#cost > 100'
effect:
Press Q or Ctrl+C to abort.
Affect(class count: 1 , method count: 1) cost in 56 ms, listenerId: 8
`---ts=2021-08-22 02:14:07;thread_name=http-nio-8080-exec-5;id=14;is_daemon=true;priority=5;TCCL=org.springframework.boot.web.embedded.tomcat.TomcatEmbeddedWebappClassLoader@3f200884
    `---[10001.37477ms] com.test.web.TestController:test()
        `---[10001.261073ms] java.lang.Thread:sleep() #32

Command execution times exceed limit: 1, so command will exit. You can set it with -n option.
You can see directly where the specific problem is - [10001.261073ms] java.lang.Thread:sleep() #32`
There is a problem of inaccurate statistics, that is, the total time of all methods may be less than the total time of the monitoring method. This is because the logic of Arthas will take some time
trace multiple classes or functions
The regular table can be used to match the functions of multiple classes on the path to achieve the effect of multi-layer trace to a certain extent
Syntax: trace -E com.test.ClassA|org.test.ClassB method1|method2|method3
Enhanced depth subfunction
[arthas@59161]$ trace  --skipJDKMethod false  demo.MathGame run  '#cost > 1'
Press Q or Ctrl+C to abort.
Affect(class count: 1 , method count: 1) cost in 112 ms, listenerId: 1
`---ts=2020-07-09 16:48:11;thread_name=main;id=1;is_daemon=false;priority=5;TCCL=sun.misc.Launcher$AppClassLoader@3d4eac69
    `---[1.389634ms] demo.MathGame:run()
        `---[0.123934ms] demo.MathGame:primeFactors() #24 [throws Exception]
Now, if you want to go deep into the sub function primeFactors, you can open a new terminal 2 and specify listenerId when tracing primeFactors.
trace  --skipJDKMethod false demo.MathGame primeFactors --listenerId 1    '#cost > 1'
Press Q or Ctrl+C to abort.
Affect(class count: 1 , method count: 1) cost in 34 ms, listenerId: 1
At this time, the result printed by terminal 2 indicates that a function: effect (class count: 1, method count: 1) has been enhanced, but no more results will be printed.
Then, when you return to window 1, you will find that the situation inside the primeFactors sub method is printed
`---ts=2021-08-22 02:31:05;thread_name=main;id=1;is_daemon=false;priority=5;TCCL=sun.misc.Launcher$AppClassLoader@5c647e05
    `---[5.965261ms] demo.MathGame:run()
        +---[0.037123ms] java.util.Random:nextInt() #23
        +---[1.081993ms] demo.MathGame:primeFactors() #24
        |   `---[1.033554ms] demo.MathGame:primeFactors()
        |       +---[0.004457ms] java.util.ArrayList:<init>() #49
        |       `---[min=0.002653ms,max=0.486761ms,total=0.504237ms,count=6] java.util.List:add() #53
        `---[0.474074ms] demo.MathGame:print() #25
Note that window 2 cannot end, otherwise the sub method content monitoring in window 1 will not be displayed
stack
Output the call path where the current method is called
Many times we know that a method is executed, but there are many execution paths for this method, or you don't know where the method is executed. At this time, you need the stack command.
Columns:
[arthas@46551]$ stack demo.MathGame run
Press Q or Ctrl+C to abort.
Affect(class count: 1 , method count: 1) cost in 50 ms, listenerId: 16
ts=2021-08-22 02:48:47;thread_name=main;id=1;is_daemon=false;priority=5;TCCL=sun.misc.Launcher$AppClassLoader@5c647e05
    @demo.MathGame.run()
        at demo.MathGame.main(null:-1)
You can see that the run method is called by main
Source code
    public static void main(String[] args) throws InterruptedException {
        MathGame game = new MathGame();
        do {
            game.run();
            TimeUnit.SECONDS.sleep(1L);
        } while (true);
    }

    public void run() throws InterruptedException {//primeFactors...}
    public List<Integer> primeFactors(int number) {//...}
You can see that primeFactors is called by run() and run() is called by main()
Filter according to execution time
[arthas@46551]$ stack demo.MathGame primeFactors '#cost>5'
Press Ctrl+C to abort.
Affect(class-cnt:1 , method-cnt:1) cost in 35 ms.
ts=2018-12-04 01:35:58;thread_name=main;id=1;is_daemon=false;priority=5;TCCL=sun.misc.Launcher$AppClassLoader@3d4eac69
    @demo.MathGame.run()
        at demo.MathGame.main(MathGame.java:16)
tt
[arthas@46551]$ tt -t demo.MathGame primeFactors  -n 3
Press Q or Ctrl+C to abort.
Affect(class count: 1 , method count: 1) cost in 49 ms, listenerId: 17
 INDEX         TIMESTAMP                           COST(ms)          IS-RET        IS-EXP        OBJECT                     CLASS                                                 METHOD
--------------------------------------------------------------------------------------------------------------------------------------------------------------------------------------------------------------------------------------
 1000          2021-08-22 02:55:16                 0.344552          false         true          0x15aeb7ab                 MathGame                                              primeFactors
 1001          2021-08-22 02:55:17                 1.275065          true          false         0x15aeb7ab                 MathGame                                              primeFactors
-
Command parameter parsing
-
-t
The tt command has many main arguments, - t is one of them. This parameter indicates that you want to record each execution of the primeFactors method of class * MathGame.
-
-n 3
When you execute a method with low call volume, you may still have enough time to interrupt the process recorded by tt command with CTRL+C, but if you encounter a method with very large call volume, your JVM memory can burst in an instant.
At this time, you can specify the number of times you need to record through the - n parameter. When the number of times you need to record is reached, Arthas will actively interrupt the recording process of tt command to avoid the situation that manual operation cannot be stopped.
-
-
Table field description
| Table fields | Field interpretation |
|---|---|
| INDEX | Time segment record number. Each number represents a call. Many subsequent tt commands specify record operations based on this number, which is very important. |
| TIMESTAMP | Method, which records the local time of this time segment |
| COST(ms) | Time consuming method execution |
| IS-RET | Whether the method ends as a normal return |
| IS-EXP | Whether the method ends with an exception thrown |
| OBJECT | Execute the hashCode() of the object. Note that someone once mistakenly thought it was the memory address of the object in the JVM, but unfortunately it was not. But it can help you simply mark the class entity of the current execution method |
| CLASS | Class name of execution |
| METHOD | The name of the method to execute |
-
Conditional expression
I wonder if you have encountered the following confusion in the process of use
- It seems difficult for Arthas to distinguish overloaded methods
- I only need to observe specific parameters, but tt records them all for me
Conditional expressions are also written in OGNL, and the core judgment object is still the Advice object. In addition to the tt command, the watch, trace, and stack commands also support conditional expressions.
-
Solution overload
tt -t demo.MathGame primeFactors params.length==1
You can solve different method signatures by specifying the number of parameters. If the number of parameters is the same, you can also write this
tt -t demo.MathGame primeFactors 'params[1] instanceof Integer'
Retrieve call records
When you record a large time segment with tt, you want to filter out the time segment you need. At this time, you need to retrieve the existing records.
Suppose we have these records
$ tt -l
 INDEX   TIMESTAMP            COST(ms)  IS-RET  IS-EXP   OBJECT         CLASS                          METHOD
-------------------------------------------------------------------------------------------------------------------------------------
 1000    2018-12-04 11:15:38  1.096236  false   true     0x4b67cf4d     MathGame                       primeFactors
 1001    2018-12-04 11:15:39  0.191848  false   true     0x4b67cf4d     MathGame                       primeFactors
 1002    2018-12-04 11:15:40  0.069523  false   true     0x4b67cf4d     MathGame                       primeFactors
 1003    2018-12-04 11:15:41  0.186073  false   true     0x4b67cf4d     MathGame                       primeFactors
 1004    2018-12-04 11:15:42  17.76437  true    false    0x4b67cf4d     MathGame                       primeFactors
                              9
 1005    2018-12-04 11:15:43  0.4776    false   true     0x4b67cf4d     MathGame                       primeFactors
Affect(row-cnt:6) cost in 4 ms.
I need to filter out the calling information of the primeFactors method
$ tt -s 'method.name=="primeFactors"'
View call information
For the information of a specific time slice, you can view its details through the - i parameter followed by the corresponding INDEX number.
$ tt -i 1003
 INDEX            1003
 GMT-CREATE       2018-12-04 11:15:41
 COST(ms)         0.186073
 OBJECT           0x4b67cf4d
 CLASS            demo.MathGame
 METHOD           primeFactors
 IS-RETURN        false
 IS-EXCEPTION     true
 PARAMETERS[0]    @Integer[-564322413]
 THROW-EXCEPTION  java.lang.IllegalArgumentException: number is: -564322413, need >= 2
                      at demo.MathGame.primeFactors(MathGame.java:46)
                      at demo.MathGame.run(MathGame.java:24)
                      at demo.MathGame.main(MathGame.java:16)

Affect(row-cnt:1) cost in 11 ms.
Redo call
After you make some adjustments, you may need the front-end system to trigger your call again. At this time, you have to ask grandpa and grandma to launch a call again. In some scenarios, this call is not so easy to trigger.
tt command saves all the field information called at that time, so we can initiate a call on a time slice with INDEX number on our own initiative, so as to liberate your communication cost. At this point, you need the - p parameter. Specify the number of calls through -- replay times and the interval of multiple calls through -- replay interval (unit: ms, default: 1000ms)
tt -i 1004 -p
 RE-INDEX       1004
 GMT-REPLAY     2018-12-04 11:26:00
 OBJECT         0x4b67cf4d
 CLASS          demo.MathGame
 METHOD         primeFactors
 PARAMETERS[0]  @Integer[946738738]
 IS-RETURN      true
 IS-EXCEPTION   false
 COST(ms)         0.186073
 RETURN-OBJ     @ArrayList[
                    @Integer[2],
                    @Integer[11],
                    @Integer[17],
                    @Integer[2531387],
                ]
Time fragment[1004] successfully replayed.
Affect(row-cnt:1) cost in 14 ms.
You will find that the result may be the same, but the call path has changed from the original program to the call initiated by Arthas's own internal thread.
The Conduit
Background asynchronous task
Generate flame statistics
SVG renderings

HTMl renderings (recommended)
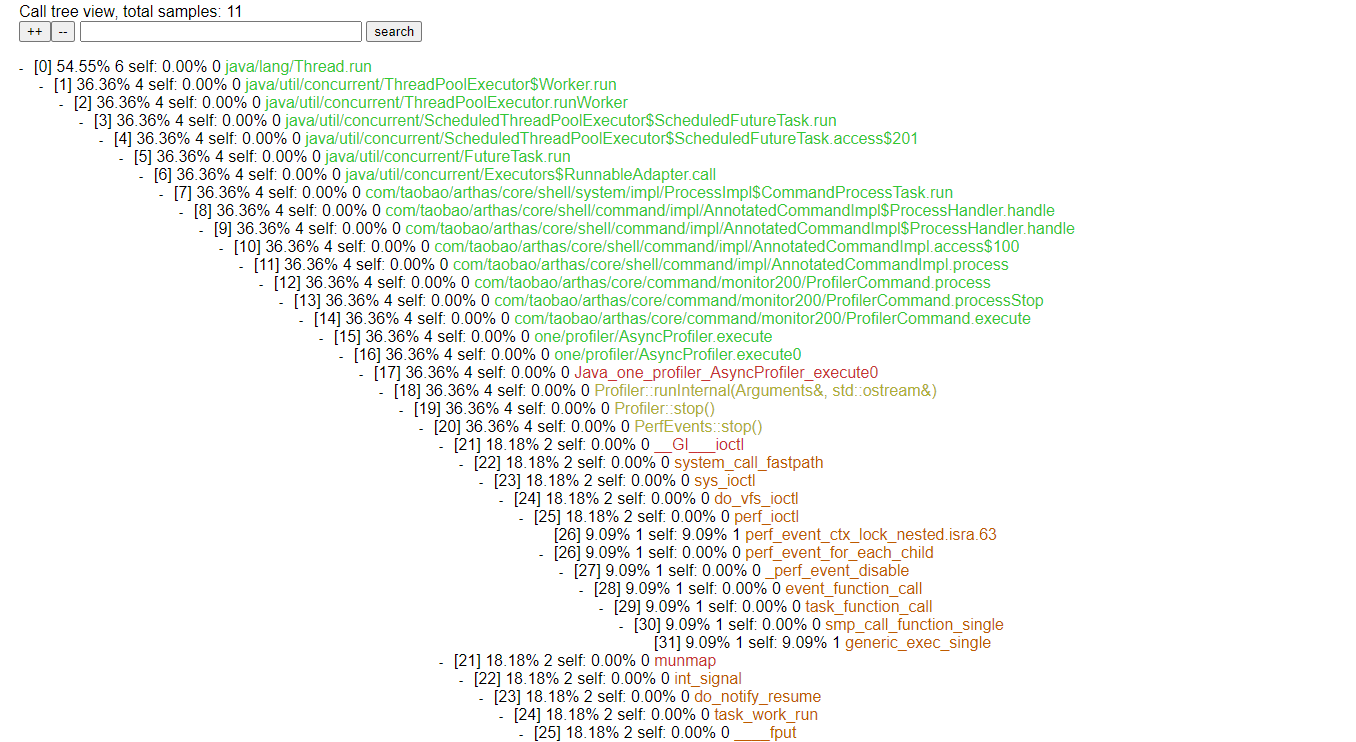
Start profiler
profiler start
By default, the flame diagram of cpu is generated, that is, event is cpu. It can be specified with the -- event parameter.
Get the number of sample s collected
profiler getSamples
View profiler status
profiler status
Stop profiler and generate avg file
profiler stop
Stop the profiler and generate an html file
profiler stop --format html
Online dynamic hot compilation
This is different from the online tutorial. The online tutorial uses jad + mc + retransform for online hot update,
But I found that many times when using mc, the compilation process always failed, and then I summarized a set of solutions myself
- Using IDEA... Software can compile the project into. class files
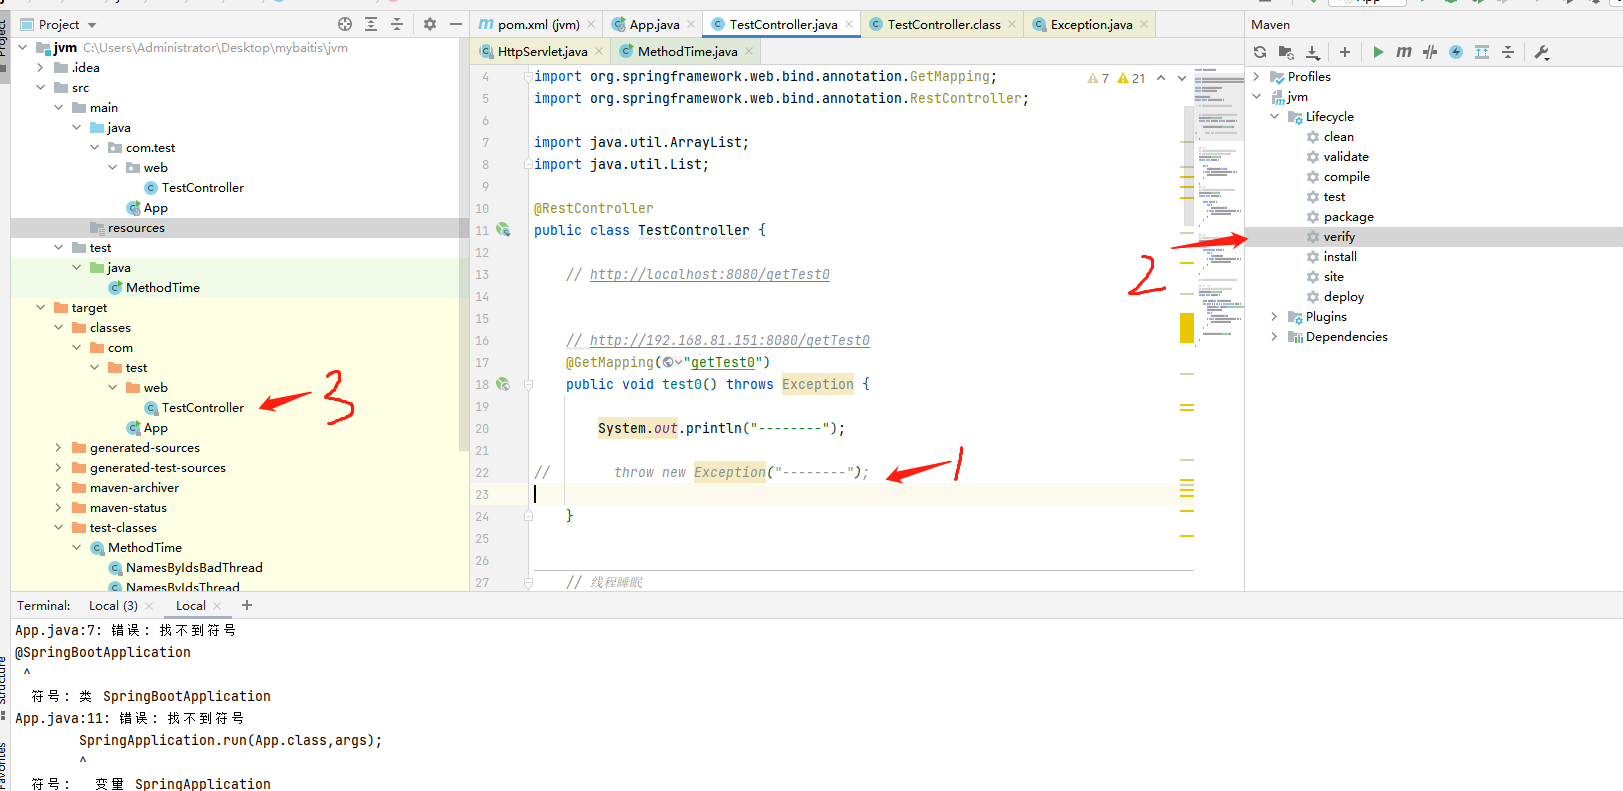
Then copy the code to linux CD / usr / SRC / Java / Arthas output
-
Use retransform to replace the code in the JVM
[arthas@14001]$ retransform  /usr/src/java/arthas-output/TestController.class
retransform success, size: 1, classes:
retransform restrictions
- New addition of field (member variable) / method (method in class) is not allowed
- The running function cannot take effect without exiting. For example, the newly added System.out.println below, only those in the run() function will take effect
public class MathGame {
    public static void main(String[] args) throws InterruptedException {
        MathGame game = new MathGame();
        while (true) {
            game.run();
            TimeUnit.SECONDS.sleep(1);
            // This does not work because the code is always running in while
            System.out.println("in loop");
        }
    }

    public void run() throws InterruptedException {
        // This works because the run() function can end completely every time
        System.out.println("call run()");
        try {
            int number = random.nextInt();
            List<Integer> primeFactors = primeFactors(number);
            print(number, primeFactors);

        } catch (Exception e) {
            System.out.println(String.format("illegalArgumentCount:%3d, ", illegalArgumentCount) + e.getMessage());
        }
    }
Note: retransform modifies the memory, not the source code. It will be restored after the system is restarted, so it can only be used for testing or temporary coping
If you want to act directly on the jar source code and jvm, you can use redefine instead
Like - collect - pay attention - easy to review and receive the latest content in the future If you have other questions to discuss in the comment area - or send me a private letter - you will reply as soon as you receive them In case of infringement, please contact me by private letter Thank you for your cooperation. I hope my efforts will be helpful to you^_^