Principle:
Choose appropriate tools based on monitoring content and scenarios
Tool list
Docker CLI
The docker container stats command displays the real-time usage of container resources.
- Start a container: docker container run - name db -d arungupta/couchbase
- Check the status of the container using docker container stats db. The following information will be displayed

The output is continually updated. It shows:
- Container name
- Percent CPU utilization
- Total memory usage vs amount available to the container
- Percent memory utilization
- Network activity
- Disk activity
- PIDS??
3: Start another container: docker container run -d name web jboss/wildfly
4. Use the docker container stats db web. command to check the statistics of the two containers. The output information is as follows: 
5. Check the statistics of all containers. docker container stats 
Note that in this case the container ID is displayed, not the name of the container.
6. Use only the command docker container stats format "{Container}: {CPUPerc}": Display container ID and percentage CPU utilization
88b04695855e: 0.14%
109d917d17e2: 4.83%
7: Output in the formatting table. The results should include container name, CPU utilization percentage and memory utilization. This can be done using commands. docker container stats - format "table {Name} \ t {CPUPerc} \ t {MemUsage}":
NAME                CPU %               MEM USAGE / LIMIT
web                 0.13%               266.1 MiB / 1.952 GiB
db                  3.06%               398.9 MiB / 1.952 GiB
8. Use commands only to display the first result docker container stats - no-stream 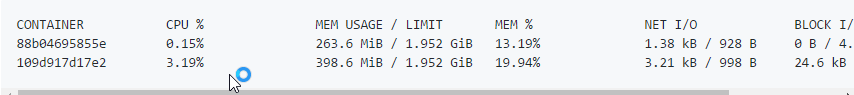
Docker Remote API
The Docker Remote API provides more detailed information about how the container works. It can be invoked in the following format:
curl –unix-socket /var/run/docker.sock http://localhost/containers//stats
On Docker for Mac, enabling the remote HTTP API still requires several steps. So this command calls the Remote API using the unix-socket option.
Use specific calls:
curl –unix-socket /var/run/docker.sock http://localhost/containers/db/stats . The following output will be generated:
{"read":"2017-02-28T02:40:29.595511475Z","preread":"0001-01-01T00:00:00Z","pids_stats":{"current":220},"blkio_stats":{"io_service_bytes_recursive":[{"major":254,"minor":0,"op":"Read","value":212992},{"major":254,"minor":0,"op":"Write","value":1339392},{"major":254,"minor":0,"op":"Sync","value":1257472},{"major":254,"minor":0,"op":"Async","value":294912},{"major":254,"minor":0,"op":"Total","value":1552384}],"io_serviced_recursive":[{"major":254,"minor":0,"op":"Read","value":3},{"major":254,"minor":0,"op":"Write","value":249},{"major":254,"minor":0,"op":"Sync","value":230},{"major":254,"minor":0,"op":"Async","value":22},{"major":254,"minor":0,"op":"Total","value":252}],"io_queue_recursive":[],"io_service_time_recursive":[],"io_wait_time_recursive":[],"io_merged_recursive":[],"io_time_recursive":[],"sectors_recursive":[]},"num_procs":0,"storage_stats":{},"cpu_stats":{"cpu_usage":{"total_usage":83724160991,"percpu_usage":[30641144914,10843586791,11798818901,30440610385],"usage_in_kernelmode":12390000000,"usage_in_usermode":15170000000},"system_cpu_usage":132730290000000,"throttling_data":{"periods":0,"throttled_periods":0,"throttled_time":0}},"precpu_stats":{"cpu_usage":{"total_usage":0,"usage_in_kernelmode":0,"usage_in_usermode":0},"throttling_data":{"periods":0,"throttled_periods":0,"throttled_time":0}},"memory_stats":{"usage":419139584,"max_usage":426778624,"stats":{"active_anon":404185088,"active_file":20480,"cache":1589248,"dirty":12288,"hierarchical_memory_limit":9223372036854771712,"hierarchical_memsw_limit":9223372036854771712,"inactive_anon":0,"inactive_file":1568768,"mapped_file":122880,"pgfault":226379,"pgmajfault":2,"pgpgin":202886,"pgpgout":103818,"rss":404193280,"rss_huge":0,"swap":0,"total_active_anon":404185088,"total_active_file":20480,"total_cache":1589248,"total_dirty":12288,"total_inactive_anon":0,"total_inactive_file":1568768,"total_mapped_file":122880,"total_pgfault":226379,"total_pgmajfault":2,"total_pgpgin":202886,"total_pgpgout":103818,"total_rss":404193280,"total_rss_huge":0,"total_swap":0,"total_unevictable":0,"total_writeback":0,"unevictable":0,"writeback":0},"limit":2095898624},"name":"/db","id":"109d917d17e241713341b3d03470444c0144510f1e6de726eb72e1d6786a3e5d","networks":{"eth0":{"rx_bytes":3342,"rx_packets":57,"rx_errors":0,"rx_dropped":0,"tx_bytes":998,"tx_packets":13,"tx_errors":0,"tx_dropped":0}}}As you can see, more details about container health are shown below. These statistics are refreshed every second. Continuous refresh can be terminated using Ctrl + C
Docker Events
docker system events, providing real-time events for Docker hosts
- In a terminal (T1), enter docker system events. His command does not display the output and waits for any events worth reporting. The list of events is listed in
https://docs.docker.com/engine/reference/commandline/events/#/extended-description - In the new terminal (T2), kill the container in use. Docker container rm-f Web
- T1 displays the updated event list as follows:
2017-02-27T18:48:30.413053776-08:00 container kill 88b04695855ecf5390e57a6955a25f1ff507f7b066c2cd6397a5773a9e7e683f (build-date=20161214, image=jboss/wildfly, license=GPLv2, name=web, signal=9, vendor=CentOS)
2017-02-27T18:48:30.551760207-08:00 container die 88b04695855ecf5390e57a6955a25f1ff507f7b066c2cd6397a5773a9e7e683f (build-date=20161214, exitCode=137, image=jboss/wildfly, license=GPLv2, name=web, vendor=CentOS)
2017-02-27T18:48:30.954543362-08:00 network disconnect 83f14a590c9b8875cca8d050d47ec1e0dbff6db67180a56571496cadbe579e10 (container=88b04695855ecf5390e57a6955a25f1ff507f7b066c2cd6397a5773a9e7e683f, name=bridge, type=bridge)
2017-02-27T18:48:31.192092236-08:00 container destroy 88b04695855ecf5390e57a6955a25f1ff507f7b066c2cd6397a5773a9e7e683f (build-date=20161214, image=jboss/wildfly, license=GPLv2, name=web, vendor=CentOS)
The output shows a list of events, one per line. The events shown here are container kill, container die, network disconnect and container destroy. The date and time stamps for each event are displayed at the beginning of the line. Other event-specific information is also displayed.
4. In T2, create a new container: docker container run-d-name web jboss/wildfly
5. The output in T1 is updated to display:
2017-02-27T18:49:24.218079500-08:00 container create 3cc3e2bf3c43e278e0e4bd2ea238a829610d0a620ab069010b4881c1bf8e096e (build-date=20161214, image=jboss/wildfly, license=GPLv2, name=web, vendor=CentOS)
2017-02-27T18:49:24.383788816-08:00 network connect 83f14a590c9b8875cca8d050d47ec1e0dbff6db67180a56571496cadbe579e10 (container=3cc3e2bf3c43e278e0e4bd2ea238a829610d0a620ab069010b4881c1bf8e096e, name=bridge, type=bridge)
2017-02-27T18:49:24.930142017-08:00 container start 3cc3e2bf3c43e278e0e4bd2ea238a829610d0a620ab069010b4881c1bf8e096e (build-date=20161214, image=jboss/wildfly, license=GPLv2, name=web, vendor=CentOS)
The list of events shown here is container creation, network connection, and container start.
Using filters in Event
You can use the specified filter to restrict the list of events, - filter or - f options. Currently supported filters are:
- container (container=)
- daemon (daemon=)
- event (event=)
- image (image=)
- label (label= or label==)
- network (network=)
- plugin (plugin=)
- type (type=)
- volume (volume=)
Let's use these filters:
- Display container events by name
In T1, enter: docker system events-f container = db.

In T2, enter: docker container rm-f web to terminate the web container

But in T1, there was no update, because he only listened to the db container.
2. Display events according to the type of event
- In T1, enter the command: docker system events-f event = create.
- In T2, create a container: docker container run-d-name web2
jboss/wildfly - T1 shows the message that created a container
2017-02-28T12:55:45.631795937-08:00 container create 4728dab7c27816351423d64e60adf21a0246c1006b1131655d8b66fc82e8b324 (build-date=20161214, image=jboss/wildfly, license=GPLv2, name=dreamy_lamport, vendor=CentOS)- Terminate a container in T2: docker container rm-f web2
- T1 does not display any other events, because it only looks for create events
- For more examples, please move on:
https://docs.docker.com/engine/reference/commandline/events/#/filter-events-by-criteria.
Not finished, please move on to the next blog
How can we monitor (2)?