Recently, I changed my notebook. In the new working environment, the jmap command is reporting errors, while jps, jstat, jinfo and jstack can be used normally, so the problem of process number is preliminarily eliminated.
Attaching to core 17536 from executable heap, please wait...
Error attaching to core file: Windbg Error: OpenDumpFile failed!
sun.jvm.hotspot.debugger.DebuggerException: Windbg Error: OpenDumpFile failed!
        at sun.jvm.hotspot.debugger.windbg.WindbgDebuggerLocal.attach0(Native Method)
        at sun.jvm.hotspot.debugger.windbg.WindbgDebuggerLocal.attach(WindbgDebuggerLocal.java:160)
        at sun.jvm.hotspot.HotSpotAgent.attachDebugger(HotSpotAgent.java:673)
        at sun.jvm.hotspot.HotSpotAgent.setupDebuggerWin32(HotSpotAgent.java:569)
        at sun.jvm.hotspot.HotSpotAgent.setupDebugger(HotSpotAgent.java:335)
        at sun.jvm.hotspot.HotSpotAgent.go(HotSpotAgent.java:304)
        at sun.jvm.hotspot.HotSpotAgent.attach(HotSpotAgent.java:156)
        at sun.jvm.hotspot.tools.Tool.start(Tool.java:191)
        at sun.jvm.hotspot.tools.Tool.execute(Tool.java:118)
        at sun.jvm.hotspot.tools.PMap.main(PMap.java:72)
        at sun.reflect.NativeMethodAccessorImpl.invoke0(Native Method)
        at sun.reflect.NativeMethodAccessorImpl.invoke(NativeMethodAccessorImpl.java:62)
        at sun.reflect.DelegatingMethodAccessorImpl.invoke(DelegatingMethodAccessorImpl.java:43)
        at java.lang.reflect.Method.invoke(Method.java:498)
        at sun.tools.jmap.JMap.runTool(JMap.java:201)
        at sun.tools.jmap.JMap.main(JMap.java:130)
At the same time, we tried jmap heap xxx x, a non-existent process number (burying a pit here first), or reported the same error. According to the information of exception stack, we suspect that the command line under Windows does not have administrator privileges and can not access dump files, so we tried to run CMD by administrator, then jmap heap, but still reported the same error. The wrong thing: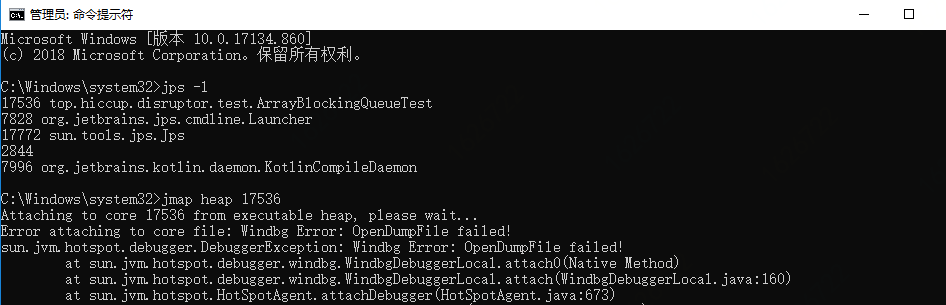
This is helpless, Baidu, stack overflow wandered around and did not find a way to solve the problem.. Let's put it on first?
I don't know how long it took, but I suddenly thought to myself - "Did you not strike the right order?" Jmap-h walks through a wave, carefully looks at the red box content in the screenshot, and then lowers his head in shame (it must be the Mid-Autumn Moon Cake that caused, uh!)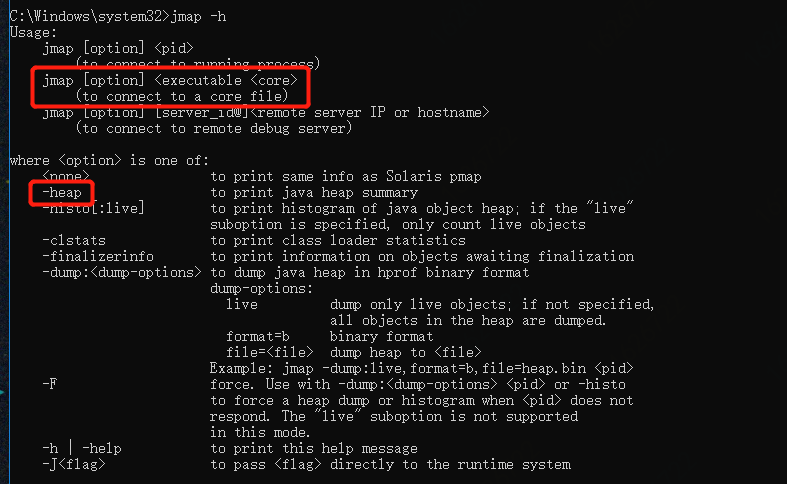
Fig. jmap has three uses. 1. Connect the running process 2. Analyse the core file, that is, dump file 3. Connect the JVM process of other machines. So the problem with the above jmap heap XXXX command is forgetting to add "-", which is regarded by jmap as a snapshot file to analyze the "heap", so it is reasonable to report errors.
Conclusion:
In the toolkit that comes with JDK, commands like jps, jmap, jstack, etc., specify that the option is always with "-", while the parameters that follow are not with bars, which needs to be kept in mind. There is also an unusual report. Don't panic. You must read the abnormal information and abnormal stack carefully. In this case, the first line has already been clear.