ELk introduction
E: Elasticsearch stores data java
 50: Logstash collection, filtering, forwarding, matching, large, slow start, middle role java
 K: Kibana filtering, analysis, graphic presentation java
 F: Filebeat collects logs and filters go
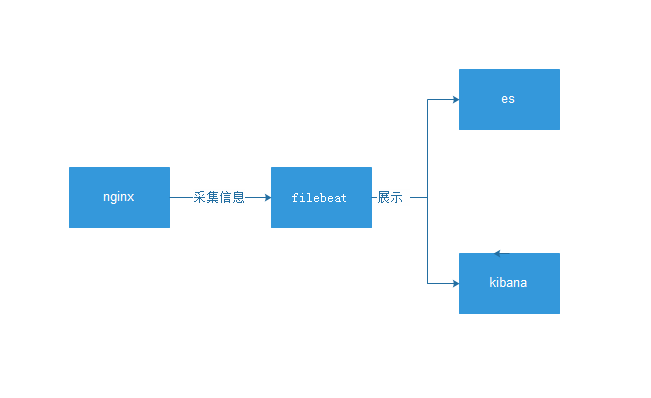
Basic architecture diagram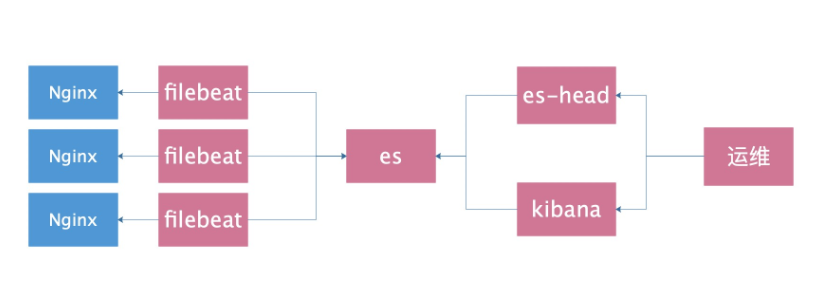
Traditional log analysis requirements (interview)
1. Find out the top ten IP addresses that visit the website most frequently
2. Find out the top 10 URL s for visiting websites
3. Find out the IP with the highest visit frequency of www website between 10:00 and 2:00 at noon
4. What is the change of visit frequency between yesterday and today
5. Compare the difference between last week's time and today's time
6. Find out how many times a specific page has been visited
7. Find out the IP address in question, and tell me what pages this IP address has visited. Did he come here a few days before the comparison? When does he start
When did you leave
8. Find out the top ten pages with the slowest access and count the average response time. Compared with yesterday, is the page access so slow?
9. Find out how many times each search engine grabbed today? Which pages were crawled? What is the response time?
10. Find out the IP address of the fake search engine
yum provides host
 Install package
 host +ip I can see if ip is camouflaged
Tell me the result in 11.5 minutes
Log collection classification
Proxy layer: nginx haproxy
 web layer: nginx tomcat java php
 db layer: mysql mongo redis es
System layer: message secure
 Storage tier: nfs gfs
deploy
ELK installation and deployment
Preparing a stand-alone environment
db01  nginx filebet es kibana es-head
db02  nginx filebet

1.es Stand alone environment preparation
cat >/etc/elasticsearch/elasticsearch.yml <<EOF
node.name: node-1
path.data: /var/lib/elasticsearch
path.logs: /var/log/elasticsearch
network.host: 10.0.0.51,127.0.0.1
http.port: 9200
EOF

systemctl stop elasticsearch
rm -rf /var/lib/elasticsearch/*
rm -rf /var/lib/kibana/*
systemctl start elasticsearch
systemctl start kibana
tail -f /var/log/elasticsearch/elasticsearch.log
netstat -lntup|egrep "5601|9200"
filebet collects logs in nginx normal format
ES
kibana
es-head
0.Update system time
ntpdate time1.aliyun.com
1.install Nginx
cat >/etc/yum.repos.d/nginx.repo <<EOF
[nginx-stable]
name=nginx stable repo
baseurl=http://nginx.org/packages/centos/\$releasever/\$basearch/
gpgcheck=1
enabled=1
gpgkey=https://nginx.org/keys/nginx_signing.key
module_hotfixes=true
[nginx-mainline]
name=nginx mainline repo
baseurl=http://nginx.org/packages/mainline/centos/\$releasever/\$basearch/
gpgcheck=1
enabled=0
gpgkey=https://nginx.org/keys/nginx_signing.key
module_hotfixes=true
EOF
yum install nginx -y
systemctl start nginx
curl 127.0.0.1
2.To configure Nginx And create a test page
rm -rf /etc/nginx/conf.d/default.conf
cat >/etc/nginx/conf.d/www.conf<<EOF
server {
listen 80;
server_name localhost;
location / {
root /code/www;
index index.html index.htm;
}
}
EOF
mkdir /code/www/ -p
echo "db01-www" > /code/www/index.html
nginx -t
systemctl restart nginx
curl 127.0.0.1
tail -f /var/log/nginx/access.log
2.install filebeat
rpm -ivh filebeat-6.6.0-x86_64.rpm
rpm -qc filebeat
3.To configure filebeat
[root@db-01 /data/soft]# cat /etc/filebeat/filebeat.yml
filebeat.inputs:
- type: log
enabled: true
paths:
- /var/log/nginx/access.log
output.elasticsearch:
hosts: ["10.0.0.51:9200"]
4.Start and check
systemctl start filebeat
tail -f /var/log/filebeat/filebeat
5.View log results
es-head See
curl -s 127.0.0.1:9200/_cat/indices|awk '{print $3}'
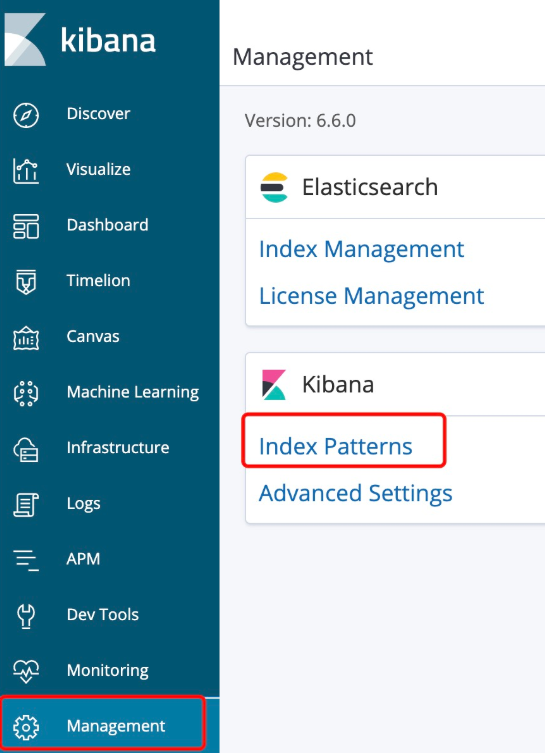
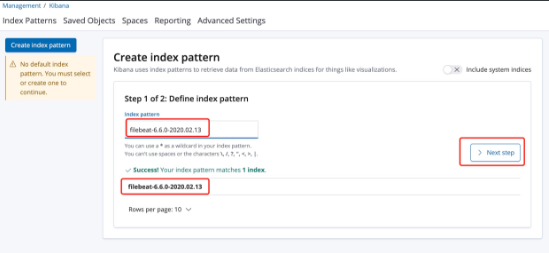
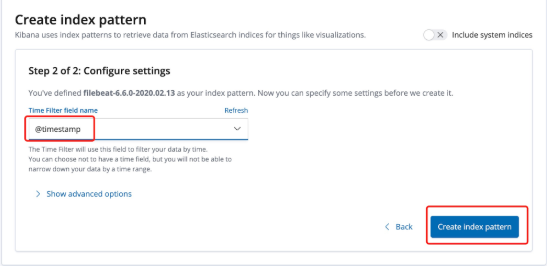
6.kibana Add index
Management-->kibana-->Index Patterns-->filebeat-6.6.0-2020.02.13kibana interface
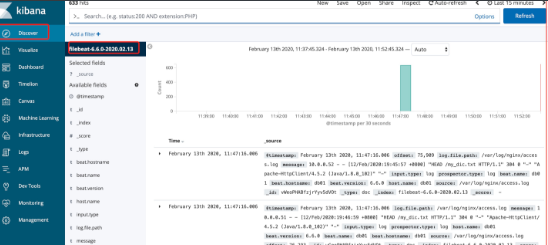
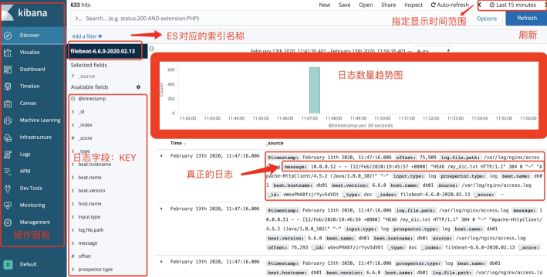
kibana area introduction
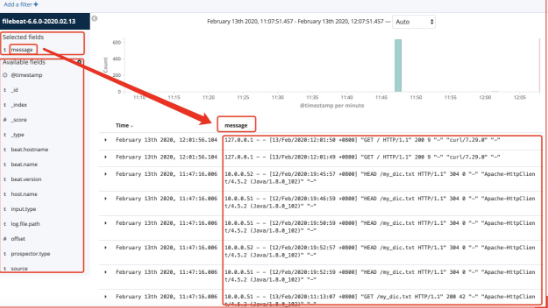
filebeat collects various json logs of nginx
1.ordinary Nginx Insufficient log:
- The logs are all in one value Separate display and search cannot be split
- Index name has no meaning

2.Ideal situation
{
    $remote_addr : 192.168.12.254
    - : -
    $remote_user : -
    [$time_local]: [10/Sep/2019:10:52:08 +0800]
    $request: GET /jhdgsjfgjhshj HTTP/1.0
    $status : 404
    $body_bytes_sent : 153
    $http_referer : -
    $http_user_agent :ApacheBench/2.3
    $http_x_forwarded_for:-
}

3.target
//Convert Nginx logs to json format

4.modify nginx Profiles converting logs to json
vim /etc/nginx/nginx.conf
log_format json '{ "time_local": "$time_local", '
                          '"remote_addr": "$remote_addr", '
                          '"referer": "$http_referer", '
                          '"request": "$request", '
                          '"status": $status, '
                          '"bytes": $body_bytes_sent, '
                          '"agent": "$http_user_agent", '
                          '"x_forwarded": "$http_x_forwarded_for", '
                          '"up_addr": "$upstream_addr",'
                          '"up_host": "$upstream_http_host",'
                          '"upstream_time": "$upstream_response_time",'
                          '"request_time": "$request_time"'
    ' }';
    access_log  /var/log/nginx/access.log  json;

//Empty old log
> /var/log/nginx/access.log

//Check and restart nginx
nginx -t
systemctl restart nginx

5.modify filebeat configuration file
cat >/etc/filebeat/filebeat.yml<<EOF
filebeat.inputs:
- type: log
  enabled: true
  paths:
    - /var/log/nginx/access.log
  json.keys_under_root: true
  json.overwrite_keys: true
output.elasticsearch:
  hosts: ["10.0.0.51:9200"]
EOF

6.Delete old ones ES Indexes
es-head >> filebeat-6.6.0-2019.11.15 >> action >>delete

7.restart filebeat
systemctl restart filebeat
curl 127.0.0.1 Generate new log,
8,delete kibana
Custom index name
filebeat custom ES Index name

1.Ideal index name
filebeat-6.6.0-2020.02.13
nginx-6.6.0-2019.11.15

2.filebeat To configure
cat >/etc/filebeat/filebeat.yml<<EOF
filebeat.inputs:
- type: log
  enabled: true
  paths:
    - /var/log/nginx/access.log
  json.keys_under_root: true
  json.overwrite_keys: true

output.elasticsearch:
  hosts: ["10.0.0.51:9200"]
  index: "nginx-%{[beat.version]}-%{+yyyy.MM}"

setup.template.name: "nginx"
setup.template.pattern: "nginx-*"
setup.template.enabled: false
setup.template.overwrite: true
EOF

3.restart filebeat
systemctl restart filebeat

4.Generate new log and check
curl 127.0.0.1

es-head Index name
nginx-6.6.0-2020.02

5.kibana Add to
Storage by log
filebeat Split index by service type

1.Ideal situation:
nginx-access-6.6.0-2020.02
nginx-error-6.6.0-2020.02

2.filebeat To configure
//The first method:
cat >/etc/filebeat/filebeat.yml <<EOF
filebeat.inputs:
- type: log
  enabled: true
  paths:
    - /var/log/nginx/access.log
  json.keys_under_root: true
  json.overwrite_keys: true

- type: log
  enabled: true
  paths:
    - /var/log/nginx/error.log

output.elasticsearch:
  hosts: ["10.0.0.51:9200"]
  indices:
    - index: "nginx-access-%{[beat.version]}-%{+yyyy.MM}"
      when.contains:
        source: "/var/log/nginx/access.log"
    - index: "nginx-error-%{[beat.version]}-%{+yyyy.MM}"
      when.contains:
        source: "/var/log/nginx/error.log"

setup.template.name: "nginx"
setup.template.pattern: "nginx-*"
setup.template.enabled: false
setup.template.overwrite: true
EOF

//The second method:
cat >/etc/filebeat/filebeat.yml <<EOF
filebeat.inputs:
- type: log
  enabled: true
  paths:
    - /var/log/nginx/access.log
  json.keys_under_root: true
  json.overwrite_keys: true
  tags: ["access"]

- type: log
  enabled: true
  paths:
    - /var/log/nginx/error.log
  tags: ["error"]

output.elasticsearch:
  hosts: ["10.0.0.51:9200"]
  indices:
    - index: "nginx-access-%{[beat.version]}-%{+yyyy.MM}"
      when.contains:
        tags: "access"
    - index: "nginx-error-%{[beat.version]}-%{+yyyy.MM}"
      when.contains:
        tags: "error"

setup.template.name: "nginx"
setup.template.pattern: "nginx-*"
setup.template.enabled: false
setup.template.overwrite: true
EOF

3.restart filebeat
systemctl restart filebeat

4.Generate test data
curl 127.0.0.1/zhangya

5.Check whether the corresponding index is generated
nginx-access-6.6.0-2020.02
nginx-error-6.6.0-2020.02
Collect multiple nginx logs
1.install nginx
yum install nginx

2.copy db01 configuration file
scp 10.0.0.51:/etc/nginx/nginx.conf /etc/nginx/nginx.conf
scp 10.0.0.51:/etc/nginx/conf.d/www.conf /etc/nginx/conf.d/

3.Create test page
mkdir /code/www/ -p
echo "db02-www" > /code/www/index.html

4.restart nginx
>/var/log/nginx/access.log
>/var/log/nginx/error.log
nginx -t
systemctl restart nginx

5.Generate test page
curl 127.0.0.1/22222222222222

6.install filebeat
rpm -ivh filebeat...

7.copy filebeat configuration file
scp 10.0.0.51:/etc/filebeat/filebeat.yml /etc/filebeat/

8.start-up filebeat
systemctl restart filebeat
filebeat principle
Similar to tail-f
 Real time reading will record the last transmitted location point
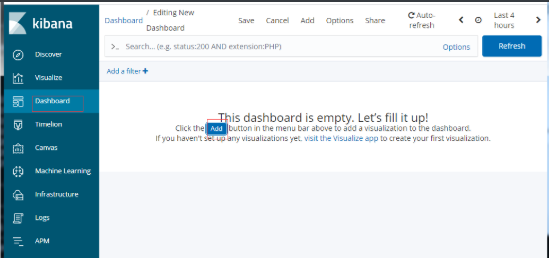
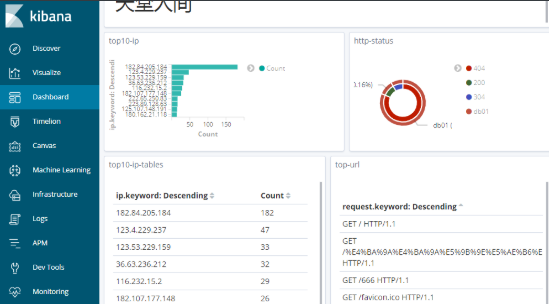
Customize kibana graphics
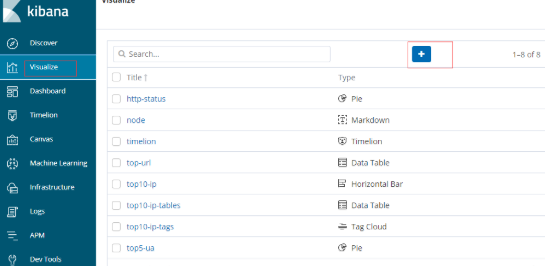
Composite panel
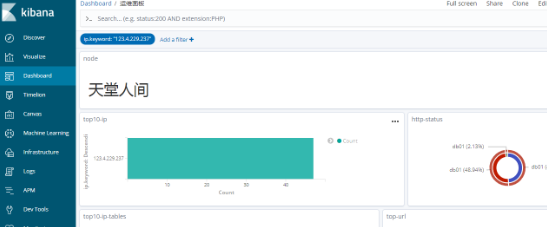
Filter view
Collect the json log of tomcat
1.install tomcat
yum install tomcat tomcat-webapps tomcat-admin-webapps tomcat-docs-webapp tomcat-javadoc -y

filebeat collect tomcat Of json Journal

1.install tomcat
yum install tomcat -y
systemctl start tomcat
tail -f /var/log/tomcat/localhost_access_log.2020-02-14.txt

2.modify tomcat Configure log conversion to json format
cp /etc/tomcat/server.xml /opt/
vim /etc/tomcat/server.xml
pattern="{"clientip":"%h","ClientUser":"%l","authenticated":"%u","AccessTime":"%t","method":"%r","status":"%s","SendBytes":"%b","Query?string":"%q","partner":"%{Referer}i","AgentVersion":"%{User-Agent}i"}"/>

3.Clear log and restart
> /var/log/tomcat/localhost_access_log.2020-02-14.txt
systemctl restart tomcat

4.Access and see if the log is json format
curl 127.0.0.1:8080
tail -f /var/log/tomcat/localhost_access_log.2020-02-14.txt

5.Establish filebeat configuration file
cat >/etc/filebeat/filebeat.yml <<EOF
filebeat.inputs:
- type: log
  enabled: true
  paths:
    - /var/log/nginx/access.log
  json.keys_under_root: true
  json.overwrite_keys: true
  tags: ["access"]

- type: log
  enabled: true
  paths:
    - /var/log/nginx/error.log
  tags: ["error"]

- type: log
  enabled: true
  paths:
    - /var/log/tomcat/localhost_access_log.*.txt
  json.keys_under_root: true
  json.overwrite_keys: true
  tags: ["tomcat"]

output.elasticsearch:
  hosts: ["10.0.0.51:9200"]
  indices:
    - index: "nginx-access-%{[beat.version]}-%{+yyyy.MM}"
      when.contains:
        tags: "access"
    - index: "nginx-error-%{[beat.version]}-%{+yyyy.MM}"
      when.contains:
        tags: "error"
    - index: "tomcat-%{[beat.version]}-%{+yyyy.MM}"
      when.contains:
        tags: "tomcat"

setup.template.name: "nginx"
setup.template.pattern: "nginx-*"
setup.template.enabled: false
setup.template.overwrite: true
EOF

6.restart filebeat And check
systemctl restart filebeat
Collect JAVA logs
https://www.elastic.co/guide/en/beats/filebeat/6.6/multiline-examples.html
java Characteristics of log:
1.Lots of error information
2.Error reporting information or an event.Can't look at it separately

//A java error log is as follows:
[2019-09-10T16:15:41,630][ERROR][o.e.b.Bootstrap          ] [CcJTI28] Exception
java.lang.IllegalArgumentException: unknown setting [nnode.name] did you mean [node.name]?
        at org.elasticsearch.common.settings.AbstractScopedSettings.validate(AbstractScopedSettings.java:482) ~[elasticsearch-6.6.0.jar:6.6.0]
        at org.elasticsearch.common.settings.AbstractScopedSettings.validate(AbstractScopedSettings.java:427) ~[elasticsearch-6.6.0.jar:6.6.0]
        at org.elasticsearch.common.settings.AbstractScopedSettings.validate(AbstractScopedSettings.java:398) ~[elasticsearch-6.6.0.jar:6.6.0]
        at org.elasticsearch.common.settings.AbstractScopedSettings.validate(AbstractScopedSettings.java:369) ~[elasticsearch-6.6.0.jar:6.6.0]
        at org.elasticsearch.common.settings.SettingsModule.<init>(SettingsModule.java:148) ~[elasticsearch-6.6.0.jar:6.6.0]
[2019-09-10T16:18:16,742][INFO ][o.e.c.m.MetaDataIndexTemplateService] [node-1] adding template [kibana_index_template:.kibana] for index patterns [.kibana]
[2019-09-10T16:18:17,981][INFO ][o.e.c.m.MetaDataIndexTemplateService] [node-1] adding template [kibana_index_template:.kibana] for index patterns [.kibana]
[2019-09-10T16:18:33,417][INFO ][o.e.c.m.MetaDataIndexTemplateService] [node-1] adding template [kibana_index_template:.kibana] for index patterns [.kibana]

//Matching ideas:
1.java Features of error log
//The normal log starts with [date]
//The number of error log lines is large, but not by[
2.Match to[Beginning line,Until the next[Beginning line,All data in the middle belongs to one event,Put it together and send it out ES
 filebeat collect java Multiline matching pattern
1.filebeat configuration file
cat >/etc/filebeat/filebeat.yml<<EOF
filebeat.inputs:
- type: log
  enabled: true
  paths:
    - /var/log/elasticsearch/elasticsearch.log
  multiline.pattern: '^\['
  multiline.negate: true
  multiline.match: after

output.elasticsearch:
  hosts: ["10.0.0.51:9200"]
  index: "es-%{[beat.version]}-%{+yyyy.MM}"

setup.template.name: "es"
setup.template.pattern: "es-*"
setup.template.enabled: false
setup.template.overwrite: true
EOF

2.restart filebeat
systemctl restart filebeat

3.inspect java Whether the error log has been consolidated into one line
kibana Add index and search for keywords at org
Filteat module
Effect:
//The general log of a specific service can be converted to json format

filbeat Use module collection nginx Journal
1.Empty and put nginx Restore log to normal format
#Clear log
>/var/log/nginx/access.log

#Edit profile
vi /etc/nginx/nginx.conf
    log_format  main  '$remote_addr - $remote_user [$time_local] "$request" '
                      '$status $body_bytes_sent "$http_referer" '
                      '"$http_user_agent" "$http_x_forwarded_for"';
    access_log  /var/log/nginx/access.log  main;

#Check and restart
nginx -t
systemctl restart nginx

2.Access and check if the log is in normal format
curl 127.0.0.1
tail -f /var/log/nginx/access.log


3.To configure filebeat Profile support module
vim /etc/filebeat/filebeat.yml
filebeat.config.modules:
  path: ${path.config}/modules.d/*.yml
  reload.enabled: true
  reload.period: 10s

output.elasticsearch:
  hosts: ["10.0.0.51:9200"]
  indices:
  - index: "nginx-access-%{[beat.version]}-%{+yyyy.MM}"
    when.contains:
      event.dataset: "nginx.access"
  - index: "nginx-error-%{[beat.version]}-%{+yyyy.MM}"
    when.contains:
      event.dataset: "nginx.error"

setup.template.name: "nginx"
setup.template.pattern: "nginx-*"
setup.template.enabled: false
setup.template.overwrite: true


4.activation filebeat Of nginx Modular
filebeat modules enable nginx
filebeat modules list

5.To configure filebeat Of nginx Module profile
cat >/etc/filebeat/modules.d/nginx.yml <<EOF
- module: nginx
  access:
    enabled: true
    var.paths: ["/var/log/nginx/access.log"]

  error:
    enabled: true
    var.paths: ["/var/log/nginx/error.log"]
EOF


6.es install filebeat Of nginx Module necessary plug-ins and restart
cd /usr/share/elasticsearch/:
./bin/elasticsearch-plugin install file:///root/ingest-geoip-6.6.0.zip
./bin/elasticsearch-plugin install file:///root/ingest-user-agent-6.6.0.zip
systemctl restart elasticsearch

7.restart filebeat
systemctl restart filebeat
filebeat uses modules to collect mysql logs
1.To configure mysql Error log and slow log path
//Edit my.cnf
log-error=Error log path
slow_query_log=ON
slow_query_log_file=Slow log path
long_query_time=3
2.restart mysql And create slow logs
systemctl restart mysql
//Slow log manufacturing statement
select sleep(2) user,host from mysql.user ;
3.Verify that the slow log and error log are generated
4.activation filebeat Of mysql Modular
filebeat module enable mysql
5.To configure mysql Module
- module: mysql
error:
enabled: true
var.paths: ["Error log path"]
slowlog:
enabled: true
var.paths: ["Slow log path"]
6.To configure filebeat Judge according to log type
filebeat.config.modules:
path: ${path.config}/modules.d/*.yml
reload.enabled: true
reload.period: 10s
output.elasticsearch:
hosts: ["10.0.0.51:9200"]
indices:
- index: "nginx_access-%{[beat.version]}-%{+yyyy.MM}"
when.contains:
fileset.module: "nginx"
fileset.name: "access"
- index: "nginx_error-%{[beat.version]}-%{+yyyy.MM}"
when.contains:
fileset.module: "nginx"
fileset.name: "error"
- index: "mysql_slowlog-%{[beat.version]}-%{+yyyy.MM}"
when.contains:
fileset.module: "mysql"
fileset.name: "slowlog"
- index: "mysql_error-%{[beat.version]}-%{+yyyy.MM}"
when.contains:
fileset.module: "mysql"
fileset.name: "error"
setup.template.name: "nginx"
setup.template.pattern: "nginx_*"
setup.template.enabled: false
setup.template.overwrite: true
7.restart filebeat
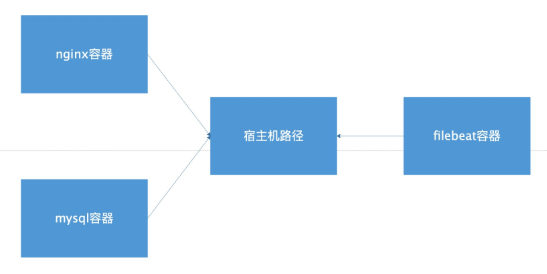
systemctl restart filebeatUse the docker type of input to collect docker logs
docker


1.install dockder
yum install -y yum-utils device-mapper-persistent-data lvm2
wget -O /etc/yum.repos.d/docker-ce.repo https://download.docker.com/linux/centos/docker-ce.repo
sed -i 's+download.docker.com+mirrors.tuna.tsinghua.edu.cn/docker-ce+' /etc/yum.repos.d/docker-ce.repo
yum makecache fast
yum install docker-ce -y
mkdir -p /etc/docker
tee /etc/docker/daemon.json <<-'EOF'
{
  "registry-mirrors": ["https://ig2l319y.mirror.aliyuncs.com"]
}
EOF
systemctl daemon-reload
systemctl restart docker

2.Start 2 Nginx Container and access test
docker run -d -p 80:80 nginx
docker run -d -p 8080:80 nginx

curl 10.0.0.52
curl 10.0.0.52:8080

3.To configure filebeat
[root@db02 ~]# cat /etc/filebeat/filebeat.yml
filebeat.inputs:
- type: docker
  containers.ids:
    - '*'

output.elasticsearch:
  hosts: ["10.0.0.51:9200"]
  index: "docker-%{[beat.version]}-%{+yyyy.MM}"

setup.template.name: "docker"
setup.template.pattern: "docker-*"
setup.template.enabled: false
setup.template.overwrite: true

4.restart filebeat
systemctl restart filebeat

5.Access build test data
curl 10.0.0.52/1111111111
curl 10.0.0.52:8080/2222222222
Starting the docker container with docker compose
scene:
//Container 1: nginx
//Container 2: mysql

filebeat collect docker Log can be released early

1.Hypothetical scenario
nginx Container 80 port
mysql Container 8080 port

2.Ideal index name
docker-nginx-6.6.0-2020.02
docker-mysql-6.6.0-2020.02

3.Ideal logging format
nginx Container log:
{
    "log": "xxxxxx",
    "stream": "stdout",
    "time": "xxxx",
    "service": "nginx"
}

mysql Container log:
{
    "log": "xxxxxx",
    "stream": "stdout",
    "time": "xxxx",
    "service": "mysql"
}

4.docker-compose To configure
yum install docker-compose -y
cat >docker-compose.yml<<EOF
version: '3'
services:
  nginx:
    image: nginx:latest
    labels:
      service: nginx
    logging:
      options:
        labels: "service"
    ports:
      - "80:80"
  db:
    image: nginx:latest
    labels:
      service: db
    logging:
      options:
        labels: "service"
    ports:
      - "8080:80"
EOF


5.Delete old container
docker stop $(docker ps -q)
docker rm $(docker ps -qa)

6.Starting container
docker-compose up -d

7.To configure filebeat
cat >/etc/filebeat/filebeat.yml <<EOF
filebeat.inputs:
- type: log
  enabled: true
  paths:
    - /var/lib/docker/containers/*/*-json.log
  json.keys_under_root: true
  json.overwrite_keys: true

output.elasticsearch:
  hosts: ["10.0.0.51:9200"]
  indices:
    - index: "docker-nginx-%{[beat.version]}-%{+yyyy.MM}"
      when.contains:
        attrs.service: "nginx"
    - index: "docker-db-%{[beat.version]}-%{+yyyy.MM}"
      when.contains:
        attrs.service: "db"

setup.template.name: "docker"
setup.template.pattern: "docker-*"
setup.template.enabled: false
setup.template.overwrite: true
EOF

8.restart filebeat
systemctl restart filebeat

9.Generate access log
curl 127.0.0.1/nginxxxxxxxxxxx
curl 127.0.0.1:8080/dbbbbbbbbb
Classification by service
Current imperfections
//The normal log and error log are in the same index

2.Ideal index name
docker-nginx-access-6.6.0-2020.02
docker-nginx-error-6.6.0-2020.02
docker-db-access-6.6.0-2020.02
docker-db-error-6.6.0-2020.02

3.filebeat configuration file
cat >/etc/filebeat/filebeat.yml <<EOF
filebeat.inputs:
- type: log
  enabled: true
  paths:
    - /var/lib/docker/containers/*/*-json.log
  json.keys_under_root: true
  json.overwrite_keys: true

output.elasticsearch:
  hosts: ["10.0.0.51:9200"]
  indices:
    - index: "docker-nginx-access-%{[beat.version]}-%{+yyyy.MM}"
      when.contains:
        attrs.service: "nginx"
        stream: "stdout"
    - index: "docker-nginx-error-%{[beat.version]}-%{+yyyy.MM}"
      when.contains:
        attrs.service: "nginx"
        stream: "stderr"

    - index: "docker-db-access-%{[beat.version]}-%{+yyyy.MM}"
      when.contains:
        attrs.service: "db"
        stream: "stdout"
    - index: "docker-db-error-%{[beat.version]}-%{+yyyy.MM}"
      when.contains:
        attrs.service: "db"
        stream: "stderr"

setup.template.name: "docker"
setup.template.pattern: "docker-*"
setup.template.enabled: false
setup.template.overwrite: true
EOF

4.restart filebeat
systemctl restart filebeat

5.Generate test data
curl 127.0.0.1/nginxxxxxxxxxxx
curl 127.0.0.1:8080/dbbbbbbbbb
Collect docker log salary increase version
1.requirement analysis
json Format and build according to the following index
docker-nginx-access-6.6.0-2020.02
docker-db-access-6.6.0-2020.02
docker-db-error-6.6.0-2020.02
docker-nginx-error-6.6.0-2020.02


2.Stop and delete previous containers
docker stop $(docker ps -qa)
docker rm $(docker ps -qa)

3.Create a new container
docker run -d -p 80:80 -v /opt/nginx:/var/log/nginx/ nginx
docker run -d -p 8080:80 -v /opt/mysql:/var/log/nginx/ nginx

4.Get ready json Formatted nginx configuration file
scp 10.0.0.51:/etc/nginx/nginx.conf /root/

[root@db02 ~]# grep "access_log" nginx.conf
    access_log  /var/log/nginx/access.log  json;

5.Copy to container and restart
docker cp nginx.conf Nginx Container ID:/etc/nginx/
docker cp nginx.conf mysql Container ID:/etc/nginx/
docker stop $(docker ps -qa)
docker start Nginx Container ID
docker start mysql Container ID


6.delete ES Existing index


7.To configure filebeat configuration file
cat >/etc/filebeat/filebeat.yml <<EOF
filebeat.inputs:
- type: log
  enabled: true
  paths:
    - /opt/nginx/access.log
  json.keys_under_root: true
  json.overwrite_keys: true
  tags: ["nginx_access"]

- type: log
  enabled: true
  paths:
    - /opt/nginx/error.log
  tags: ["nginx_err"]

- type: log
  enabled: true
  paths:
    - /opt/mysql/access.log
  json.keys_under_root: true
  json.overwrite_keys: true
  tags: ["db_access"]

- type: log
  enabled: true
  paths:
    - /opt/mysql/error.log
  tags: ["db_err"]

output.elasticsearch:
  hosts: ["10.0.0.51:9200"]
  indices:
    - index: "docker-nginx-access-%{[beat.version]}-%{+yyyy.MM}"
      when.contains:
        tags: "nginx_access"

    - index: "docker-nginx-error-%{[beat.version]}-%{+yyyy.MM}"
      when.contains:
        tags: "nginx_err"

    - index: "docker-db-access-%{[beat.version]}-%{+yyyy.MM}"
      when.contains:
        tags: "db_access"

    - index: "docker-db-error-%{[beat.version]}-%{+yyyy.MM}"
      when.contains:
        tags: "db_err"

setup.template.name: "docker"
setup.template.pattern: "docker-*"
setup.template.enabled: false
setup.template.overwrite: true
EOF

8.restart filebeat
systemctl restart filebeat

9.Access and test
curl 127.0.0.1/oldboy
curl 127.0.0.1:8080/oldboy
cat /opt/nginx/access.log
cat /opt/mysql/access.log
es-head See
Second option
Use cache service to relieve ES pressure
Architecture diagram
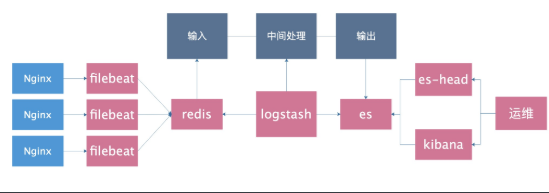
Introduce redis cache

1.install redis
yum install redis
sed -i 's#^bind 127.0.0.1#bind 127.0.0.1 10.0.0.51#' /etc/redis.conf
systemctl start redis
netstat -lntup|grep redis
redis-cli -h 10.0.0.51

2.Stop it docker container
docker stop $(docker ps -q)

3.Stop it filebeat
systemctl stop filebeat

4.Delete old ones ES Indexes

5.confirm nginx Log is json format
grep "access_log" nginx.conf

6.modify filebeat configuration file
cat >/etc/filebeat/filebeat.yml <<EOF
filebeat.inputs:
- type: log
  enabled: true
  paths:
    - /var/log/nginx/access.log
  json.keys_under_root: true
  json.overwrite_keys: true
  tags: ["access"]

- type: log
  enabled: true
  paths:
    - /var/log/nginx/error.log
  tags: ["error"]

output.redis:
  hosts: ["10.0.0.51"]
  keys:
    - key: "nginx_access"
      when.contains:
        tags: "access"
    - key: "nginx_error"
      when.contains:
        tags: "error"

setup.template.name: "nginx"
setup.template.pattern: "nginx_*"
setup.template.enabled: false
setup.template.overwrite: true
EOF

7.restart filebaet and nginx
systemctl restart nginx
systemctl restart filebeat

8.Generate test data
curl 127.0.0.1/haha

9.inspect
redis-cli -h 10.0.0.51
keys *
TYPE nginx_access
LLEN nginx_access
LRANGE nginx_access 0 -1
//Confirm whether it is in json format

10.install logstash
rpm -ivh jdk-8u102-linux-x64.rpm
rpm -ivh logstash-6.6.0.rpm


11.To configure logstash
cat >/etc/logstash/conf.d/redis.conf<<EOF
input {
  redis {
    host => "10.0.0.51"
    port => "6379"
    db => "0"
    key => "nginx_access"
    data_type => "list"
  }
  redis {
    host => "10.0.0.51"
    port => "6379"
    db => "0"
    key => "nginx_error"
    data_type => "list"
  }
}

filter {
  mutate {
    convert => ["upstream_time", "float"]
    convert => ["request_time", "float"]
  }
}

output {
   stdout {}
   if "access" in [tags] {
      elasticsearch {
        hosts => "http://10.0.0.51:9200"
        manage_template => false
        index => "nginx_access-%{+yyyy.MM}"
      }
    }
    if "error" in [tags] {
      elasticsearch {
        hosts => "http://10.0.0.51:9200"
        manage_template => false
        index => "nginx_error-%{+yyyy.MM}"
      }
    }
}
EOF

12.Foreground start test
/usr/share/logstash/bin/logstash -f /etc/logstash/conf.d/redis.conf

13.inspect
logstash Is the output content parsed into json
es-head Index generation on
redis Is the list data in reducing

14.take logstash Run in the background
ctrl+c
systemctl start logstash
//Listen to the sound of the fan. When it starts to turn, it means that the logstash is started
filebeat introduces redis to improve the scheme
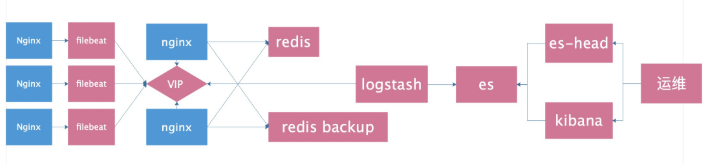
filebeat Introduce redis Perfect scheme

1.Prerequisite
- filebeat Transfer to is not supported redis Sentry or group
- logstash And not from redis Read data from sentry or cluster

2.Installation configuration redis
yum install redis -y
sed -i 's#^bind 127.0.0.1#bind 127.0.0.1 10.0.0.51#' /etc/redis.conf
systemctl start redis

3.Installation configuration nginx
//Configure official source
yum install nginx -y
//Put it after} in the last line of nginx.conf, not in conf.d
stream {
  upstream redis {
      server 10.0.0.51:6379 max_fails=2 fail_timeout=10s;
      server 10.0.0.52:6379 max_fails=2 fail_timeout=10s backup;
  }

  server {
          listen 6380;
          proxy_connect_timeout 1s;
          proxy_timeout 3s;
          proxy_pass redis;
  }
}
nginx -t
systemctl start nginx

4.Installation configuration keepalived
yum install keepalived -y
db01 Configuration
global_defs {
    router_id db01
}
vrrp_instance VI_1 {
    state MASTER
        interface eth0
        virtual_router_id 50
        priority 150
        advert_int 1
        authentication {
            auth_type PASS
            auth_pass 1111
        }
        virtual_ipaddress {
            10.0.0.100
        }
}

db02 Configuration
global_defs {
    router_id db02
}
vrrp_instance VI_1 {
    state BACKUP
    interface eth0
    virtual_router_id 50
    priority 100
    advert_int 1
    authentication {
        auth_type PASS
        auth_pass 1111
    }
    virtual_ipaddress {
        10.0.0.100
    }
}

systemctl start keepalived
ip a

5.Test whether access can be proxied to redis
redis-cli -h 10.0.0.100 -p 6380
//Stop redis of db01 and test whether redis can be connected

6.To configure filebeat
cat >/etc/filebeat/filebeat.yml <<EOF
filebeat.inputs:
- type: log
  enabled: true
  paths:
    - /var/log/nginx/access.log
  json.keys_under_root: true
  json.overwrite_keys: true
  tags: ["access"]

- type: log
  enabled: true
  paths:
    - /var/log/nginx/error.log
  tags: ["error"]

output.redis:
  hosts: ["10.0.0.100:6380"]
  keys:
    - key: "nginx_access"
      when.contains:
        tags: "access"
    - key: "nginx_error"
      when.contains:
        tags: "error"

setup.template.name: "nginx"
setup.template.pattern: "nginx_*"
setup.template.enabled: false
setup.template.overwrite: true
EOF

7.Test access filebeat Can I transfer to redis
curl 10.0.0.51/haha
redis-cli -h 10.0.0.51 #There should be data
redis-cli -h 10.0.0.52 #There should be no data
redis-cli -h 10.0.0.100 -p 6380 #There should be data

8.To configure logstash
cat >/etc/logstash/conf.d/redis.conf<<EOF
input {
  redis {
    host => "10.0.0.100"
    port => "6380"
    db => "0"
    key => "nginx_access"
    data_type => "list"
  }
  redis {
    host => "10.0.0.100"
    port => "6380"
    db => "0"
    key => "nginx_error"
    data_type => "list"
  }
}

filter {
  mutate {
    convert => ["upstream_time", "float"]
    convert => ["request_time", "float"]
  }
}

output {
   stdout {}
   if "access" in [tags] {
      elasticsearch {
        hosts => "http://10.0.0.51:9200"
        manage_template => false
        index => "nginx_access-%{+yyyy.MM}"
      }
    }
    if "error" in [tags] {
      elasticsearch {
        hosts => "http://10.0.0.51:9200"
        manage_template => false
        index => "nginx_error-%{+yyyy.MM}"
      }
    }
}
EOF

9.Startup Test
/usr/share/logstash/bin/logstash -f /etc/logstash/conf.d/redis.conf

10.Final test
ab -n 10000 -c 100 10.0.0.100/
//Check whether index entries on ES head are 10000
//Turn off redis of db01. When accessing, the logstash is abnormal
//Restore the redis of db01 and retest
Fibeat introduces redis optimization scheme
1.Four places need to be modified to add a new log path:
- filebat 2 Position
- logstash 2 Position

2.2 places to be modified after optimization
- filebat 1 Position
- logstash 1 Position

3.filebeat configuration file
filebeat.inputs:
- type: log
  enabled: true
  paths:
    - /var/log/nginx/access.log
  json.keys_under_root: true
  json.overwrite_keys: true
  tags: ["access"]

- type: log
  enabled: true
  paths:
    - /var/log/nginx/error.log
  tags: ["error"]


output.redis:
  hosts: ["10.0.0.100:6380"]
  key: "nginx_log"

setup.template.name: "nginx"
setup.template.pattern: "nginx_*"
setup.template.enabled: false
setup.template.overwrite: true

4.Optimized logstash
input {
  redis {
    host => "10.0.0.100"
    port => "6380"
    db => "0"
    key => "nginx_log"
    data_type => "list"
  }
}

filter {
  mutate {
    convert => ["upstream_time", "float"]
    convert => ["request_time", "float"]
  }
}

output {
   stdout {}
   if "access" in [tags] {
      elasticsearch {
        hosts => "http://10.0.0.51:9200"
        manage_template => false
        index => "nginx_access-%{+yyyy.MM}"
      }
    }
    if "error" in [tags] {
      elasticsearch {
        hosts => "http://10.0.0.51:9200"
        manage_template => false
        index => "nginx_error-%{+yyyy.MM}"
      }
    }
}
Using kafka as cache
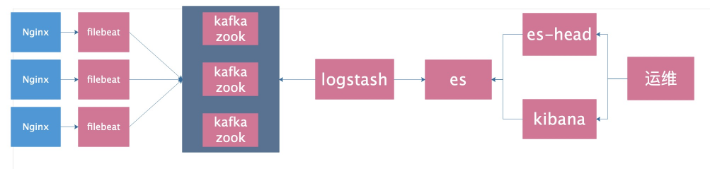
1. Configure hosts
10.0.0.51 kafka51
10.0.0.52 kafka52
10.0.0.53 kafka53
2. Install and configure zookeeper
cd /data/soft/
tar zxf zookeeper-3.4.11.tar.gz -C /opt/
ln -s /opt/zookeeper-3.4.11/ /opt/zookeeper
mkdir -p /data/zookeeper
cp /opt/zookeeper/conf/zoo_sample.cfg /opt/zookeeper/conf/zoo.cfg
cat >/opt/zookeeper/conf/zoo.cfg<<EOF
tickTime=2000
initLimit=10
syncLimit=5
dataDir=/data/zookeeper
clientPort=2181
server.1=10.0.0.51:2888:3888
server.2=10.0.0.52:2888:3888
server.3=10.0.0.53:2888:3888
EOF
Be careful! ID each machine is different
echo "1" > /data/zookeeper/myid
cat /data/zookeeper/myid
3. start zookeeper
All nodes start
/opt/zookeeper/bin/zkServer.sh start
4. Check each node
/opt/zookeeper/bin/zkServer.sh status
5. Test zookeeper
Execute on a node, create a channel
/opt/zookeeper/bin/zkCli.sh -server 10.0.0.51:2181
create /test "hello"
See whether it can be received on other nodes
/opt/zookeeper/bin/zkCli.sh -server 10.0.0.52:2181
get /test

//View process
ps -aux | grep 'zookeeper'
6. Install and deploy kafka
db01 operation
cd /data/soft/
tar zxf kafka_2.11-1.0.0.tgz -C /opt/
ln -s /opt/kafka_2.11-1.0.0/ /opt/kafka
mkdir /opt/kafka/logs
cat >/opt/kafka/config/server.properties<<EOF
broker.id=1
listeners=PLAINTEXT://10.0.0.51:9092
num.network.threads=3
num.io.threads=8
socket.send.buffer.bytes=102400
socket.receive.buffer.bytes=102400
socket.request.max.bytes=104857600
log.dirs=/opt/kafka/logs
num.partitions=1
num.recovery.threads.per.data.dir=1
offsets.topic.replication.factor=1
transaction.state.log.replication.factor=1
transaction.state.log.min.isr=1
log.retention.hours=24
log.segment.bytes=1073741824
log.retention.check.interval.ms=300000
zookeeper.connect=10.0.0.51:2181,10.0.0.52:2181,10.0.0.53:2181
zookeeper.connection.timeout.ms=6000
group.initial.rebalance.delay.ms=0
EOF
db02 operation
cd /data/soft/
tar zxf kafka_2.11-1.0.0.tgz -C /opt/
ln -s /opt/kafka_2.11-1.0.0/ /opt/kafka
mkdir /opt/kafka/logs
cat >/opt/kafka/config/server.properties<<EOF
broker.id=2
listeners=PLAINTEXT://10.0.0.52:9092
num.network.threads=3
num.io.threads=8
socket.send.buffer.bytes=102400
socket.receive.buffer.bytes=102400
socket.request.max.bytes=104857600
log.dirs=/opt/kafka/logs
num.partitions=1
num.recovery.threads.per.data.dir=1
offsets.topic.replication.factor=1
transaction.state.log.replication.factor=1
transaction.state.log.min.isr=1
log.retention.hours=24
log.segment.bytes=1073741824
log.retention.check.interval.ms=300000
zookeeper.connect=10.0.0.51:2181,10.0.0.52:2181,10.0.0.53:2181
zookeeper.connection.timeout.ms=6000
group.initial.rebalance.delay.ms=0
EOF
db03 operation
cd /data/soft/
tar zxf kafka_2.11-1.0.0.tgz -C /opt/
ln -s /opt/kafka_2.11-1.0.0/ /opt/kafka
mkdir /opt/kafka/logs
cat >/opt/kafka/config/server.properties<<EOF
broker.id=3
listeners=PLAINTEXT://10.0.0.53:9092
num.network.threads=3
num.io.threads=8
socket.send.buffer.bytes=102400
socket.receive.buffer.bytes=102400
socket.request.max.bytes=104857600
log.dirs=/opt/kafka/logs
num.partitions=1
num.recovery.threads.per.data.dir=1
offsets.topic.replication.factor=1
transaction.state.log.replication.factor=1
transaction.state.log.min.isr=1
log.retention.hours=24
log.segment.bytes=1073741824
log.retention.check.interval.ms=300000
zookeeper.connect=10.0.0.51:2181,10.0.0.52:2181,10.0.0.53:2181
zookeeper.connection.timeout.ms=6000
group.initial.rebalance.delay.ms=0
EOF
7. Foreground start test
/opt/kafka/bin/kafka-server-start.sh  /opt/kafka/config/server.properties


See if there is start at the end
8. Validation process
jps
 There are 3 processes
9. Test creation topic
/opt/kafka/bin/kafka-topics.sh --create --zookeeper 10.0.0.51:2181,10.0.0.52:2181,10.0.0.53:2181 --partitions 3 --replication-factor 3 --topic kafkatest
10. Test to obtain toppid
/opt/kafka/bin/kafka-topics.sh --describe --zookeeper 10.0.0.51:2181,10.0.0.52:2181,10.0.0.53:2181 --topic kafkatest
11. Test delete topic
/opt/kafka/bin/kafka-topics.sh --delete --zookeeper 10.0.0.51:2181,10.0.0.52:2181,10.0.0.53:2181 --topic kafkatest
12.kafka test command sending message
Create command
/opt/kafka/bin/kafka-topics.sh --create --zookeeper 10.0.0.51:2181,10.0.0.52:2181,10.0.0.53:2181 --partitions 3 --replication-factor 3 --topic messagetest
Test send message
/opt/kafka/bin/kafka-console-producer.sh --broker-list  10.0.0.51:9092,10.0.0.52:9092,10.0.0.53:9092 --topic  messagetest

Sharp horn appears
Other nodes test reception
/opt/kafka/bin/kafka-console-consumer.sh --zookeeper 10.0.0.51:2181,10.0.0.52:2181,10.0.0.53:2181 --topic messagetest --from-beginning
Test get all channels
/opt/kafka/bin/kafka-topics.sh --list --zookeeper 10.0.0.51:2181,10.0.0.52:2181,10.0.0.53:2181
13. After the test is successful, it can be started in the background
/opt/kafka/bin/kafka-server-start.sh -daemon /opt/kafka/config/server.properties
14. Modify the filebeat configuration file
cat >/etc/filebeat/filebeat.yml <<EOF
filebeat.inputs:
- type: log
  enabled: true
  paths:
    - /var/log/nginx/access.log
  json.keys_under_root: true
  json.overwrite_keys: true
  tags: ["access"]

- type: log
  enabled: true
  paths:
    - /var/log/nginx/error.log
  tags: ["error"]

output.kafka:
  hosts: ["10.0.0.51:9092", "10.0.0.52:9092", "10.0.0.53:9092"]
  topic: 'filebeat'

setup.template.name: "nginx"
setup.template.pattern: "nginx_*"
setup.template.enabled: false
setup.template.overwrite: true
EOF

//Restart filebeat
systemctl restart filebeat

11.Visit and check kafka Did you receive the log in
curl 10.0.0.51

/opt/kafka/bin/kafka-topics.sh  --list --zookeeper 10.0.0.51:2181,10.0.0.52:2181,10.0.0.53:2181

/opt/kafka/bin/kafka-console-consumer.sh --zookeeper 10.0.0.51:2181,10.0.0.52:2181,10.0.0.53:2181 --topic filebeat --from-beginning
15. Modify logstash configuration file
cat >/etc/logstash/conf.d/kafka.conf <<EOF
input {
  kafka{
    bootstrap_servers=>["10.0.0.51:9092,10.0.0.52:9092,10.0.0.53:9092"]
    topics=>["filebeat"]
    #group_id=>"logstash"
    codec => "json"
  }
}

filter {
  mutate {
    convert => ["upstream_time", "float"]
    convert => ["request_time", "float"]
  }
}

output {
   stdout {}
   if "access" in [tags] {
      elasticsearch {
        hosts => "http://10.0.0.51:9200"
        manage_template => false
        index => "nginx_access-%{+yyyy.MM}"
      }
    }
    if "error" in [tags] {
      elasticsearch {
        hosts => "http://10.0.0.51:9200"
        manage_template => false
        index => "nginx_error-%{+yyyy.MM}"
      }
    }
}
EOF
16. Start logstash and test
1. Front desk start
/usr/share/logstash/bin/logstash -f /etc/logstash/conf.d/kafka.conf
2. Background start
systemctl start logstash
17.logstash remove unnecessary fields
Just add the remove field field to the filter block
filter {
  mutate {
    convert => ["upstream_time", "float"]
    convert => ["request_time", "float"]
    remove_field => [ "beat" ]
  }
}
The relationship between kafka and zookeeper
The information stored in zookeeper includes broker, consumer and other important znode information.

It can be sensed that each kafka node registers the configuration information of the machine in zookeeper.

Then the topic information of the registered kafka node will be stored in the topic directory.


According to the list of zookeeper directories, we can see that zookeeper stores all the information of kafka cluster, so what is the process of sending and receiving messages?


 Sending and receiving of kafka

Send: kafka's sender (code) will specify the broker service address, so the message will be sent directly to the address provided by the broker.

If the address is a list (more than one broker address is specified), then randomly select an available send. The kafka machine that receives the message will query the zookeeper for the machine that owns the partition decision right under the topic, and then the leader selects the machine to store the data, and finally stores the data.
Receiving: the receiving of kafka will specify the zookeeper address, then the zookeeper receiving the consumption task will report the task to the leader of the partition under the topic, and the leader will specify the follower to complete the data acquisition and return.

Details on Zookeeper:

1. After each broker is started, a temporary broker registry will be registered on the zookeeper, including the ip address and port number of the broker, as well as the stored topics and partitions information.

2. After each consumer is started, a temporary consumer registry will be registered on zookeeper, including the consumer group to which the consumer belongs and the subscribed topics.

3. Each consumer group is associated with a temporary owner register and a persistent offset register.

For each subscribed partition, there is an owner registry. The content is the consumer id of the subscription partition.

At the same time, it contains an offset registry, which is the offset of the last subscription.
How to promote ELK in the company
- Give priority to express the benefits to others and let others leave work early
- The experimental environment is well prepared and can be opened for demonstration at any time, with rich data and drawings
- Development group, back-end group, front-end group, operation and maintenance group, DBA group individual customized panel
- Find the team leader alone and give priority to our team
- You see, if you have any problems, you have to run here. After I adjust it for you, you can click the mouse directly. If you have any problems, you can say, I'll go there