Official reference:
https://www.elastic.co/guide/en/elastic-stack/current/installing-elastic-stack.html https://www.elastic.co/guide/index.html https://www.elastic.co/learn
docker installation es
docker pull docker.elastic.co/elasticsearch/elasticsearch:6.4.3
Development mode start
docker run -p 9200:9200 -p 9300:9300 -e "discovery.type=single-node" docker.elastic.co/elasticsearch/elasticsearch:6.4.3
Production mode start
Modify kernel parameters:
sysctl -w vm.max_map_count=262144
Create docker-compose.yml. Start with docker-compose.
version: '2.2'
services:
  elasticsearch:
    image: docker.elastic.co/elasticsearch/elasticsearch:6.4.3
    container_name: elasticsearch
    environment:
      - cluster.name=docker-cluster
      - bootstrap.memory_lock=true
      - "ES_JAVA_OPTS=-Xms512m -Xmx512m"
    ulimits:
      memlock:
        soft: -1
        hard: -1
    volumes:
      - esdata1:/e/docker/elk/es/data
    ports:
      - 9200:9200
    networks:
      - esnet
  elasticsearch2:
    image: docker.elastic.co/elasticsearch/elasticsearch:6.4.3
    container_name: elasticsearch2
    environment:
      - cluster.name=docker-cluster
      - bootstrap.memory_lock=true
      - "ES_JAVA_OPTS=-Xms512m -Xmx512m"
      - "discovery.zen.ping.unicast.hosts=elasticsearch"
    ulimits:
      memlock:
        soft: -1
        hard: -1
    volumes:
      - esdata2:/e/docker/elk/es/data
    networks:
      - esnet

volumes:
  esdata1:
    driver: local
  esdata2:
    driver: local

networks:
  esnet:
https://www.elastic.co/guide/en/elasticsearch/reference/6.4/docker.html#docker-configuration-methods
https://www.docker.elastic.co/#
Error reporting
Out of memory
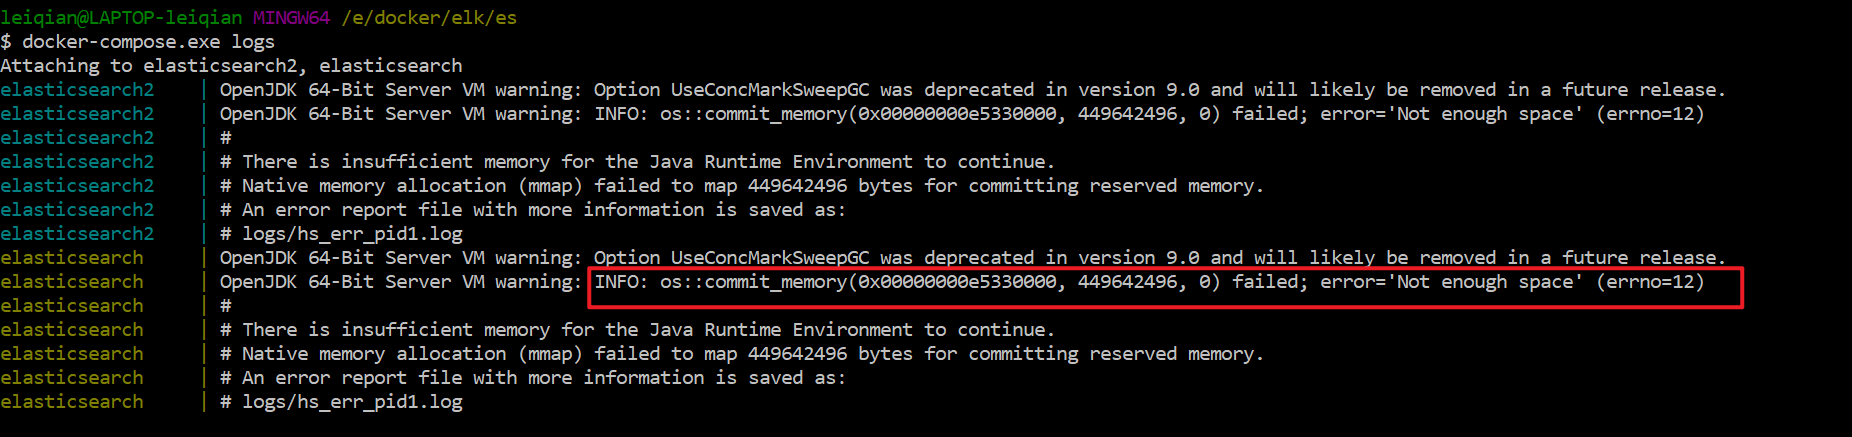
This means that the JVM needs to apply for 449642496byte (about 0.4G) of memory when it starts, but the virtual machine is out of memory.
To view the memory configuration of the boot2docker virtual machine:
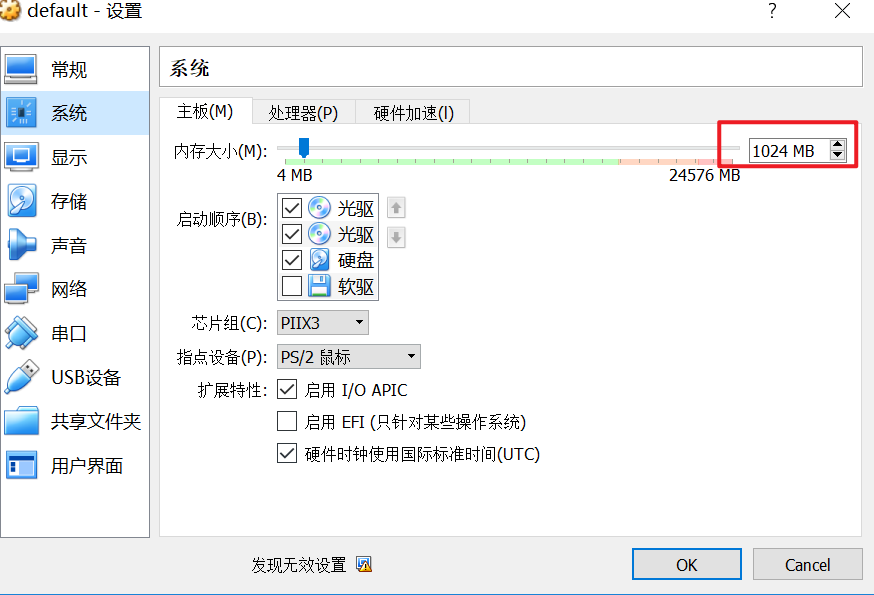
Only 1G is allocated by default. To view the available memory of the current boot2docker:
root@default:/e/docker/elk/es# free -m
              total        used        free      shared  buff/cache   available
Mem:            995         808         112          10          74          75
Swap:          1124        1124           0
Only 100M is available. So just increase the memory allocation of boot2docker.
Reference resources: https://github.com/elastic/elasticsearch-docker/issues/8
max virtual memory areas vm.max_map_count [65530] is too low, increase to at least [262144]
Solution: you need to modify the kernel parameters of boot2docker:
vi /etc/sysctl.conf,Add the following:
vm.max_map_count=262144

# Execute sysctl -p again for the configuration to take effect immediately.
sysctl -p
docker install Kibana
docker pull docker.elastic.co/kibana/kibana:6.4.3
docker-compose.yml
version: '2'
services:
  kibana:
    image: docker.elastic.co/kibana/kibana:6.4.3
    volumes:
      - ./kibana.yml:/usr/share/kibana/config/kibana.yml
    ports:
      - 5601:5601
kibana.yml
---
# Default Kibana configuration from kibana-docker.

server.name: "kibana"
server.host: "0.0.0.0"
elasticsearch.url: http://192.168.99.100:9200/
# xpack.monitoring.ui.container.elasticsearch.enabled: true
https://www.elastic.co/guide/en/kibana/6.4/docker.html
docker install logstash
docker pull docker.elastic.co/logstash/logstash:6.4.3
docker-compose.yml
version: '2'
services:
  kibana:
    image: docker.elastic.co/logstash/logstash:6.4.3
    volumes:
      - ./logstash.conf:/usr/share/logstash/pipeline/logstash.conf
      - ./logstash.yml:/usr/share/logstash/config/logstash.yml
    ports:
      - 9250:9250
logstash.conf
# Sample Logstash configuration for creating a simple
# Beats -> Logstash -> Elasticsearch pipeline.

input {
  tcp {
    # mode => "server"
    host => "0.0.0.0"
    port => 9250
    codec => "json"
  }
}

output {
  elasticsearch {
    hosts => ["http://192.168.99.100:9200"]
    #index => "%{[@metadata][beat]}-%{[@metadata][version]}-%{+YYYY.MM.dd}"
    index => "applogs"
    #user => "elastic"
    #password => "changeme"
  }
}

filter {
      #Only matched data are send to output.
}
logstash.yml
http.host: "0.0.0.0"
# xpack.monitoring.elasticsearch.url: http://elasticsearch:9200
logback.xml configuration
<?xml version="1.0" encoding="UTF-8"?>
<!--The log will have different log levels log Information saved to different files -->
<configuration>
    <include resource="org/springframework/boot/logging/logback/defaults.xml" />

    <springProperty scope="context" name="springAppName"
        source="spring.application.name" />

    <!-- Output location of log in the project -->
    <property name="LOG_FILE" value="${BUILD_FOLDER:-build}/${springAppName}" />

    <!-- Log output style for console -->
    <property name="CONSOLE_LOG_PATTERN"
        value="%clr(%d{yyyy-MM-dd HH:mm:ss.SSS}){faint} %clr(${LOG_LEVEL_PATTERN:-%5p}) %clr(${PID:- }){magenta} %clr(---){faint} %clr([%15.15t]){faint} %m%n${LOG_EXCEPTION_CONVERSION_WORD:-%wEx}}" />

    <!-- console output  -->
    <appender name="console" class="ch.qos.logback.core.ConsoleAppender">
        <filter class="ch.qos.logback.classic.filter.ThresholdFilter">
            <level>INFO</level>
        </filter>
        <!-- Log output code -->
        <encoder>
            <pattern>${CONSOLE_LOG_PATTERN}</pattern>
            <charset>utf8</charset>
        </encoder>
    </appender>

    <!-- by logstash Output JSON Formatted Appender -->
    <appender name="logstash"
        class="net.logstash.logback.appender.LogstashTcpSocketAppender">
        <destination>192.168.99.100:9250</destination>
        <!-- Log output code -->
        <encoder
            class="net.logstash.logback.encoder.LoggingEventCompositeJsonEncoder">
            <providers>
                <timestamp>
                    <timeZone>UTC</timeZone>
                </timestamp>
                <pattern>
                    <pattern>
                        {
                        "severity": "%level",
                        "service": "${springAppName:-}",
                        "trace": "%X{X-B3-TraceId:-}",
                        "span": "%X{X-B3-SpanId:-}",
                        "exportable": "%X{X-Span-Export:-}",
                        "pid": "${PID:-}",
                        "thread": "%thread",
                        "class": "%logger{40}",
                        "rest": "%message"
                        }
                    </pattern>
                </pattern>
            </providers>
        </encoder>
    </appender>

    <!-- Log output level -->
    <root level="DEBUG">
        <appender-ref ref="console" />
        <appender-ref ref="logstash" />
    </root>
</configuration>
https://www.elastic.co/guide/en/logstash/6.4/docker.html https://docs.docker.com/samples/library/logstash/#logstashversion