1. Project introduction
1.1) Project Blog Address
https://rpc.cnblogs.com/metaweblog/yyh28
1.2 Functions and Features of Project Completion
Analyse the file''Jimei University Enrollment Score. xlsx''to complete the following functions:
1) The average scores of different provinces in this batch from 2015 to 2018 at Jimei University. The column chart shows the top 10 provinces.
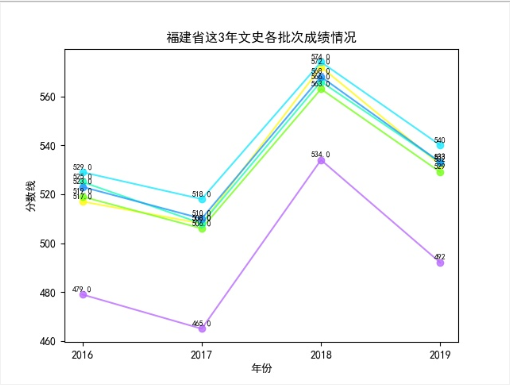
2) Analyse the results of batches in Fujian province in the last three years, display the results with line charts, and predict the enrollment results in 2019
3) Analyzing data from other provinces.Map all provinces using thermograms.
Technology stack used by 1.3 projects
Numpy: Data processing basis for matrix calculations and most other frameworks;
Matplotlab: Professional drawing tools, in which case the word plot was inserted between Matplotlabs.
Pandas: It is very convenient to provide a DataFrame operation similar to the R language;
Baidu Map API
Thermal Diagram
1.3 Address for project reference source code
https://www.jianshu.com/p/c18dedc38b7b
1.4 Team member task assignment table
II. Demand Analysis of Projects
Extract and analyze file data
3. Project Functional Architecture Diagram and Main Functional Flowchart
4. System Module Description
4.1 System Module List
Column, line, thermogram
4.2 Detailed description of each module (name, function, run screenshot, key source code)
4.2.1 Column chart: The average scores of different provinces in this batch from 2015 to 2018 at Jimei University show the top 10 provinces.
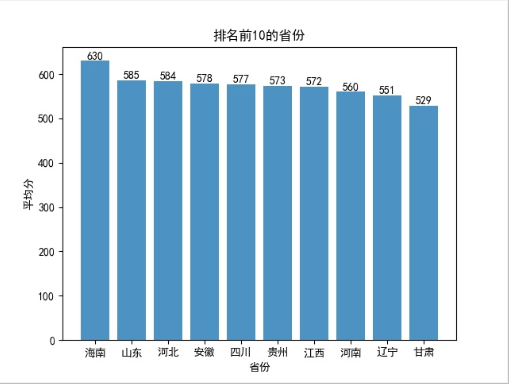
#Mapping
plt.figure()
plt.bar(x=province_dict_keys,height=province_dict_values,alpha=0.8)
for x,y in enumerate(province_dict_values):
    plt.text(x, y, '%s' % y, ha='center', va='bottom')
#Set Title
plt.title("Top 10 Provinces")
# Set names for two axes
plt.xlabel("Province")
plt.ylabel("Average")
#Display and Storage of Pictures
log = datetime.datetime.now().strftime('%Y-%m-%d')
# plt.savefig('./logging/%s_all_a.jpg' % log)   #Storage of pictures
# plt.close()   #Close matplotlib
4.2.2 Line Chart: Analyse the results of batches in Fujian Province in the past three years, use the line chart to show the results, and predict the enrollment results in 2019
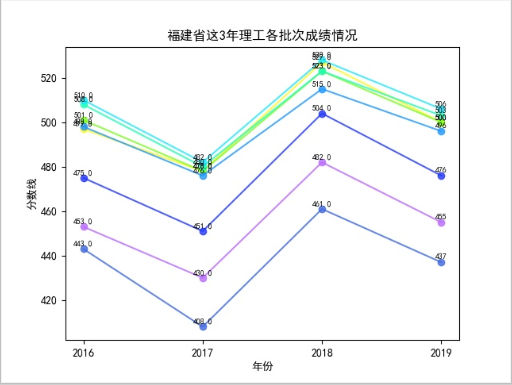
#Line chart

plt.figure()

plt.plot(grade_year,grade,'ro-', color='#4169E1', alpha=0.8, label='Early Batch Navigation (Engineering)')

plt.plot(grade_year,grade1,'ro-', color='#FFFA12', alpha=0.8, label='Normal Class(Provincial Orientation)(Engineering)')

plt.plot(grade_year,grade2,'ro-', color='#78FF1D', alpha=0.8, label='Normal Class(Facing Xiamen)(Engineering)')

plt.plot(grade_year,grade3,'ro-', color='#1CFFB7', alpha=0.8, label='Special Rural Program (Engineering)')

plt.plot(grade_year,grade4,'ro-', color='#1BE9FF', alpha=0.8, label='This batch (Engineering)')

plt.plot(grade_year,grade5,'ro-', color='#1F98FF', alpha=0.8, label='This batch(Facing Xiamen)(Engineering)')

plt.plot(grade_year,grade6,'ro-', color='#2237FF', alpha=0.8, label='Fujian-Taiwan Cooperation (Engineering)')

plt.plot(grade_year,grade7,'ro-', color='#BA6BFF', alpha=0.8, label='Preliminary batch (Engineering)') #Draw on the current drawing object ( X Axis, Y Axis, blue dashed line, line width)

for y in [grade,grade1,grade2,grade3,grade4,grade5,grade6,grade7]:

    for x,yy in zip(grade_year,y):

        plt.text(x, yy+1,str(yy), ha='center', va='bottom', fontsize=7)

plt.xlabel("Particular year") #X Axis label

plt.ylabel("Fractional Line") #Y Axis label

plt.title("Achievements of various batches of Polytechnics in Fujian during the last three years") #Title

# plt.savefig('./logging/%s_all_b.jpg' % log)   #Storage of pictures

#Show Diagram

plt.legend()

plt.show()
4.2.3 Thermal Map: Analysis of data from other provinces.Students with energy can study thermograms and map the data of all provinces.
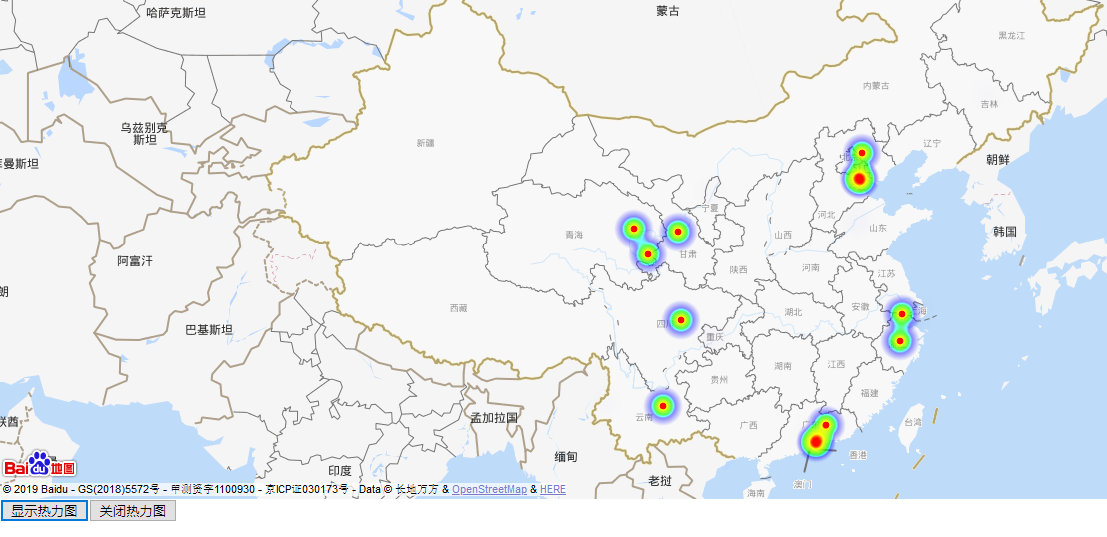
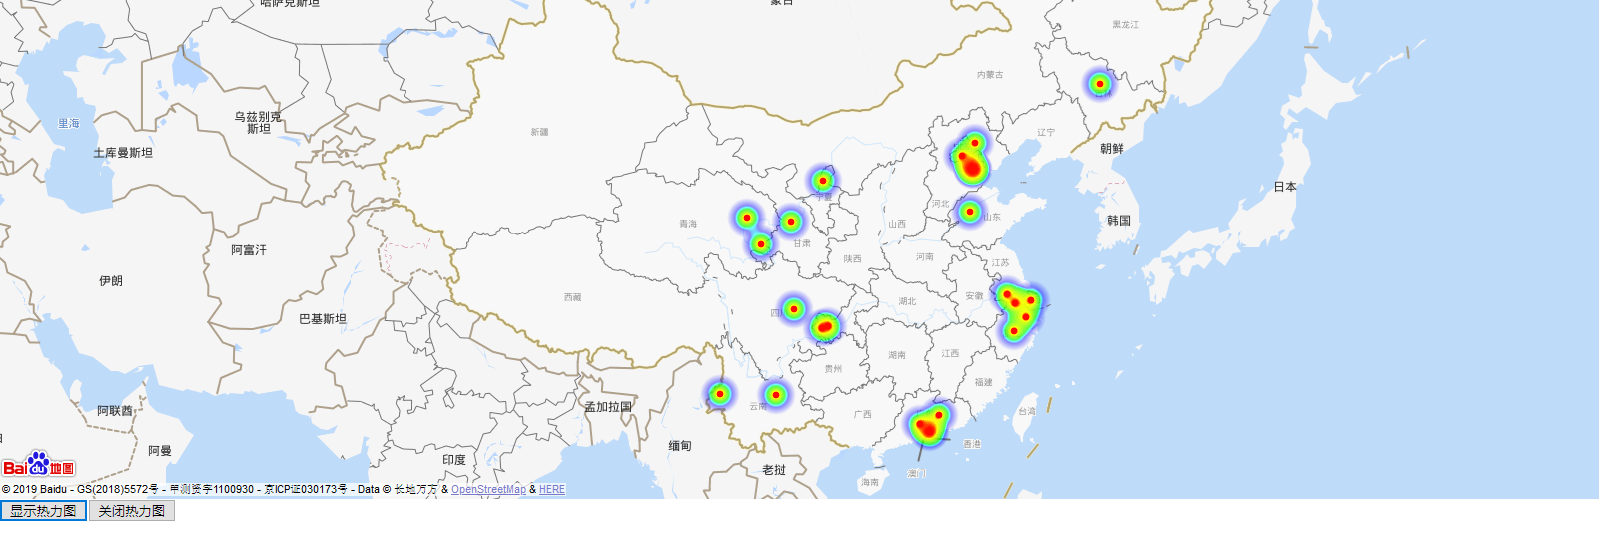
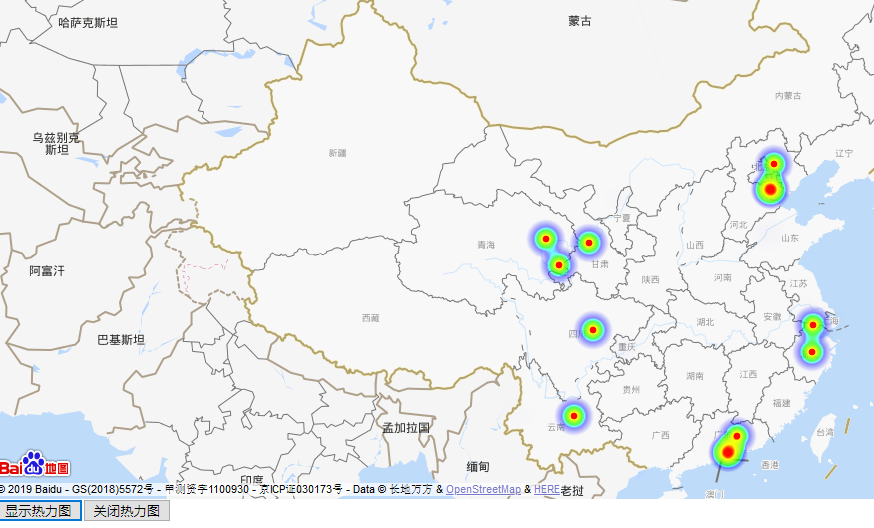
gr=batch('This batch','Engineering')

gr=sorted(gr.items(),key=lambda x:x[1],reverse=True)

file = open(r'../point.json','w') #establish json data file

point_pr(gr,file)


#Get Latitude and Longitude

def getlnglat(address):

    url = 'http://api.map.baidu.com/geocoding/v3/'

    output = 'json'

    ak = '8atpMUyuexdbuYFU838ejPvSPnWYZoks'

    add = quote(address) #Since the city variable in this article is in Chinese, to prevent random code, use quote Encoding

    uri = url + '?' + 'address=' + add  + '&output=' + output + '&ak=' + ak

    req = urlopen(uri)

    res = req.read().decode() #Decode other encoded strings to unicode

    temp = json.loads(res) #Yes json Data parsing

    return temp


def point_pr(gr,file):

#Latitude and longitude of each province

    print(gr)

    for line in gr:

        # line Is a list,Get all the values you need

        b = line[0] #Column 1 city Read out and clear unnecessary characters

        if b == 'Tibet' or b == '':

            continue

        c= line[1]#Column 2 price Read out and clear unnecessary characters

        lng = getlnglat(b)['result']['location']['lng'] #Use constructed functions to obtain longitude

        lat = getlnglat(b)['result']['location']['lat'] #Get Latitude

        str_temp = '{"lat":' + str(lat) + ',"lng":' + str(lng) + ',"count":' + str(c) +'},'

        # print(str_temp) #You can also copy the data to the corresponding location of Baidu Thermal Map api by printing it out

        file.write(str_temp) #Write to Document

    file.close()
V. Project Summary
5.1 Features
Analyse and generate charts on the entrance scores of Jimei University in recent years
5.2 Defects
The overall aesthetics are not good enough
Code cloud address: https://gitee.com/leaf28/university.git