This article mainly talks about the real experience in our work, how to build a 100 million-level log platform, and at the same time teaches you how to build such a 100 million-level ELK system.The specific development history of the log platform can be referred to the previous section "Evolution from ELK to EFK"
Say nothing more. Old drivers are seated. We're ready to start ~~
Overall architecture
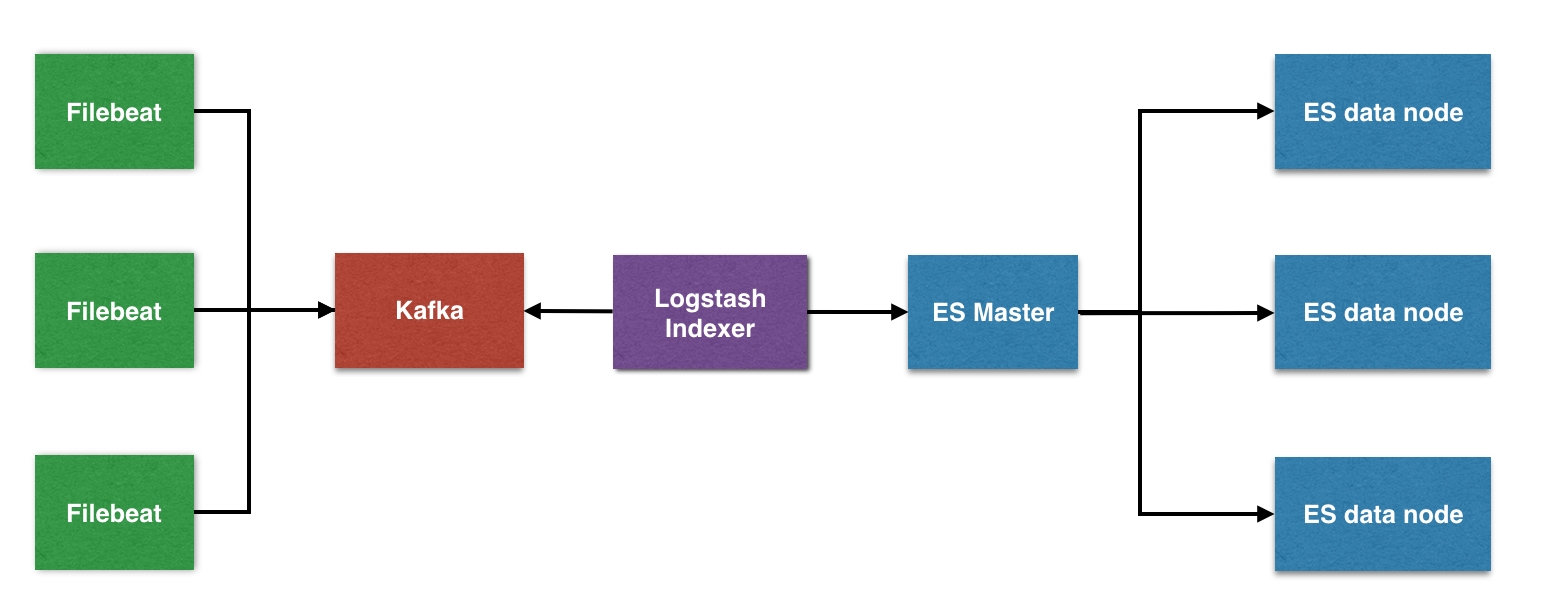
The overall architecture is divided into four modules, each providing different functions
Filebeat: Lightweight data collection engine.Based on the original Logstash-fowarder source code.In other words, Filebeat is the new version of Logstash-fowarder and will be ELK Stack's first choice in Agent.
Kafka: Data buffer queue.As a message queue, it decouples the processing and improves scalability.With peak processing power, message queuing enables critical components to withstand sudden access pressure without crashing completely due to sudden, overloaded requests.
Logstash: Data collection and processing engine.Supports the dynamic collection of data from a variety of data sources, filtering, analysis, enrichment, uniform format, and other operations, and then storage for subsequent use.
Elasticsearch: A distributed search engine.It has the features of high scalability, high reliability and easy management.It can be used for full-text retrieval, structured retrieval and analysis, and can combine the three.Elasticsearch is based on Lucene and now uses one of the most popular open source search engines, Wikipedia, StackOverflow, Github, and others to build their own search engine.
Kibana: A visualization platform.It searches for and displays indexed data stored in Elasticsearch.Use it to display and analyze data easily with charts, tables, maps.
Version description
Filebeat: 6.2.4
Kafka: 2.11-1
Logstash: 6.2.4
Elasticsearch: 6.2.4
Kibana: 6.2.4

The appropriate version is best to download the appropriate plug-in
Specific Practice
Let's take a more common example of Nginx logs, where the content is in JSON format
{"@timestamp":"2017-12-27T16:38:17+08:00","host":"192.168.56.11","clientip":"192.168.56.11","size":26,"responsetime":0.000,"upstreamtime":"-","upstreamhost":"-","http_host":"192.168.56.11","url":"/nginxweb/index.html","domain":"192.168.56.11","xff":"-","referer":"-","status":"200"}
{"@timestamp":"2017-12-27T16:38:17+08:00","host":"192.168.56.11","clientip":"192.168.56.11","size":26,"responsetime":0.000,"upstreamtime":"-","upstreamhost":"-","http_host":"192.168.56.11","url":"/nginxweb/index.html","domain":"192.168.56.11","xff":"-","referer":"-","status":"200"}
{"@timestamp":"2017-12-27T16:38:17+08:00","host":"192.168.56.11","clientip":"192.168.56.11","size":26,"responsetime":0.000,"upstreamtime":"-","upstreamhost":"-","http_host":"192.168.56.11","url":"/nginxweb/index.html","domain":"192.168.56.11","xff":"-","referer":"-","status":"200"}
{"@timestamp":"2017-12-27T16:38:17+08:00","host":"192.168.56.11","clientip":"192.168.56.11","size":26,"responsetime":0.000,"upstreamtime":"-","upstreamhost":"-","http_host":"192.168.56.11","url":"/nginxweb/index.html","domain":"192.168.56.11","xff":"-","referer":"-","status":"200"}
{"@timestamp":"2017-12-27T16:38:17+08:00","host":"192.168.56.11","clientip":"192.168.56.11","size":26,"responsetime":0.000,"upstreamtime":"-","upstreamhost":"-","http_host":"192.168.56.11","url":"/nginxweb/index.html","domain":"192.168.56.11","xff":"-","referer":"-","status":"200"}
Filebeat
Why use Filebeat instead of Logstash?
The reason is simple: resource consumption is high.
Since Logstash runs on JVM and consumes a lot of resources, the author later wrote a lightweight Agent called Logstash-forwarder with GO that has less functions but less resources.
Later, the author joined elastic.co, where Logstash-forwarder was developed for the internal GO team and named Filebeat.
Filebeat s need to be deployed on each application server and can be pushed and installed via Salt.
download
$ wget https://artifacts.elastic.co/downloads/beats/filebeat/filebeat-6.2.4-darwin-x86_64.tar.gz
decompression
tar -zxvf filebeat-6.2.4-darwin-x86_64.tar.gz
mv filebeat-6.2.4-darwin-x86_64 filebeat
cd filebeat
Modify Configuration
Modify the Filebeat configuration to allow local directory logs to be collected and output to the Kafka cluster
$ vim fileat.yml
filebeat.prospectors:
- input_type: log
  paths:
    -  /opt/logs/server/nginx.log
  json.keys_under_root: true
  json.add_error_key: true
  json.message_key: log

output.kafka:
  hosts: ["192.168.0.1:9092,192.168.0.2:9092,192.168.0.3:9092"]
  topic: 'nginx'
Some configuration parameters have changed considerably since Filebeat 6.0, such as document_type not supported, fields being used instead, and so on.
start-up
$ ./filebeat -e -c filebeat.yml
Kafka
The number of nodes in a Kafka cluster in a production environment is recommended to be (2N + 1), with three nodes as an example
download
Download Kafka directly from the official website
$ wget http://mirror.bit.edu.cn/apache/kafka/1.0.0/kafka_2.11-1.0.0.tgz
decompression
tar -zxvf kafka_2.11-1.0.0.tgz
mv kafka_2.11-1.0.0 kafka
cd kafka
Modify Zookeeper configuration
Modify Zookeeper configuration, set up Zookeeper cluster, number (2N + 1)
ZK Cluster recommends using Kafka in-house to reduce network-related interference
$ vim zookeeper.properties

tickTime=2000
dataDir=/opt/zookeeper
clientPort=2181
maxClientCnxns=50
initLimit=10
syncLimit=5

server.1=192.168.0.1:2888:3888
server.2=192.168.0.2:2888:3888
server.3=192.168.0.3:2888:3888
Add a myid file under the Zookeeper data directory that represents the Zooekeeper node id (1, 2, 3) and guarantees no duplication
$ vim /opt/zookeeper/myid
1
Start Zookeeper Node
Start three Zookeeper nodes to ensure high availability of the cluster
$ ./zookeeper-server-start.sh -daemon ./config/zookeeper.properties
Modify Kafka configuration
There are three Kafka clusters on this side, so you can modify the Kafka configuration one by one. Note that broker.id is (1, 2, 3)
$ vim ./config/server.properties
broker.id=1
port=9092
host.name=192.168.0.1
num.replica.fetchers=1
log.dirs=/opt/kafka_logs
num.partitions=3
zookeeper.connect=192.168.0.1: 192.168.0.2: 192.168.0.3:2181
zookeeper.connection.timeout.ms=6000
zookeeper.sync.time.ms=2000
num.io.threads=8
num.network.threads=8
queued.max.requests=16
fetch.purgatory.purge.interval.requests=100
producer.purgatory.purge.interval.requests=100
delete.topic.enable=true
Start Kafka Cluster
Start three Kafka nodes to ensure high availability of the cluster
$ ./bin/kafka-server-start.sh -daemon ./config/server.properties
Check if topic was created successfully
$ bin/kafka-topics.sh --list --zookeeper localhost:2181

nginx
Monitor Kafka Manager
Kafka-manager is Yahoo's open source cluster management tool.
You can download and install in Github: https://github.com/yahoo/kafka-manager
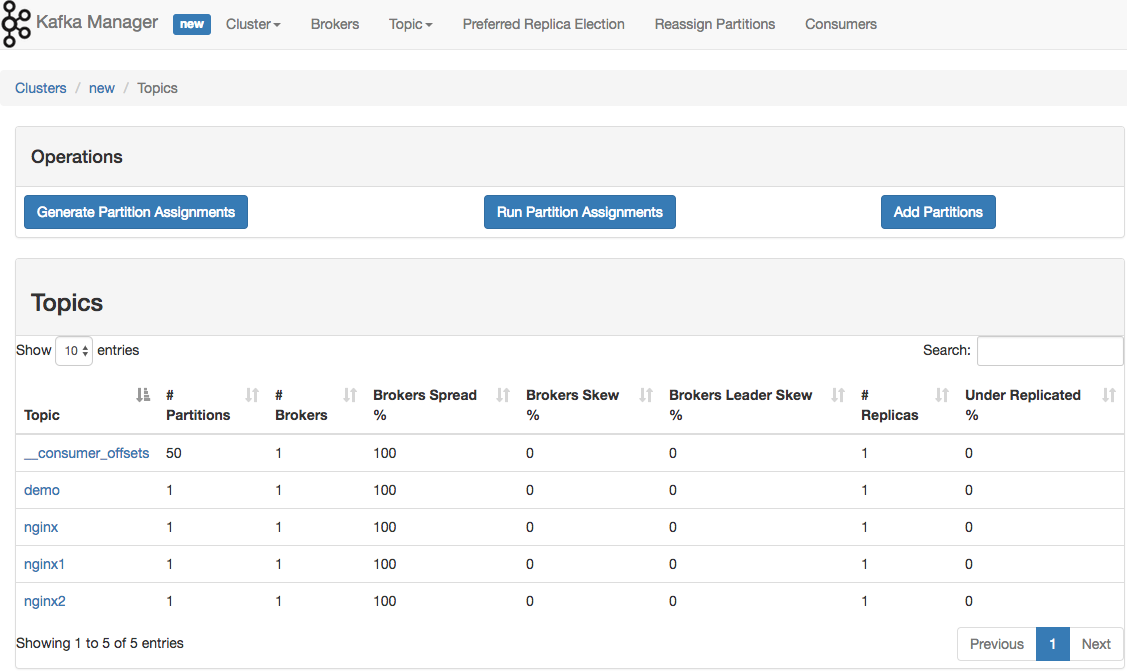
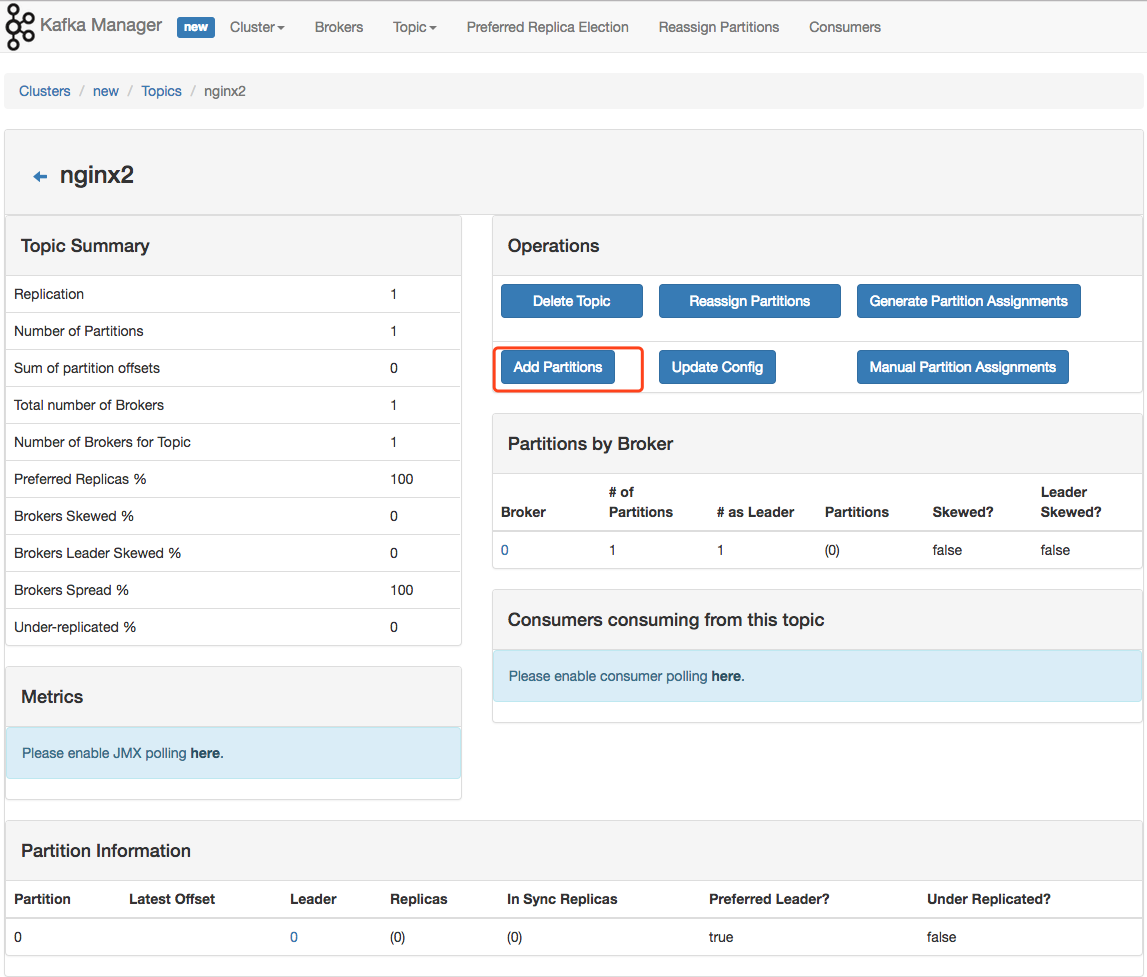
If Kafka consumption is not timely, you can add partition by going to the specific cluster page.Kafka improves concurrent consumption speed through partition partitioning
Logstash
Logstash provides three main functions
- INPUT Entry
- FILTER filter function
- OUTPUT Out
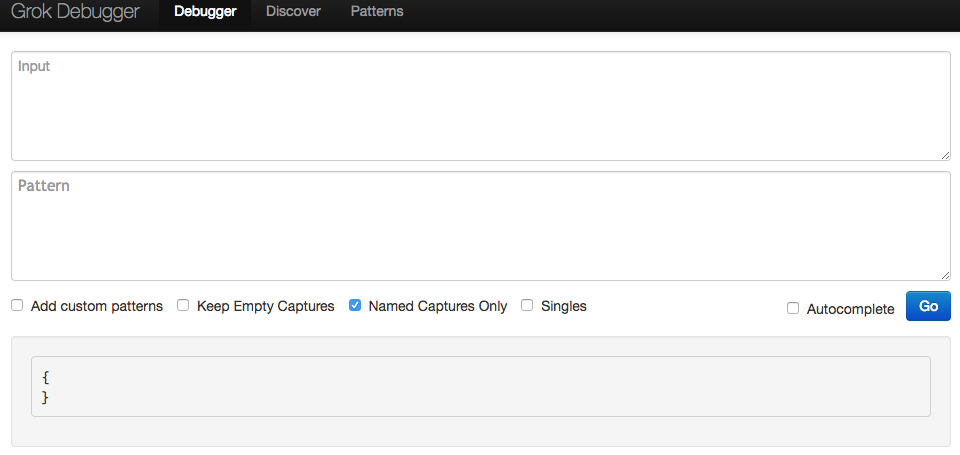
If you use the Filter function, it is highly recommended that you use it Grok debugger To pre-parse the log format.
download
$ wget https://artifacts.elastic.co/downloads/logstash/logstash-6.2.4.tar.gz
Unzip Rename
$ tar -zxvf logstash-6.2.4.tar.gz
$ mv logstash-6.2.4 logstash
Modify Logstash configuration
Modify the Logstash configuration to provide indexer functionality to insert data into the Elasticsearch cluster
$ vim nginx.conf

input {
  kafka {
    type => "kafka"
    bootstrap_servers => "192.168.0.1:2181,192.168.0.2:2181,192.168.0.3:2181"
    topics => "nginx"
    group_id => "logstash"
    consumer_threads => 2
  }
}

output {
  elasticsearch {
    host => ["192.168.0.1","192.168.0.2","192.168.0.3"]
    port => "9300"
    index => "nginx-%{+YYYY.MM.dd}"
  }
}
Start Logstash
$ ./bin/logstash -f nginx.conf
Elasticsearch
download
$ wget https://artifacts.elastic.co/downloads/elasticsearch/elasticsearch-6.2.4.tar.gz
decompression
$ tar -zxvf elasticsearch-6.2.4.tar.gz
$ mv elasticsearch-6.2.4.tar.gz elasticsearch
Modify Configuration
$ vim config/elasticsearch.yml

cluster.name: es
node.name: es-node1
network.host: 192.168.0.1
discovery.zen.ping.unicast.hosts: ["192.168.0.1"]
discovery.zen.minimum_master_nodes: 1
start-up
Background boot via -d
$ ./bin/elasticsearch -d
Open Web Page http://192.168.0.1:9200/ If the following information appears, the configuration is successful
{
    name: "es-node1",
    cluster_name: "es",
    cluster_uuid: "XvoyA_NYTSSV8pJg0Xb23A",
    version: {
        number: "6.2.4",
        build_hash: "ccec39f",
        build_date: "2018-04-12T20:37:28.497551Z",
        build_snapshot: false,
        lucene_version: "7.2.1",
        minimum_wire_compatibility_version: "5.6.0",
        minimum_index_compatibility_version: "5.0.0"
    },
    tagline: "You Know, for Search"
}
Console
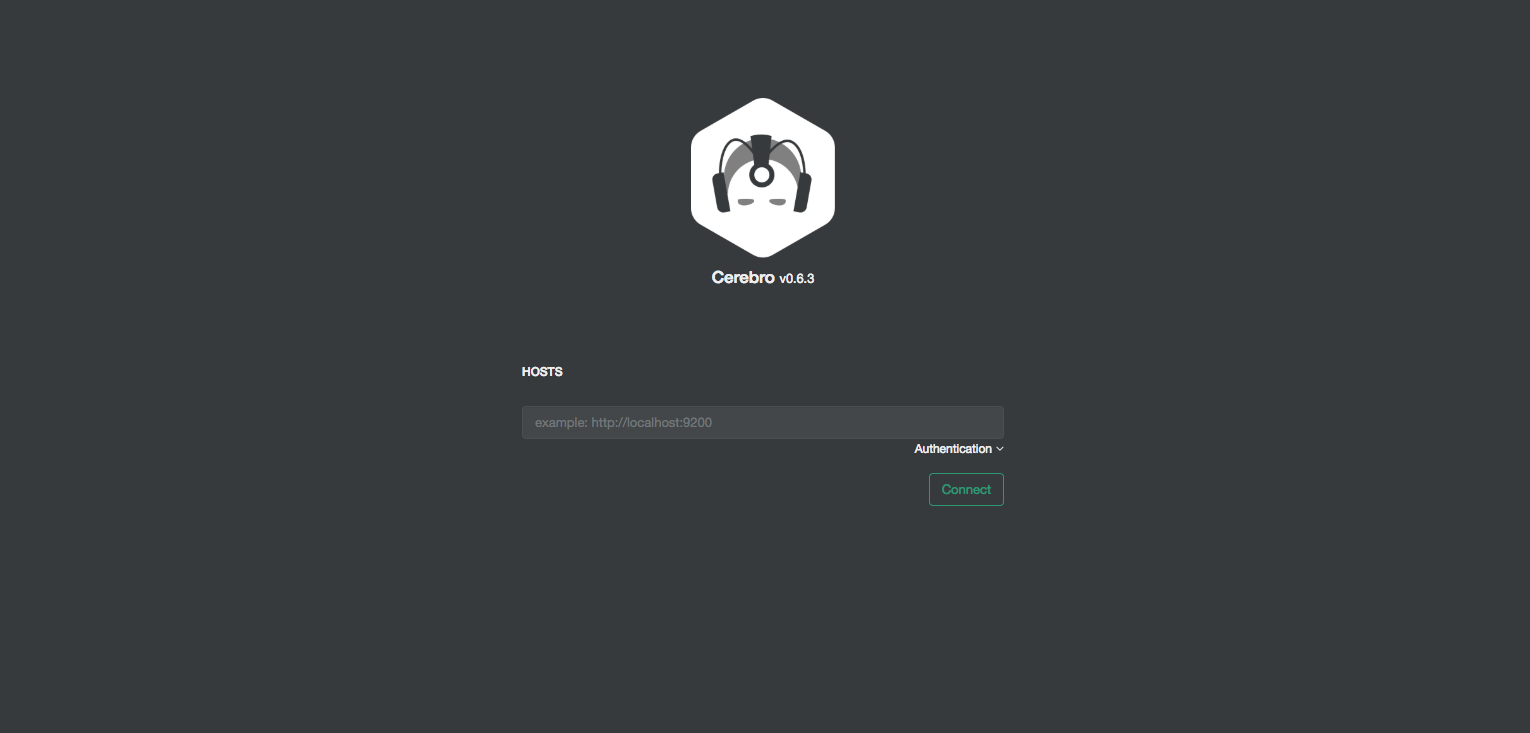
The name Cerebro may seem strange to everyone, but in the past its name was kopf!Because Elasticsearch 5.0 no longer supports site plugin, the author of Kopf abandoned the original project and started cerebro to continue supporting the management of Elasticsearch in the new version as a stand-alone single-page application.
Points of Attention
- Master is separated from Data node. When Data node is larger than 3, it is recommended that responsibility be separated to alleviate pressure
- Data Node does not have more than 32G of memory and is recommended to be set to 31G for the specific reason given in the previous article
- discovery.zen.minimum_master_nodes set to (total / 2 + 1) to avoid schizophrenia
- Most importantly, do not expose ES to the public network. It is recommended that X-PACK be installed to enhance its security.
kibana
download
$ wget https://artifacts.elastic.co/downloads/kibana/kibana-6.2.4-darwin-x86_64.tar.gz
decompression
$ tar -zxvf kibana-6.2.4-darwin-x86_64.tar.gz
$ mv kibana-6.2.4-darwin-x86_64.tar.gz kibana
Modify Configuration
$ vim config/kibana.yml

server.port: 5601
server.host: "192.168.0.1"
elasticsearch.url: "http://192.168.0.1:9200"
Start Kibana
$ nohup ./bin/kibana &
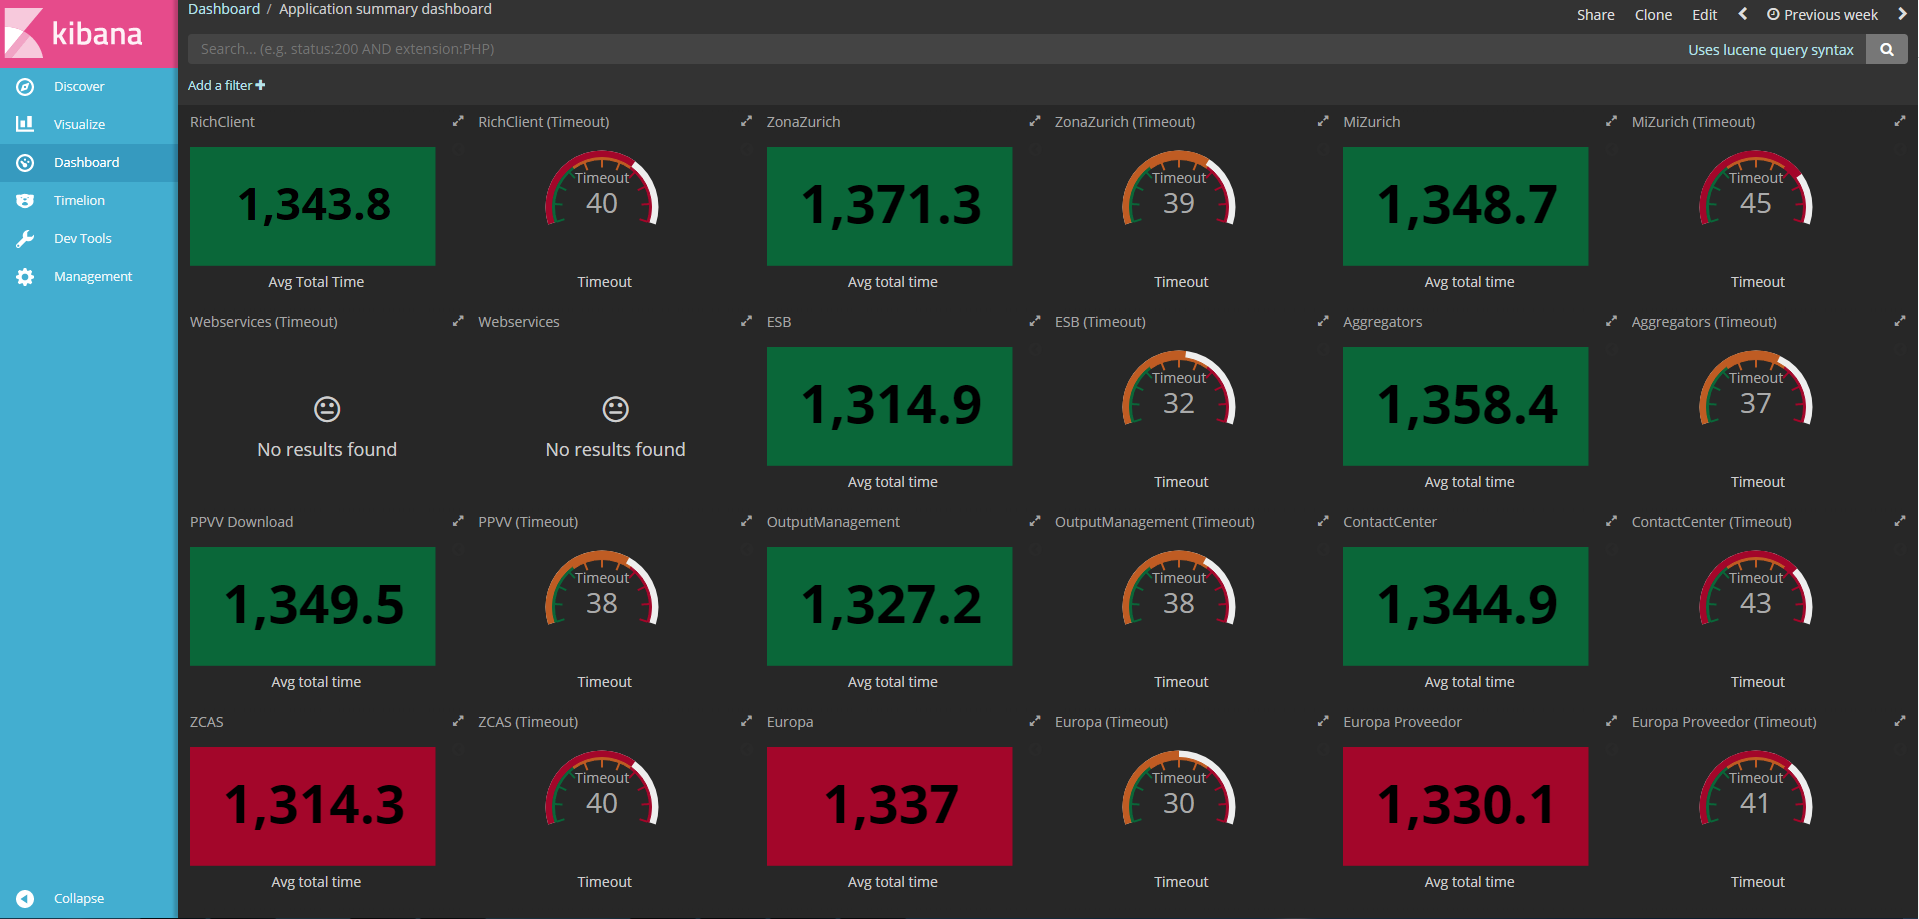
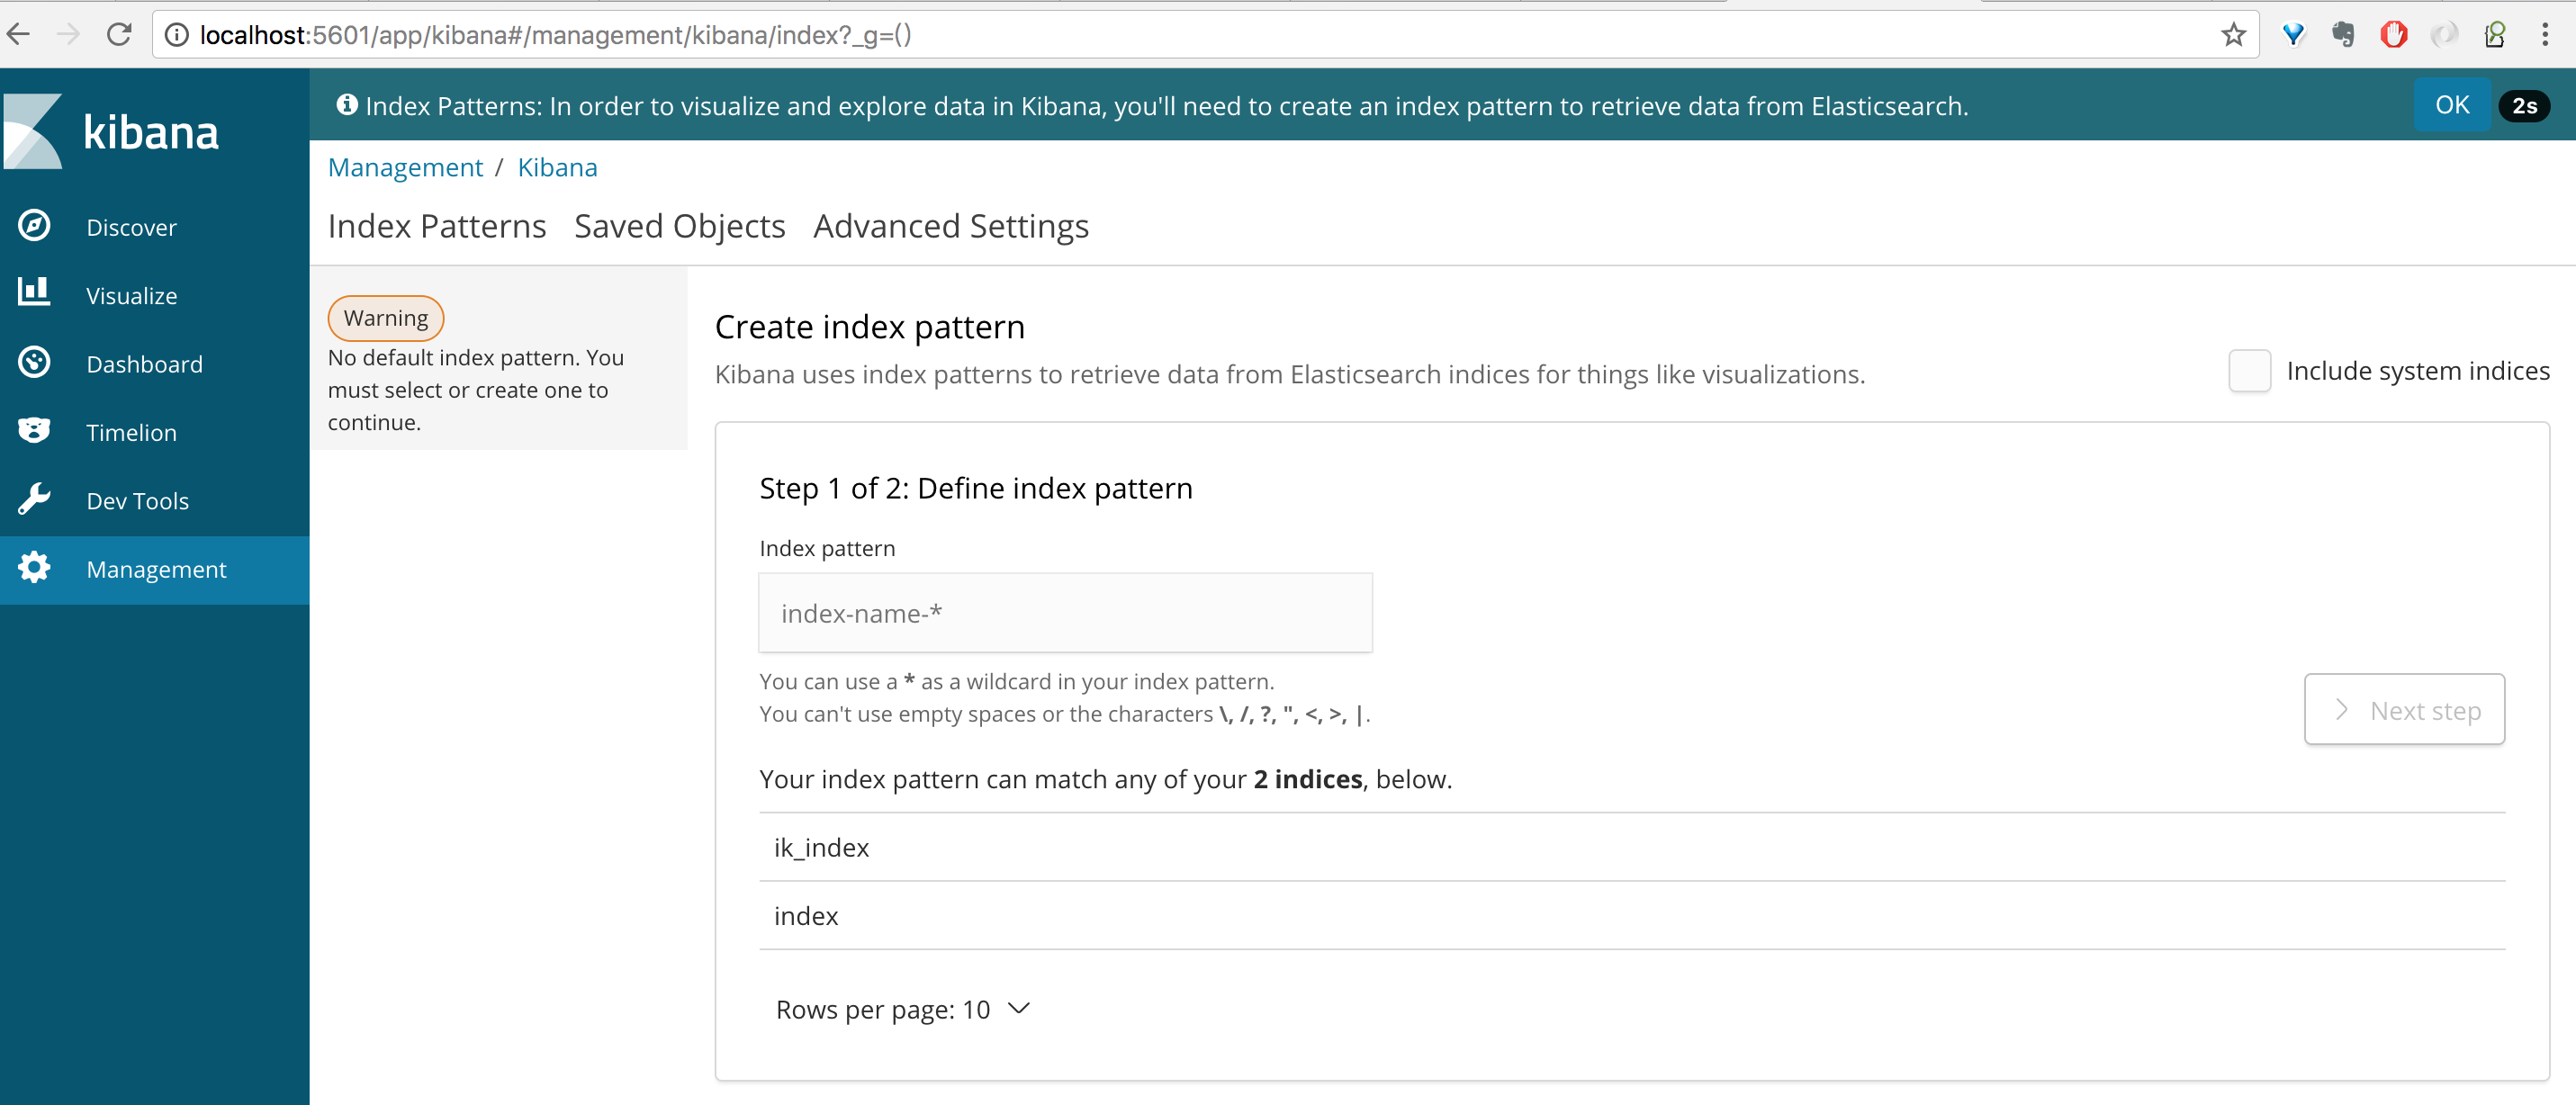
Interface Display
To create an index page, you need to specify it by prefix in Management -> Index Patterns
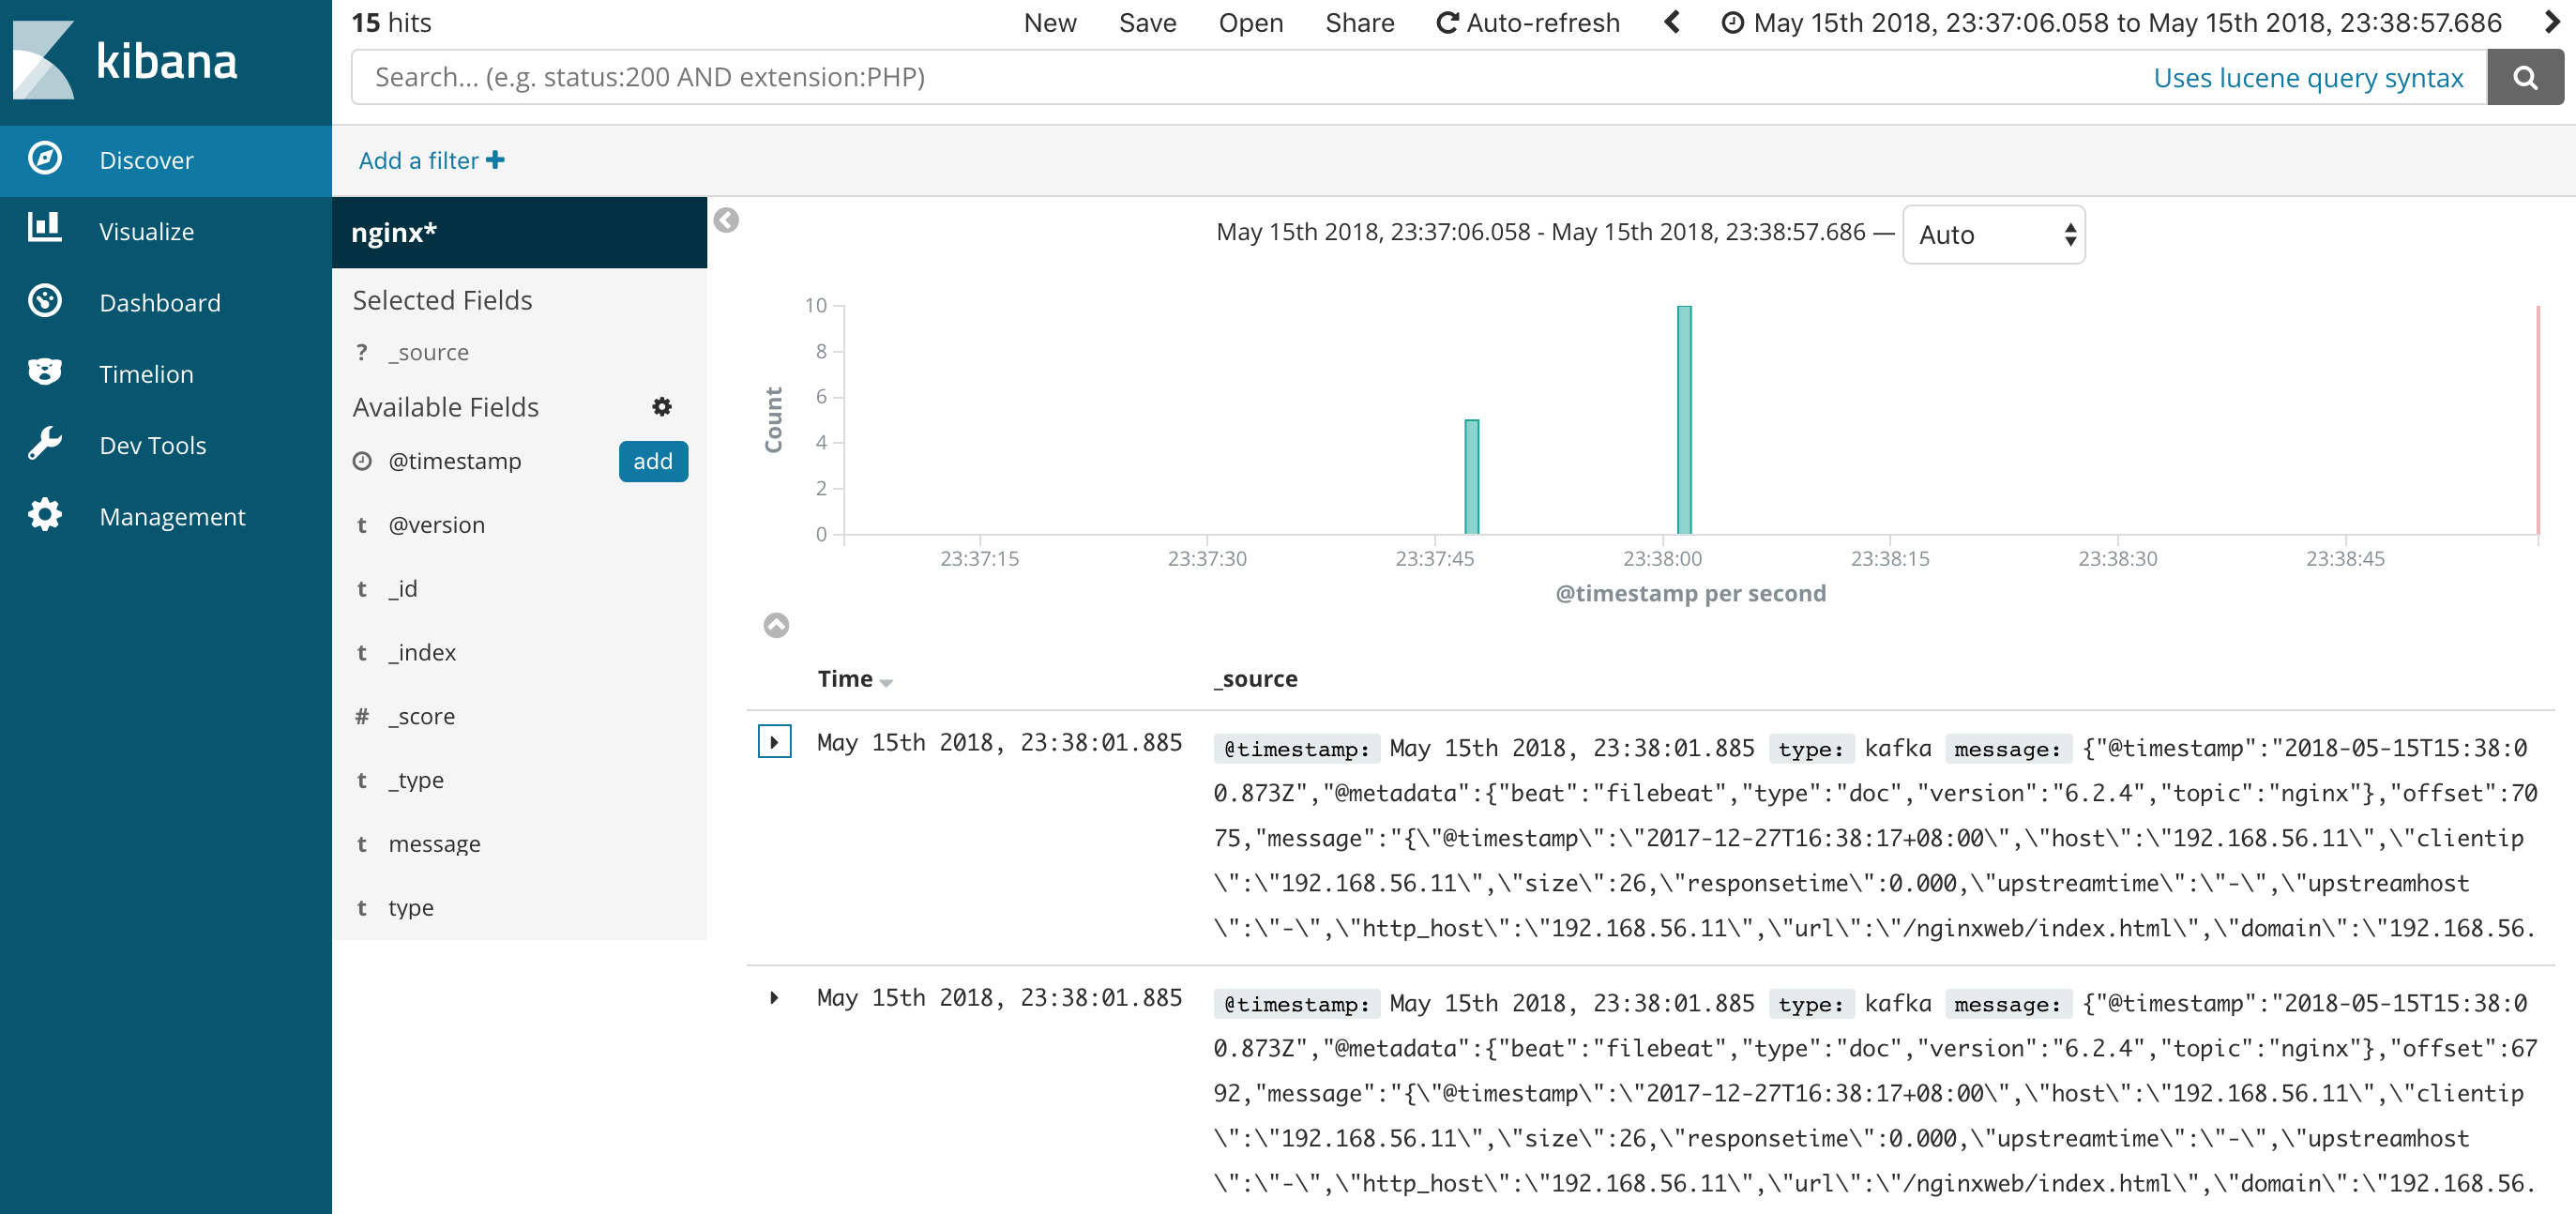
Final effect display
summary
To sum up, the whole set of components of ELK is implemented by deploying commands above, which includes the whole process of log collection, filtering, indexing and visualization. The analysis log function is implemented based on this set of systems.At the same time, by expanding the Kafka and Elasticsearch clusters horizontally, real-time processing of logs with an average daily scale of 100 million can be achieved.
The first principle of all good architecture design is not to pursue advanced, but to be reasonable, to match the business scale and development trend of the company. Any company, even if it is now a very large company, such as BAT, should start with a simple and clear system architecture.
However, with the expansion of business scope, the expansion of business scale, and the gradual complexity and size of the system, all systems are facing the problem of high availability.So how can we avoid similar problems and build highly available systems?
For this reason, I have specifically written a column "Take you to play with high availability", which combines years of experience in architecture design and battle in Baidu and Shanghai into this column.
This column contains 15 articles and is divided into three modules to explain in detail the knowledge of highly available architectures:
Concepts: Introduces the high availability architecture theory and its evolution, which is a partial theory.But there is still a need for us to understand the whole system.
Project: Describes how each layer of the common Internet hierarchy is highly available, including DNS, service, cache, data, and so on.
Question: Describes how to troubleshoot common faults on the line, including faults location in machine, application layer, etc.
Columns are updated weekly for 64 days.Over the next two months, I'll take you all to understand all aspects of a highly available architecture and throw out the issues and solutions that you encounter. I hope you don't repeat the pits I've encountered.We also look forward to interesting questions.
Column address: Take you around for high availability