This article is from: PerfMa Technical Community
Summary
Recently, our company helped a customer find a JVM problem (JDK1.8.0_191-b12), found that a system is always lost by OS Kill, caused by a memory leak.During the process of investigation, another Bug in JVM was found by mistake.This Bug is likely to cause a lot of physical memory to be used, and we've given feedback to the community and have received quick feedback, which is expected to be released in the latest version of OpenJDK8 (which is also the problem in JDK11).
PS: The user's problem was eventually solved. A design flaw that can be identified as C2 caused a large amount of memory to be used and security was not guaranteed.
Find threads consuming large memory
Next we will share the discovery process of this BUG. First, the customer tracks the progress in real time. When the memory usage increases significantly, we see a lot of 64MB memory allocation through / proc/<pid>/smaps, and Rss is almost exhausted.
7fd690000000-7fd693f23000 rw-p 00000000 00:00 0
Size:              64652 kB
Rss:               64652 kB
Pss:               64652 kB
Shared_Clean:          0 kB
Shared_Dirty:          0 kB
Private_Clean:         0 kB
Private_Dirty:     64652 kB
Referenced:        64652 kB
Anonymous:         64652 kB
AnonHugePages:         0 kB
Swap:                  0 kB
KernelPageSize:        4 kB
MMUPageSize:           4 kB
Locked:                0 kB
VmFlags: rd wr mr mw me nr sd
7fd693f23000-7fd694000000 ---p 00000000 00:00 0
Size:                884 kB
Rss:                   0 kB
Pss:                   0 kB
Shared_Clean:          0 kB
Shared_Dirty:          0 kB
Private_Clean:         0 kB
Private_Dirty:         0 kB
Referenced:            0 kB
Anonymous:             0 kB
AnonHugePages:         0 kB
Swap:                  0 kB
KernelPageSize:        4 kB
MMUPageSize:           4 kB
Locked:                0 kB
VmFlags: mr mw me nr sd
We tracked down the next system call through the strace command, then went back to the virtual address above, and found the relevant mmap system call
[pid 71] 13:34:41.982589 mmap(0x7fd690000000, 67108864, PROT_NONE, MAP_PRIVATE|MAP_ANONYMOUS|MAP_NORESERVE, -1, 0) = 0x7fd690000000 <0.000107>
The thread executing mmap is thread 71, then dump the thread through jstack, found that the corresponding thread is actually C2 CompilerThread0
"C2 CompilerThread0" #39 daemon prio=9 os_prio=0 tid=0x00007fd8acebb000 nid=0x47 runnable [0x0000000000000000]
   java.lang.Thread.State: RUNNABLE
Finally, grep takes another look at the output of strace and sees that this thread is allocating a lot of memory, totaling more than 2G.
Classic 64M Problem
The 64M problem is a classic one, and there is no such logic to allocate a large number of 64M sizes in the JVM, so you can exclude assignments that are specific to the JVM.This is actually a mechanism in glibc to allocate memory for malloc functions. glibc provides a mechanism from 2.10 onwards. To allocate memory more efficiently, glibc provides arena mechanisms. By default, each arena is 64M in size at 64 bits. Below is 64M computing logic, where sizeof(long) is 8
define DEFAULT_MMAP_THRESHOLD_MAX (4 * 1024 * 1024 * sizeof(long))
define HEAP_MAX_SIZE (2 * DEFAULT_MMAP_THRESHOLD_MAX)

p2 = (char *) MMAP (aligned_heap_area, HEAP_MAX_SIZE, PROT_NONE,
                          MAP_NORESERVE);
The maximum number of arena s a process can allocate is 8 * core under 64 bits and 2 * core under 32 bits
#define NARENAS_FROM_NCORES(n) ((n) * (sizeof (long) == 4 ? 2 : 8))

 {
              int n = __get_nprocs ();

              if (n >= 1)
                narenas_limit = NARENAS_FROM_NCORES (n);
              else
                /* We have no information about the system.  Assume two
                   cores.  */
                narenas_limit = NARENAS_FROM_NCORES (2);
            }
The benefit of this allocation mechanism is that it copes with multithreaded environments, leaving several 64M cache blocks per core, so that threads are more efficient in allocating memory without locks, and slower main_if the limit is reachedAllocated in arena.
You can set the environment variable MALLOC_ARENA_MAX sets the number of 64M blocks. When we set it to 1, we will find that all of these 64M blocks are gone, and then we will all allocate them to a large area, main_arena, indicating that this parameter is valid.
Unintentional Discovery
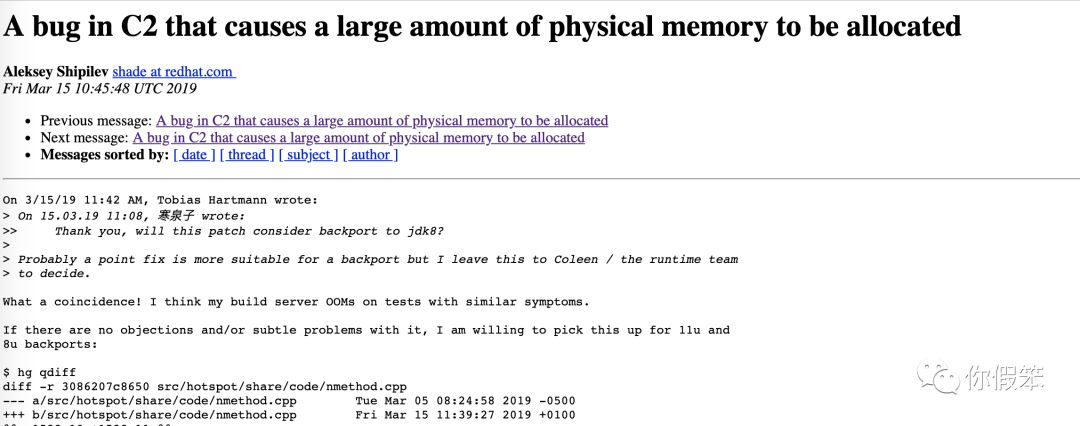
When I think back and forth about why C2 threads consume more than 2G of memory, I inadvertently trace C2 and find that the following code could cause a lot of memory consumption. The location of this code isNmethod.cppNmethod:: metadata_Do method, but if this really happens, you certainly don't see C2 threads allocating a lot, but VMThread, because the code below is mostly executed by it.
void nmethod::metadata_do(void f(Metadata*)) {
  address low_boundary = verified_entry_point();
  if (is_not_entrant()) {
    low_boundary += NativeJump::instruction_size;
    // %%% Note:  On SPARC we patch only a 4-byte trap, not a full NativeJump.
    // (See comment above.)
  }
  {
    // Visit all immediate references that are embedded in the instruction stream.
    RelocIterator iter(this, low_boundary);
    while (iter.next()) {
      if (iter.type() == relocInfo::metadata_type ) {
        metadata_Relocation* r = iter.metadata_reloc();
        // In this metadata, we must only follow those metadatas directly embedded in
        // the code.  Other metadatas (oop_index>0) are seen as part of
        // the metadata section below.
        assert(1 == (r->metadata_is_immediate()) +
               (r->metadata_addr() >= metadata_begin() && r->metadata_addr() < metadata_end()),
               "metadata must be found in exactly one place");
        if (r->metadata_is_immediate() && r->metadata_value() != NULL) {
          Metadata* md = r->metadata_value();
          if (md != _method) f(md);
        }
      } else if (iter.type() == relocInfo::virtual_call_type) {
        // Check compiledIC holders associated with this nmethod
        CompiledIC *ic = CompiledIC_at(&iter);
        if (ic->is_icholder_call()) {
          CompiledICHolder* cichk = ic->cached_icholder();
          f(cichk->holder_metadata());
          f(cichk->holder_klass());
        } else {
          Metadata* ic_oop = ic->cached_metadata();
          if (ic_oop != NULL) {
            f(ic_oop);
          }
        }
      }
    }
  }


inline CompiledIC* CompiledIC_at(RelocIterator* reloc_iter) {
  assert(reloc_iter->type() == relocInfo::virtual_call_type ||
      reloc_iter->type() == relocInfo::opt_virtual_call_type, "wrong reloc. info");
  CompiledIC* c_ic = new CompiledIC(reloc_iter);
  c_ic->verify();
  return c_ic;
}
Note that the CompiledIC *ic = CompiledIC_aboveAt(&iter);This code, because CompiledIC is a ResourceObj, this resource will be in CMalloc is allocated in heaps, but they are associated with threads. If we declare ResourceMark somewhere, it will mark the current location when executing here, and then if the thread has insufficient memory associated with it, malloc will be inserted and managed, otherwise memory reuse will occur.When the ResourceMark destructor executes, it restores the previous location from which the subsequent thread begins to reuse the memory block if it wants to allocate memory.Note that the memory block mentioned here and the 64M memory block above are not a concept.
Because this code is in a while loop, there are many repetitive calls to make it clear that where memory can be reused after one execution is not reusable, and that a large amount of memory may be allocated continuously.It may appear that physical memory is consumed much more than Xmx.
This fix is also simple, namely CompiledIC *ic = CompiledIC_At(&iter); preceded by ResourceMark rm; will do.
The main scenario in which this problem occurs is for scenarios where Class Retransform or Class Redefine are frequently and extensively done.So if you have such an agent in your system, you should still pay a little attention to this problem.
We mentioned patch to the community after this problem was discovered, but later it was found that it was actually fixed in JDK12, but it was not fixed in previous versions. When this problem was submitted to the community, someone responded quickly and may be fixed in OpenJDK1.8.0-212.
Finally, simply mention the customer side of the problem here. The main reason why C2 threads consume too much is that there is a very large method that needs to be compiled, and this compilation process requires a lot of memory consumption. That is why memory suddenly increases, so give you a suggestion, method should not be too large, if this method call alsoVery often, that would be really tragic.
Recommended reading:
JVM Parameters of PerfMa KO Series [Memory Article]
Performance issues on a single line of code locator