Learning objectives
- Know the calculation method of lane curvature
- Know the calculation of the deviation distance of the calculation center point
1. Introduction to curvature
The curvature of the curve is defined by differentiation according to the rotation rate of the tangent direction angle of a point on the curve to the arc length, indicating the degree of deviation of the curve from the straight line. A numerical value that mathematically indicates the degree of curvature of a curve at a point. The greater the curvature, the greater the degree of curvature of the curve. The reciprocal of curvature is the radius of curvature.
1.1. Curvature of a circle
There are three spheres below, tennis, basketball and the earth. The smaller the radius, the easier it is to see that it is round. Therefore, with the increase of radius, the degree of circle becomes weaker and weaker.

Defines the degree of "circle" of a sphere or circle, that is, curvature. The calculation method is:
Where rr is the radius of the sphere or circle. In this way, the smaller the radius, the greater the curvature of the circle. The straight line can be regarded as a circle with infinite radius, and its curvature is:
1.2. Curvature of curve
Different curves have different degrees of bending:
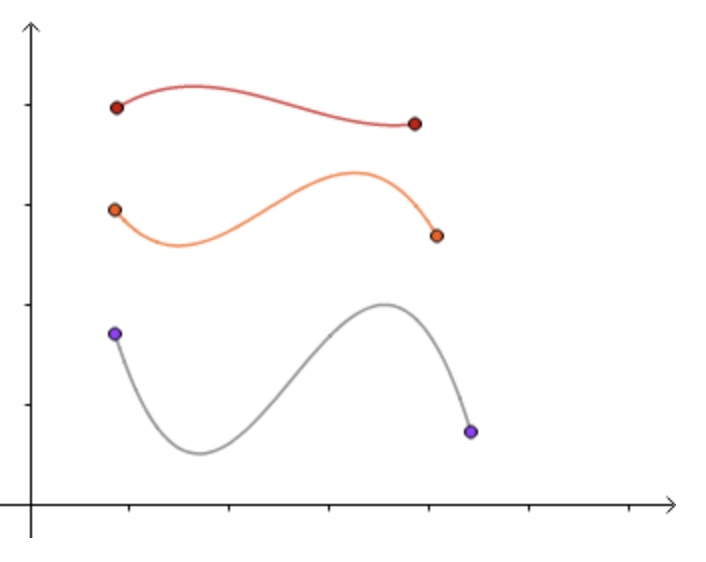
How to express the bending degree of a curve?
We know that three points determine a circle: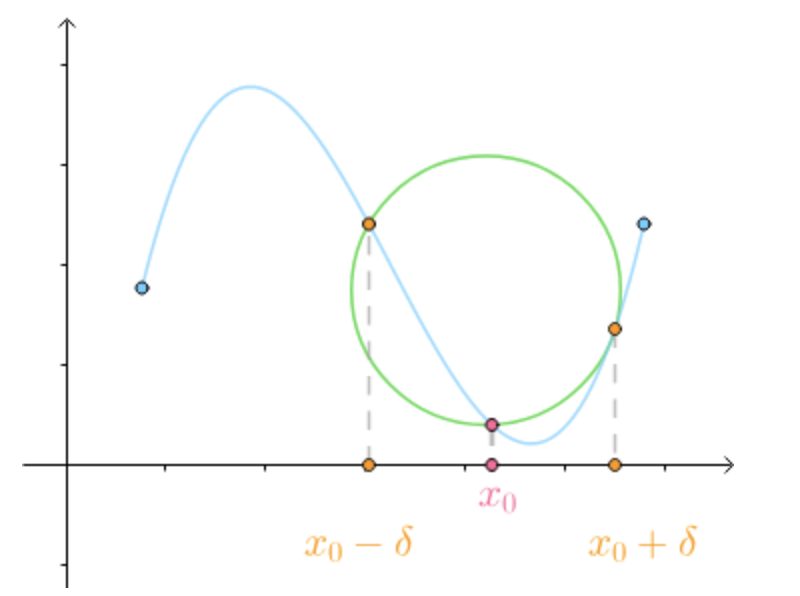
When δ When we approach 0, we can find the curve in X_ The close circle at 0x 0 , that is, the circle approximation of the curve at this point:
In addition, where the curve is relatively flat, the close circle is larger, and where the curve is relatively curved, the close circle is smaller,
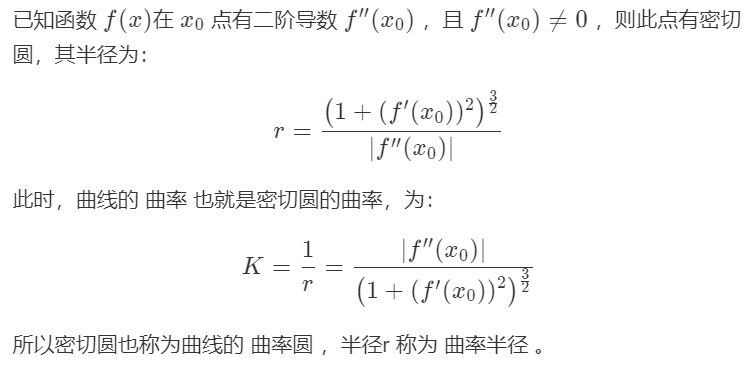
Therefore, we define the curvature of the curve by the curvature of the tangent circle, which is defined as follows:
2. Realization
The code for calculating the radius of curvature is as follows:
def cal_radius(img, left_fit, right_fit):
# The ratio of the number of pixels in the image to the actual distance
# The length along the traveling direction of the vehicle covers about 30 meters, and the width is 3.7 meters (empirical value) according to the standard of American expressway
ym_per_pix = 30 / 720 # Ratio of number of pixels in y direction to distance
xm_per_pix = 3.7 / 700 # The ratio of the number of pixels in the x direction to the distance
# Calculate each point on the curve
left_y_axis = np.linspace(0, img.shape[0], img.shape[0] - 1)
left_x_axis = left_fit[0] * left_y_axis ** 2 + left_fit[1] * left_y_axis + left_fit[2]
right_y_axis = np.linspace(0, img.shape[0], img.shape[0] - 1)
right_x_axis = right_fit[0] * right_y_axis ** 2 + right_fit[1] * right_y_axis + right_fit[2]
# Get curves in real world
left_fit_cr = np.polyfit(left_y_axis * ym_per_pix, left_x_axis * xm_per_pix, 2)
right_fit_cr = np.polyfit(right_y_axis * ym_per_pix, right_x_axis * xm_per_pix, 2)
# Obtain curve curvature in real environment
left_curverad = ((1 + (2 * left_fit_cr[0] * left_y_axis * ym_per_pix + left_fit_cr[1]) ** 2) ** 1.5) / np.absolute(
2 * left_fit_cr[0])
right_curverad = ((1 + (
2 * right_fit_cr[0] * right_y_axis * ym_per_pix + right_fit_cr[1]) ** 2) ** 1.5) / np.absolute(
2 * right_fit_cr[0])
# Show curvature on image
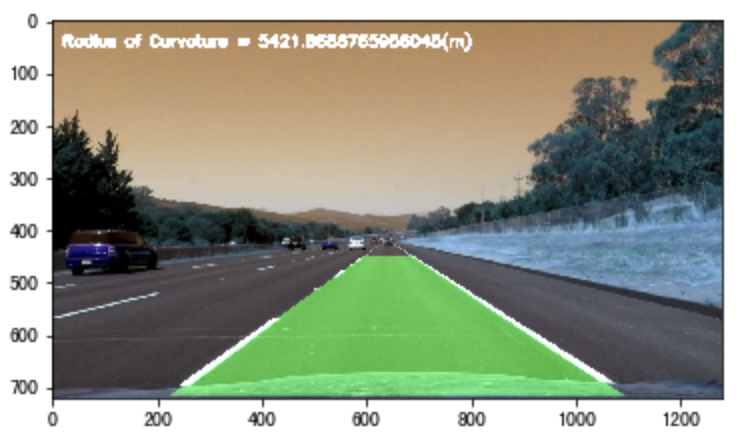
cv2.putText(img, 'Radius of Curvature = {}(m)'.format(np.mean(left_curverad)), (20, 50), cv2.FONT_ITALIC, 1,
(255, 255, 255), 5)
return imgRadius of curvature display effect:
Calculate the distance from the center:
# 1. Define the function to calculate the center point position of the image
def cal_line__center(img):
undistort_img = img_undistort(img, mtx, dist)
rigin_pipline_img = pipeline(undistort_img)
transform_img = img_perspect_transform(rigin_pipline_img, M)
left_fit, right_fit = cal_line_param(transform_img)
y_max = img.shape[0]
left_x = left_fit[0] * y_max ** 2 + left_fit[1] * y_max + left_fit[2]
right_x = right_fit[0] * y_max ** 2 + right_fit[1] * y_max + right_fit[2]
return (left_x + right_x) / 2
# 2. Assumptions_ lines2_ Line.jpg, this picture is located in the center of the lane, and the actual situation can be verified according to the measurement
img =cv2.imread("./test/straight_lines2_line.jpg")
lane_center = cal_line__center(img)
print("The center point of the lane is:{}".format(lane_center))
# 3. Calculate the distance from the center
def cal_center_departure(img, left_fit, right_fit):
# Calculation center point
y_max = img.shape[0]
left_x = left_fit[0] * y_max ** 2 + left_fit[1] * y_max + left_fit[2]
right_x = right_fit[0] * y_max ** 2 + right_fit[1] * y_max + right_fit[2]
xm_per_pix = 3.7 / 700
center_depart = ((left_x + right_x) / 2 - lane_center) * xm_per_pix
# Show offset on image
if center_depart > 0:
cv2.putText(img, 'Vehicle is {}m right of center'.format(center_depart), (20, 100), cv2.FONT_ITALIC, 1,
(255, 255, 255), 5)
elif center_depart < 0:
cv2.putText(img, 'Vehicle is {}m left of center'.format(-center_depart), (20, 100), cv2.FONT_ITALIC, 1,
(255, 255, 255), 5)
else:
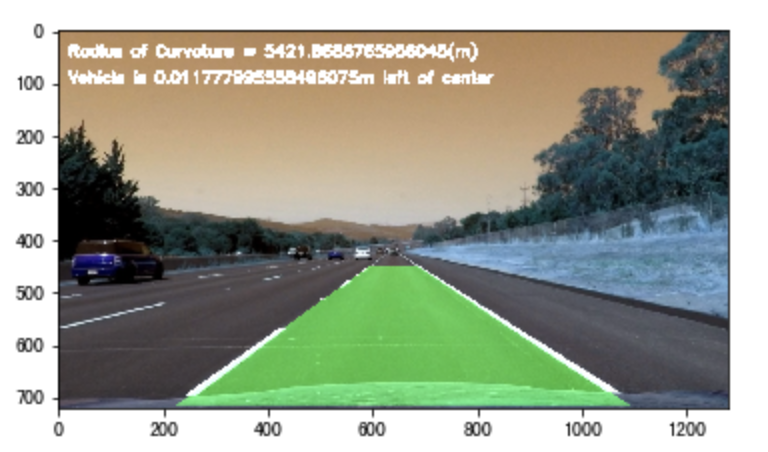
cv2.putText(img, 'Vehicle is in the center', (20, 100), cv2.FONT_ITALIC, 1, (255, 255, 255), 5)
return imgThe display effect of calculated deviation from the center is as follows:
summary
- Curvature is the degree of curvature of the curve. Here, the degree of curvature of the lane is calculated
- Off center distance: use the known image in the center to calculate the off center distance of other images
Total code summary:
# encoding:utf-8

from matplotlib import font_manager
my_font = font_manager.FontProperties(fname="/System/Library/Fonts/PingFang.ttc")

import cv2
import numpy as np
import matplotlib.pyplot as plt
#traverse folder
import glob
from moviepy.editor import VideoFileClip
import sys
reload(sys)
sys.setdefaultencoding('utf-8')


"""Parameter setting"""
nx = 9
ny = 6
#Get checkerboard data
file_paths = glob.glob("./camera_cal/calibration*.jpg")

# # Draw comparison chart
# def plot_contrast_image(origin_img, converted_img, origin_img_title="origin_img", converted_img_title="converted_img",
#                         converted_img_gray=False):
#     fig, (ax1, ax2) = plt.subplots(1, 2, figsize=(15, 20))
#     ax1.set_title = origin_img_title
#     ax1.imshow(origin_img)
#     ax2.set_title = converted_img_title
#     if converted_img_gray == True:
#         ax2.imshow(converted_img, cmap="gray")
#     else:
#         ax2.imshow(converted_img)
#     plt.show()

#Camera correction uses opencv encapsulated api
#Objective: to obtain the internal parameter, external parameter and distortion coefficient
def cal_calibrate_params(file_paths):
    #Coordinates for storing corner data
    object_points = [] #Location of corners in real 3D space
    image_points = [] #Position of corner in image space
    #Generates the location of corners in the real world
    objp = np.zeros((nx*ny,3),np.float32)
    #With the chessboard as the coordinate, the difference of each adjacent black and white chess is 1
    objp[:,:2] = np.mgrid[0:nx,0:ny].T.reshape(-1,2)
    #Corner detection
    for file_path in file_paths:
        img = cv2.imread(file_path)
        #Graying the image
        gray = cv2.cvtColor(img,cv2.COLOR_BGR2GRAY)
        #Corner detection
        rect,coners = cv2.findChessboardCorners(gray,(nx,ny),None)

        #If a corner is detected, it is saved to obtain the real coordinates and image coordinates
        if rect == True :
            object_points.append(objp)
            image_points.append(coners)
    # The camera is more serious
    ret, mtx, dist, rvecs, tvecs = cv2.calibrateCamera(object_points, image_points, gray.shape[::-1], None, None)
    return ret, mtx, dist, rvecs, tvecs

# Image de distortion: using the internal parameters corrected by the camera, the distortion coefficient
def img_undistort(img, mtx, dist):
    dis = cv2.undistort(img, mtx, dist, None, mtx)
    return dis

#Lane line extraction
#Color space conversion -- "edge detection --" color threshold -- "and use L channel to suppress white areas
def pipeline(img,s_thresh = (170,255),sx_thresh=(40,200)):
    # Copy original image
    img = np.copy(img)
    # Color space conversion
    hls = cv2.cvtColor(img,cv2.COLOR_RGB2HLS).astype(np.float)
    l_chanel = hls[:,:,1]
    s_chanel = hls[:,:,2]
    #sobel edge detection
    sobelx = cv2.Sobel(l_chanel,cv2.CV_64F,1,0)
    #Find absolute value
    abs_sobelx = np.absolute(sobelx)
    #Convert it to an 8-bit integer
    scaled_sobel = np.uint8(255 * abs_sobelx / np.max(abs_sobelx))
    #The result of edge extraction is binarized
    sxbinary = np.zeros_like(scaled_sobel)
    #The edge position is assigned 1 and the non edge position is assigned 0
    sxbinary[(scaled_sobel >= sx_thresh[0]) & (scaled_sobel <= sx_thresh[1])] = 1

    #Threshold processing for S channel
    s_binary = np.zeros_like(s_chanel)
    s_binary[(s_chanel >= s_thresh[0]) & (s_chanel <= s_thresh[1])] = 1

    # Combining the results of edge extraction and color channel,
    color_binary = np.zeros_like(sxbinary)
    color_binary[((sxbinary == 1) | (s_binary == 1)) & (l_chanel > 100)] = 1
    return color_binary

#Perspective transformation -- > converts the detection results to a top view.
#Obtain the parameter matrix of perspective transformation [four points of binary graph]
def cal_perspective_params(img,points):
    # Offset in x and y directions
    offset_x = 330
    offset_y = 0
    #Size of img after conversion
    img_size = (img.shape[1],img.shape[0])
    src = np.float32(points)
    #Set the corresponding four points in the top view: upper left corner, upper right corner, lower left corner, lower right corner
    dst = np.float32([[offset_x, offset_y], [img_size[0] - offset_x, offset_y],
                      [offset_x, img_size[1] - offset_y], [img_size[0] - offset_x, img_size[1] - offset_y]])
    ## Convert original image to top view
    M = cv2.getPerspectiveTransform(src, dst)
    # Top view to original image
    M_inverse = cv2.getPerspectiveTransform(dst, src)
    return M, M_inverse

#Complete the perspective transformation according to the perspective change matrix
def img_perspect_transform(img,M):
    #Get image size
    img_size = (img.shape[1],img.shape[0])
    #Complete the perspective change of the image
    return cv2.warpPerspective(img,M,img_size)

# Accurately locate lane lines
#Input the binary image of the image threshold result that has been edge detected, and then perform transparent transformation
def cal_line_param(binary_warped):
    #Locate the approximate position of the lane line = = calculate the histogram
    histogram = np.sum(binary_warped[:,:],axis=0) #Calculate y-axis
    # Divide the histogram into two parts to locate the left and right lane lines respectively
    midpoint = np.int(histogram.shape[0]/2)
    #Count the maximum values of the left and right lanes respectively
    midpoint = np.int(histogram.shape[0] / 2)
    leftx_base = np.argmax(histogram[:midpoint]) #Left lane
    rightx_base = np.argmax(histogram[midpoint:]) + midpoint #Right lane
    #Set sliding window
    #Number of sliding windows for each lane line
    nwindows = 9
    #Sets the height of the sliding window
    window_height = np.int(binary_warped.shape[0]/nwindows)
    #Set the detection range of sliding window width = = x, that is, half of the sliding window
    margin = 100
    #Count the number of non-zero points in the image
    nonzero = binary_warped.nonzero()
    nonzeroy = np.array(nonzero[0])#Position-x coordinate sequence of non-0 points
    nonzerox = np.array(nonzero[1])#Position -y coordinate sequence of non-zero points
    #Lane detection location
    leftx_current = leftx_base
    rightx_current = rightx_base
    #Set threshold: indicates the number of non-zero points in the current sliding window
    minpix = 50
    #Index of non-zero points in the record window
    left_lane_inds = []
    right_lane_inds = []

    #Traverse sliding window
    for window in range(nwindows):
        # Set the detection range of y in the window, because the image is (row and column), shape[0] represents the result in the y direction, and the above is 0
        win_y_low = binary_warped.shape[0] - (window + 1) * window_height #The lowest point of y
        win_y_high = binary_warped.shape[0] - window * window_height #The highest point of y
        # Range of left lane x
        win_xleft_low = leftx_current - margin
        win_xleft_high = leftx_current + margin
        # Range of right lane x
        win_xright_low = rightx_current - margin
        win_xright_high = rightx_current + margin

        # Determine whether the non zero positions X and y are in the search window, and store the indexes of X and Y in the search window in left_lane_inds and right_ lane_ In inds
        good_left_inds = ((nonzeroy >= win_y_low) & (nonzeroy < win_y_high) &
                          (nonzerox >= win_xleft_low) & (nonzerox < win_xleft_high)).nonzero()[0]
        good_right_inds = ((nonzeroy >= win_y_low) & (nonzeroy < win_y_high) &
                           (nonzerox >= win_xright_low) & (nonzerox < win_xright_high)).nonzero()[0]
        left_lane_inds.append(good_left_inds)
        right_lane_inds.append(good_right_inds)

        # If the number of obtained points is greater than the minimum number, use it to update the position of the sliding window on the x axis = the position of the corrected lane line
        if len(good_left_inds) > minpix:
            leftx_current = np.int(np.mean(nonzerox[good_left_inds]))
        if len(good_right_inds) > minpix:
            rightx_current = np.int(np.mean(nonzerox[good_right_inds]))

    # Convert the detected left and right lane points to array
    left_lane_inds = np.concatenate(left_lane_inds)
    right_lane_inds = np.concatenate(right_lane_inds)

    # Obtain the position of the detected x and y points of the left and right lanes in the image
    leftx = nonzerox[left_lane_inds]
    lefty = nonzeroy[left_lane_inds]
    rightx = nonzerox[right_lane_inds]
    righty = nonzeroy[right_lane_inds]

    # 3. Use curve fitting to fit the detected points, quadratic polynomial fitting, and the returned result is coefficient
    left_fit = np.polyfit(lefty, leftx, 2)
    right_fit = np.polyfit(righty, rightx, 2)
    return left_fit, right_fit

#Fills polygons between lane lines
def fill_lane_poly(img,left_fit,right_fit):
    #Number of rows
    y_max = img.shape[0]
    #Set the size of the filled image to 0-255
    out_img = np.dstack((img,img,img))*255
    #According to the fitting results, the lane line pixel position of the fitting curve is obtained
    left_points = [[left_fit[0] * y ** 2 + left_fit[1] * y + left_fit[2], y] for y in range(y_max)]
    right_points = [[right_fit[0] * y ** 2 + right_fit[1] * y + right_fit[2], y] for y in range(y_max - 1, -1, -1)]
    # Merge the pixels of the left and right lanes
    line_points = np.vstack((left_points, right_points))
    # Draw a polygon based on the pixel position of the left and right lane lines
    cv2.fillPoly(out_img, np.int_([line_points]), (0, 255, 0))
    return out_img

#Method for calculating curvature of lane line
def cal_readius(img,left_fit,right_fit):
    # proportion
    ym_per_pix = 30/720
    xm_per_pix = 3.7/700
    # Get each point on the lane line
    left_y_axis = np.linspace(0,img.shape[0],img.shape[0]-1) #Number img.shape[0]-1
    left_x_axis = left_fit[0]*left_y_axis**2+left_fit[1]*left_y_axis+left_fit[0]
    right_y_axis = np.linspace(0,img.shape[0],img.shape[0]-1)
    right_x_axis = right_fit[0]*right_y_axis**2+right_fit[1]*right_y_axis+right_fit[2]

    # The points in the curve are mapped to the real world, and then the curvature is calculated
    left_fit_cr = np.polyfit(left_y_axis*ym_per_pix,left_x_axis*xm_per_pix,2)
    right_fit_cr = np.polyfit(right_y_axis*ym_per_pix,right_x_axis*xm_per_pix,2)

    # Calculate curvature
    left_curverad = ((1+(2*left_fit_cr[0]*left_y_axis*ym_per_pix+left_fit_cr[1])**2)**1.5)/np.absolute(2*left_fit_cr[0])
    right_curverad = ((1+(2*right_fit_cr[0]*right_y_axis*ym_per_pix *right_fit_cr[1])**2)**1.5)/np.absolute((2*right_fit_cr[0]))

    # What does radius of curvature render on the image
    cv2.putText(img,'Radius of Curvature = {}(m)'.format(np.mean(left_curverad)),(20,50),cv2.FONT_ITALIC,1,(255,255,255),5)
    return img

# Calculate the location of the center of the lane line
def cal_line_center(img):
    #De distortion
    undistort_img = img_undistort(img,mtx,dist)
    #Extract lane lines
    rigin_pipeline_img = pipeline(undistort_img)
    #Perspective transformation
    trasform_img = img_perspect_transform(rigin_pipeline_img,M)
    #Precise positioning
    left_fit,right_fit = cal_line_param(trasform_img)
    #Shape of current image [0]
    y_max = img.shape[0]
    #Left lane line
    left_x = left_fit[0]*y_max**2+left_fit[1]*y_max+left_fit[2]
    #Right lane line
    right_x = right_fit[0]*y_max**2+right_fit[1]*y_max+right_fit[2]
    #Return to Lane center point
    return (left_x+right_x)/2

def cal_center_departure(img,left_fit,right_fit):
    # Calculation center point
    y_max = img.shape[0]
    left_x = left_fit[0]*y_max**2 + left_fit[1]*y_max +left_fit[2]
    right_x = right_fit[0]*y_max**2 +right_fit[1]*y_max +right_fit[2]
    xm_per_pix = 3.7/700
    center_depart = ((left_x+right_x)/2-lane_center)*xm_per_pix
    # Render
    if center_depart>0:
        cv2.putText(img,'Vehicle is {}m right of center'.format(center_depart), (20, 100), cv2.FONT_ITALIC, 1,
                    (255, 255, 255), 5)
    elif center_depart<0:
        cv2.putText(img, 'Vehicle is {}m left of center'.format(-center_depart), (20, 100), cv2.FONT_ITALIC, 1,
                    (255, 255, 255), 5)
    else:
        cv2.putText(img, 'Vehicle is in the center', (20, 100), cv2.FONT_ITALIC, 1, (255, 255, 255), 5)
    return img

#Calculate the distance of the vehicle from the center point
def cal_center_departure(img,left_fit,right_fit):
    # Calculation center point
    y_max = img.shape[0]
    #Left lane line
    left_x = left_fit[0]*y_max**2 + left_fit[1]*y_max +left_fit[2]
    #Right lane line
    right_x = right_fit[0]*y_max**2 +right_fit[1]*y_max +right_fit[2]
    #The distance represented by each pixel in the x direction
    xm_per_pix = 3.7/700
    #Calculate offset distance pixel distance ×  xm_per_pix = actual distance
    center_depart = ((left_x+right_x)/2-lane_center)*xm_per_pix
    # Render
    if center_depart>0:
        cv2.putText(img,'Vehicle is {}m right of center'.format(center_depart), (20, 100), cv2.FONT_ITALIC, 1,
                    (255, 255, 255), 5)
    elif center_depart<0:
        cv2.putText(img, 'Vehicle is {}m left of center'.format(-center_depart), (20, 100), cv2.FONT_ITALIC, 1,
                    (255, 255, 255), 5)
    else:
        cv2.putText(img, 'Vehicle is in the center', (20, 100), cv2.FONT_ITALIC, 1, (255, 255, 255), 5)
    return img

if __name__ == "__main__":
    ret, mtx, dist, rvecs, tvecs = cal_calibrate_params(file_paths)
    #Perspective transformation
    #Get the four points of the original drawing
    img = cv2.imread('./test/straight_lines2.jpg')
    points = [[601, 448], [683, 448], [230, 717], [1097, 717]]
    #Draw four points on the image (file, coordinate start point, coordinate end point, color, connect)
    img = cv2.line(img, (601, 448), (683, 448), (0, 0, 255), 3)
    img = cv2.line(img, (683, 448), (1097, 717), (0, 0, 255), 3)
    img = cv2.line(img, (1097, 717), (230, 717), (0, 0, 255), 3)
    img = cv2.line(img, (230, 717), (601, 448), (0, 0, 255), 3)

    #Matrix of perspective transformation
    M,M_inverse = cal_perspective_params(img,points)
    #Calculate the center distance of the lane line
    lane_center = cal_line_center(img)