Hyperledger Fabric is a blockchain that emphasizes operation and maintenance. Since version 1.4, Fabric has included features for operation and maintenance of peer and orderer nodes. This tutorial will introduce how to configure the operation and maintenance management service of Fabric network nodes, and how to use Prometheus and statsD/Graphite to visually monitor the real-time operation indicators of each node in the hyperledger Fabric network.
Related tutorials: Java development details of Fabric blockchain | Development details of Fabric blockchain Node.JS
1. Configure the operation and maintenance service of the Hyperledger Fabric node
Hyperledger Fabric 1.4 provides the following features for the operation and maintenance service API of peer and orderer nodes:
- Log level management / logspec
- Node health check / health Hz
- Operation monitoring indicators / metrics
Although the operation and maintenance service of configuring Fabric blockchain nodes is not cutting-edge rocket technology, it will not be so easy if you miss some details.
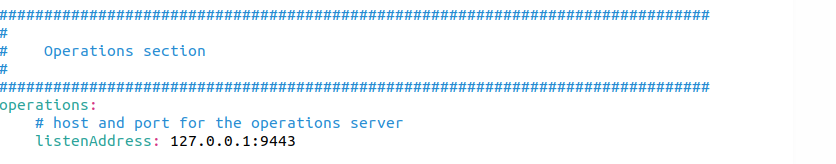
First, modify the core.yaml to configure the operation and maintenance service of the peer node, mainly including the configuration of listening address and TLS (we temporarily disable this part).
Open core.yaml with an editor:
$ vi ~/fabric-samples/config/core.yaml
The following figure shows the default value of the operation and maintenance service listening address of the peer node:
Now let's start the BYFN network and try to access the log level api.
$ cd ~/fabric-samples/first-network
$ ./byfn.sh -m up
$ docker exec -it cli bash

# curl peer0.org1.example.com:9443/logspec
Unfortunately, the curl command returned the following error:
curl: (7) Failed to connect to peer0.org1.example.com port 9443: Connection refused
Let's see why.
First, check our O & M service configuration and open the core.yaml file:
# vi /etc/hyperledger/fabric/core.yaml
As you may remember, we use 127.0.0.1 as the value of listenAddress, which means The O & M api is not accessible from outside.
Let's do the necessary things in the peer container to check again. This time we will use wget instead Curl, because curl is not installed in the container.
$ docker exec -it peer0.org1.example.com bash

# wget peer0.org1.example.com:9443/logspec
As expected, the error message reappears:
Connecting to peer0.org1.example.com (peer0.org1.example.com)... failed: Connection refused
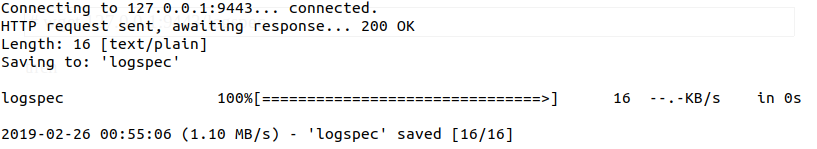
But if you use 127.0.0.1 to connect, you will succeed:
# wget 127.0.0.1:9443/logspec
The results are as follows:
This indicates that we need to set the monitoring address of operation and maintenance.
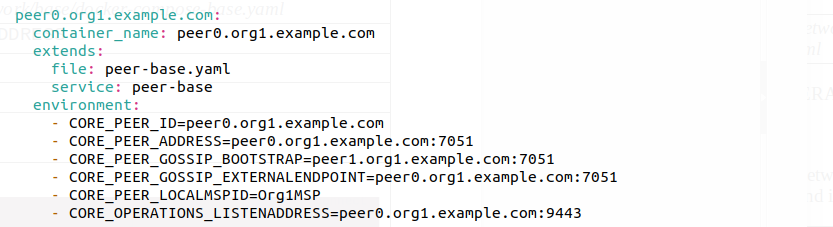
To do this, modify the docker compose file to specify the core ﹐ operations ﹐ listenaddress environment variable for each peer.
$ vi ~/fabric-samples/first-network/base/docker-compose-base.yaml
Refer to the following figure for modification:
Now let's try to access the / logspec API again, and don't forget to restart the BYFN network.
$ docker exec -it cli bash

# curl peer0.org1.example.com:9443/logspec
The output results are as follows:

Similarly, we can check node health:
# curl peer1.org1.example.com:9443/healthz
The output results are as follows:

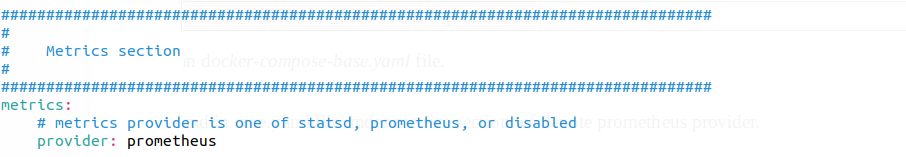
Finally, in docker-compose-base.yaml, for each peer, set ore ﹣ metrics ﹣ provider = prometheus to enable the prometheus indicator, and modify core.yaml to declare that the indicator provider is prometheus:
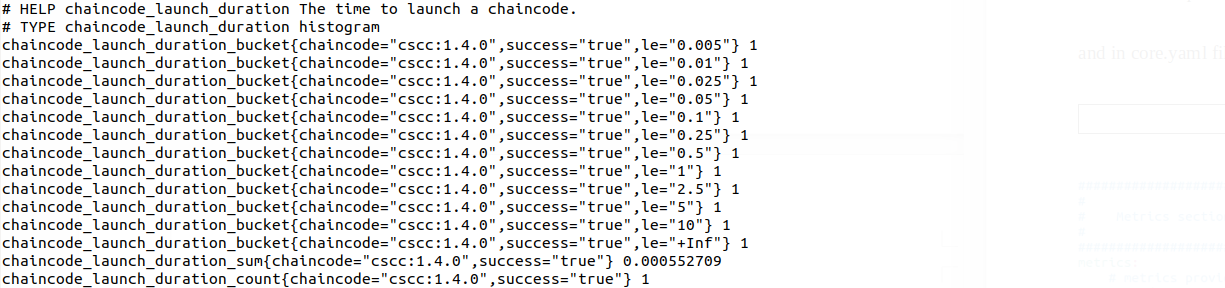
If the configuration is correct, executing the following command in the cli container will output the current value of a set of monitoring indicators:
2. Using Prometheus to monitor the operation index of Hyperledger Fabric network
First download and unzip the latest version of Prometheus:
$ curl -LO https://github.com/prometheus/prometheus/releases/download/v2.7.1/prometheus-2.7.1.linux-amd64.tar.gz \
$ tar -xvzf prometheus-2.7.1.linux-amd64.tar.gz
The prometheus.yml file can be found in the Prometheus folder. We need to modify this file in order to grab the running index data of the Hyperledger Fabric: add the job name and targets in the section of "graph" config.
Now we can use docker to run prometheus:
$ sudo docker run -d --name prometheus-server -p 9090:9090 \
  --restart always \
  -v /home/mccdev/prometheus/prometheus/prometheus.yml:/prometheus.yml \
  prom/prometheus \
  --config.file=/prometheus.yml
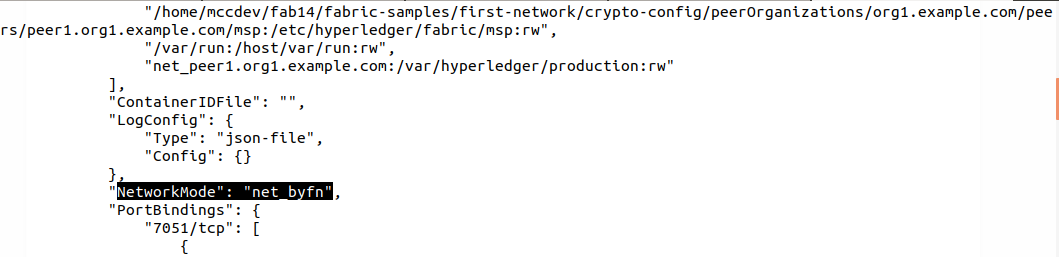
Note that since docker always starts the container on the private network, we need to add the prometheus container to the fabric network. View the fabric network with the following command:
$ docker inspect peer1.org1.example.com
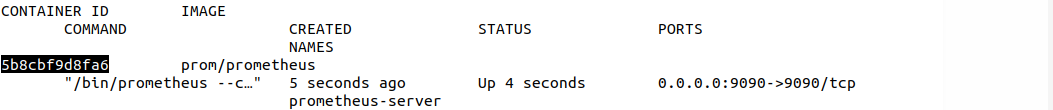
Connect the prometheus container to the fabric network:
$ sudo docker network connect net_byfn 5b8cbf9d8fa6
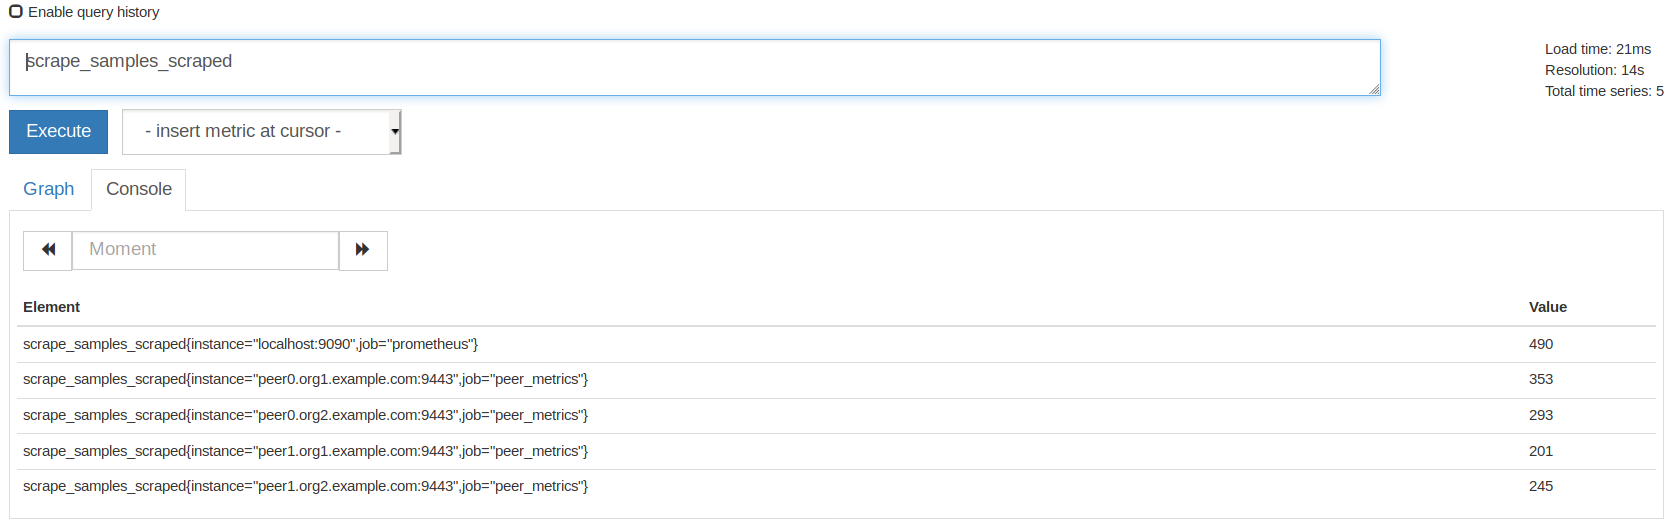
Statistics can be accessed at: http://localhost:9090/
To check whether the running indicators of the peer are successfully captured, enter "trace samples" to view the result table. The content should be non empty.
3. Using StatsD/Graphite to monitor the operation index of Hyperledger Fabric network
Now we use StatsD to visually monitor the running indicators of Fabric network. Prometheus is pull mode, while StatsD uses push mode.
First of all, we need to start from Here Get docker images of Graphite and StatsD.
Then, start the graphite container:
$ docker run -d\
 --name graphite\
 --restart=always\
 -p 80:80\
 -p 2003-2004:2003-2004\
 -p 2023-2024:2023-2024\
 -p 8125:8125/udp\
 -p 8126:8126\
 graphiteapp/graphite-statsd
Now it's time to change the docker-copose-base.yaml. Each peer should set the following environment variables:
CORE_OPERATIONS_LISTENADDRESS
CORE_METRICS_PROVIDER
CORE_METRICS_STATSD_ADDRESS
CORE_METRICS_STATSD_NETWORK
CORE_METRICS_STATSD_PREFIX
We should also ensure that port 8125 is specified. The configuration example of peer is as follows:
peer0.org1.example.com:
  container_name: peer0.org1.example.com
  extends:
   file: peer-base.yaml
   service: peer-base
  environment:
   - CORE_PEER_ID=peer0.org1.example.com
   - CORE_PEER_ADDRESS=peer0.org1.example.com:7051
   - CORE_PEER_GOSSIP_BOOTSTRAP=peer1.org1.example.com:7051
   - CORE_PEER_GOSSIP_EXTERNALENDPOINT=peer0.org1.example.com:7051
   - CORE_PEER_LOCALMSPID=Org1MSP
   # metrics
   - CORE_OPERATIONS_LISTENADDRESS=peer0.org1.example.com:8125
   - CORE_METRICS_PROVIDER=statsd
   - CORE_METRICS_STATSD_ADDRESS=graphite:8125
   - CORE_METRICS_STATSD_NETWORK=udp
   - CORE_METRICS_STATSD_PREFIX=PEER_01
  volumes:
     - /var/run/:/host/var/run/
     - ../crypto-config/peerOrganizations/org1.example.com/peers/peer0.org1.example.com/msp:/etc/hyperledger/fabric/msp
     - ../crypto-config/peerOrganizations/org1.example.com/peers/peer0.org1.example.com/tls:/etc/hyperledger/fabric/tls
     - peer0.org1.example.com:/var/hyperledger/production
  ports:
   - 7051:7051
   - 7053:7053
   - 8125:8125
Note the ports used: for peer0, the port should be 8125:8125, for peer1, 9125:8125, and so on.
The Orderer should be configured as follows:
- ORDERER_OPERATIONS_LISTENADDRESS=orderer.example.com:8125
- ORDERER_METRICS_PROVIDER=statsd
- ORDERER_METRICS_STATSD_ADDRESS=graphite:8125
- ORDERER_METRICS_STATSD_NETWORK=udp
- ORDERER_METRICS_STATSD_PREFIX=ORDERER

ports:
   - 7125:8125
Now let's start the BYFN network.
Remember to connect the graphite container to the BYFN network, otherwise you will see the following error:
Error: error getting endorser client for channel: endorser client failed to
connect to peer0.org1.example.com:7051: failed to create new connection:
context deadline exceeded
The log of the peer container will show that the graphite was not found in the network:
Error: failed to initialize operations subystems: dial udp: lookup graphite
on 127.0.0.11:53: no such host
Use the following command to connect the graphite container to the fabric network:
$ sudo docker network connect net_byfn graphite
If everything is normal, you should be able to see the operation indicators at the following address:
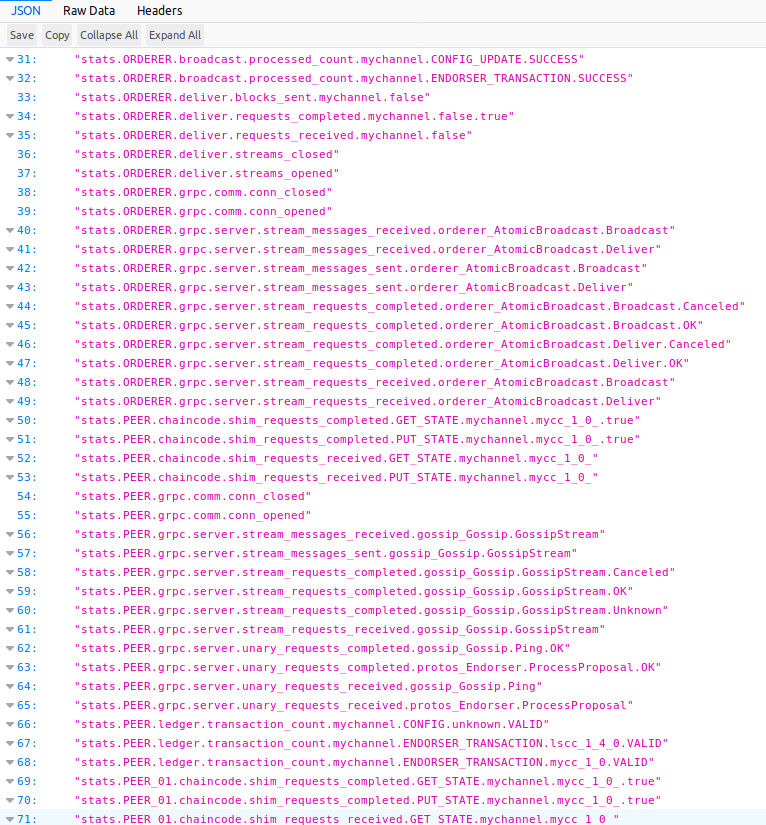
http://localhost/metrics/index.json
The results are as follows:
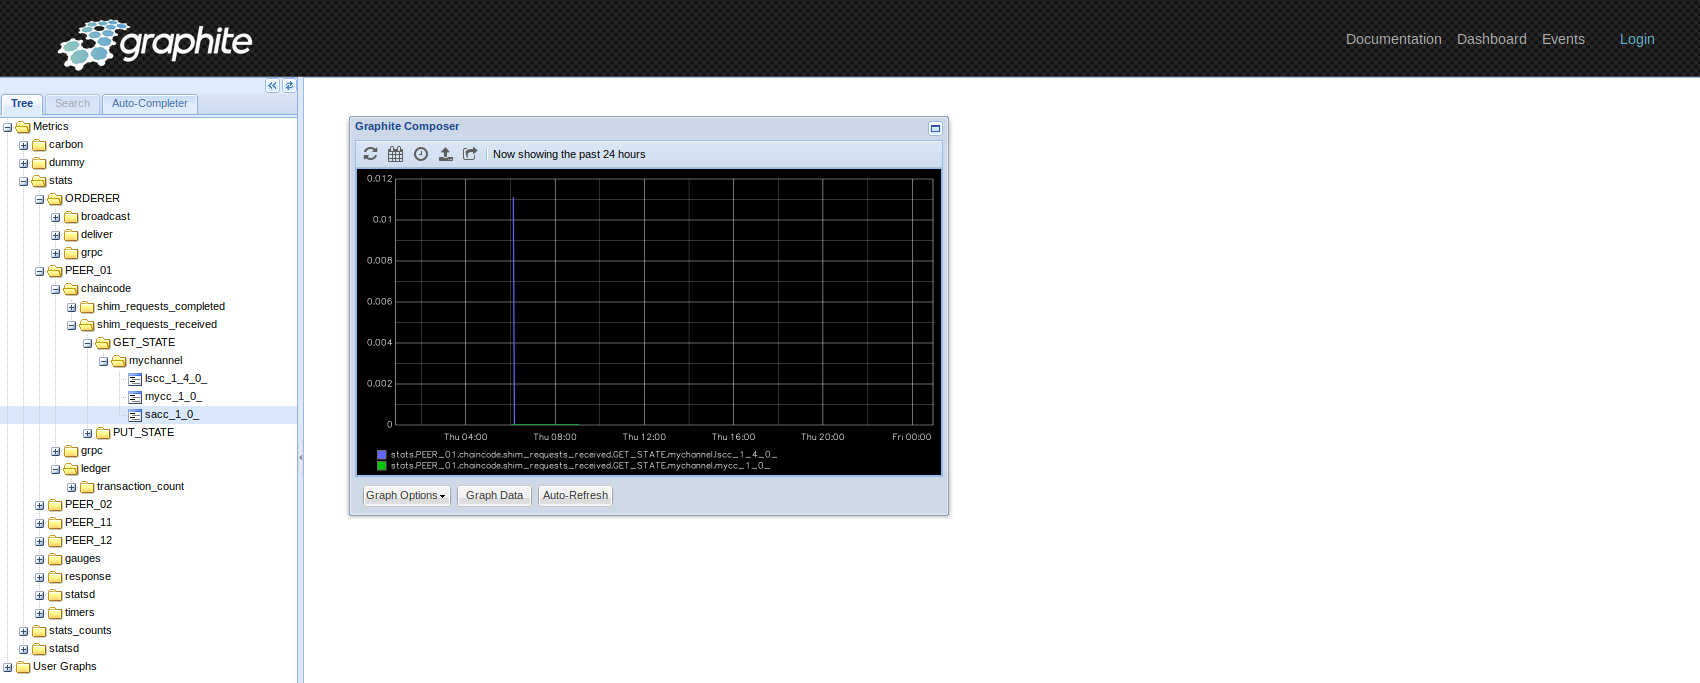
Visit the following address to view the visualized data:
http://localhost/
The results page is as follows:
4. Summary of the course
In this tutorial, we learned how to configure the O & M service API of the nodes of the hyperledger fabric, and how to use Prometheus or StatsD to visually monitor the operation of the hyperledger fabric. If you want to further study the development of hyperledger fabric blockchain code and application, you can refer to these two online interactive tutorials:
- Hyperledger Fabric blockchain Java development details
- Hyperledger Fabric blockchain Node.JS development details
Original link: Operation and maintenance service and visual monitoring of Hyperledger Fabric - Huizhi network