Blog Outline:
- I. deploy weave scope
- II. Start configuration
- 1. Run Node Server container
- 2. Run the C advisor container
- 3. Run Prometheus server container on docker01
- 4. Run the grafana container on docker01
- 5. Set Prometheus alarm
Prometheus is a system and service monitoring system. It collects metrics from configured targets at a given time interval, evaluates rule expressions, displays results, and triggers alerts when certain conditions are found to be true.
Compared with other monitoring systems, Prometheus has the following characteristics:
- A multidimensional data model (time series is defined by indicator name and set key / value size)
- A flexible query language to take advantage of this dimension
- Independent of distributed storage; single server nodes are autonomous
- Time series collection is conducted through pull model over HTTP
- Push time series through intermediate gateway
- Discover targets through service discovery or static configuration
- Multiple graphics and dashboard support modes
- Support tiering and horizontal alignment
The official architecture is as follows:
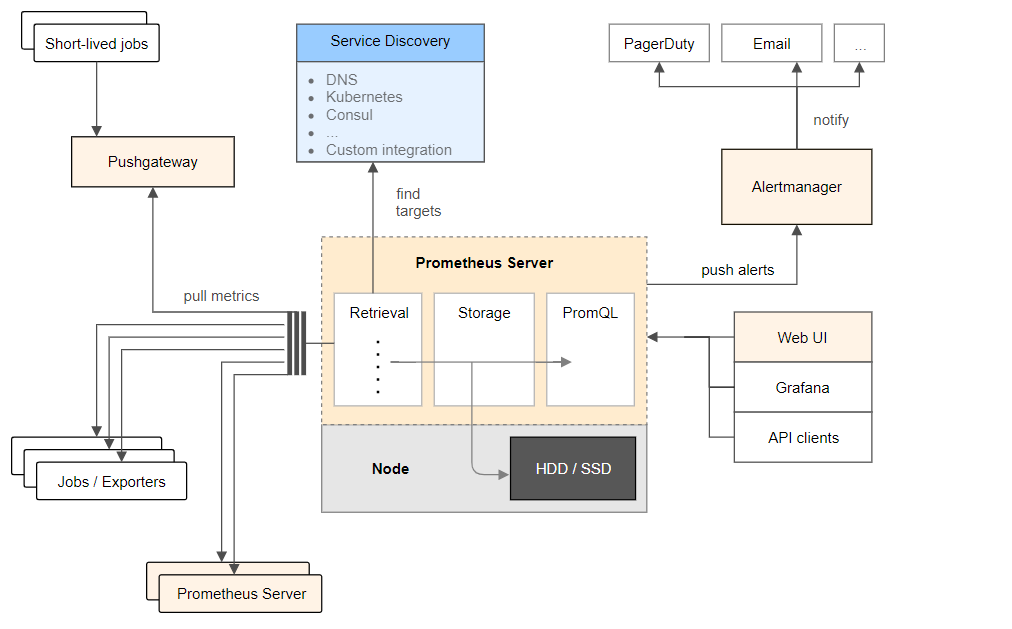
Deploy the service, including four components: Prometheus server, node exporter, cdadvrisor, and Grafana.
The functions of each component are as follows:
- Prometheus server: the main server of Prometheus service;
- Node exporter: collect information about Host hardware and operating system;
- Cdadvrisor: responsible for collecting container information running on the Host;
- Grafana: used to show Prometheus monitoring operation interface (provide us with a friendly web interface).
For all the above four components, please go to Github official website , directly search the corresponding docker image name (in the following deployment process, each container running a service will specify its image name, which can be searched by referring to the image name in the command). You can find the detailed introduction of the component, which will not be introduced here.
I. environmental preparation
My environment here is as follows: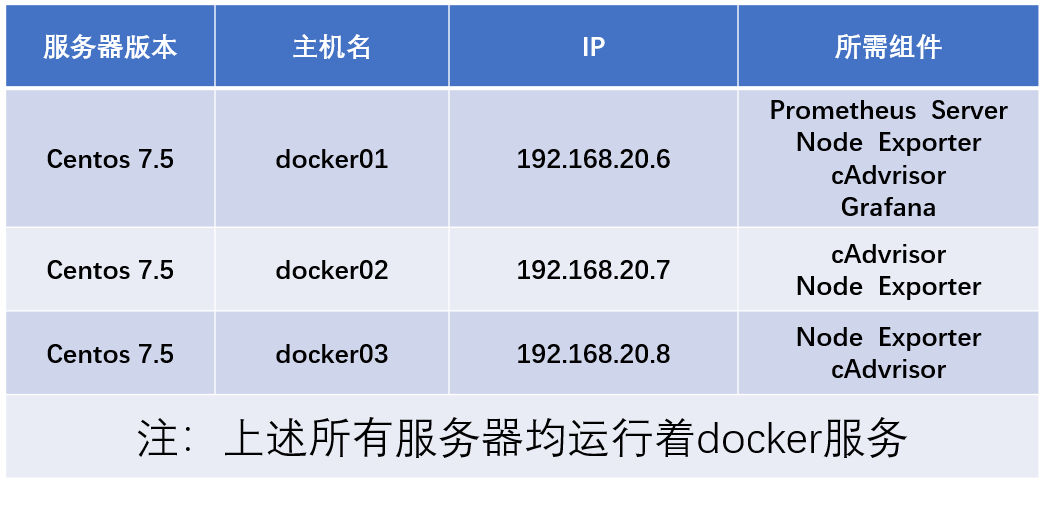
II. Start configuration
1. Run Node Server container
This component needs to run on all hosts that need to be monitored, that is, the three servers here need to execute the following command to run this container component.
[root@docker01 ~]# docker run -d -p 9100:9100 -v /proc:/host/proc -v /sys:/host/sys -v /:/rootfs --net=host --restart=always prom/node-exporter --path.procfs /host/proc --path.sysfs /host/sys --collector.filesystem.ignored-mount-points "^/(sys|proc|dev|host|etc)($|/)"
#Based on the "Prom / node exporter" image running container, you can search the image on github official website to understand its main functions
#Note: each host to be monitored needs to execute the above command to run the container to collect host information
After each server runs the above command, the browser accesses the IP address + 9100 port of the docker server and can see the following interface, which means that there is no problem with the container running. It doesn't matter if we don't understand the content. The information is not meant to be shown to us. We are looking at the web interface provided to us at the end. See the following page: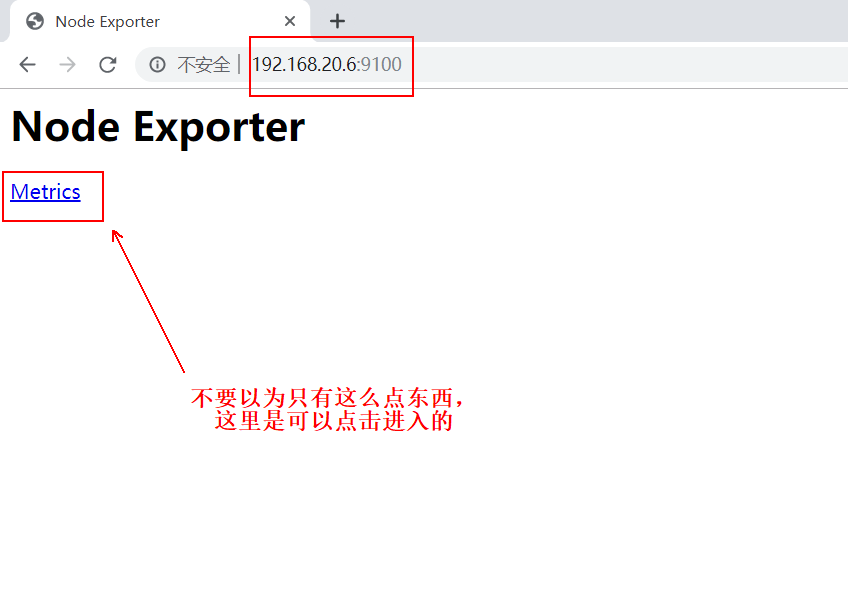
It's a good idea to visit port 9100 of all servers running the above containers to make sure you can see the above page.
2. Run the C advisor container
Cdadvrisor is responsible for collecting container information running on the Host. Similarly, run the cdadvrisor container by executing the following command on all servers that need to be monitored:
[root@docker01 ~]# docker run -v /:/rootfs:ro -v /var/run:/var/run:rw -v /sys:/sys:ro -v /var/lib/docker:/var/lib/docker:ro -p 8080:8080 --detach=true --name=cadvisor --net=host google/cadvisor
After each server runs the above command, the browser accesses the IP address of the server + port 8080, and you can see the following page:
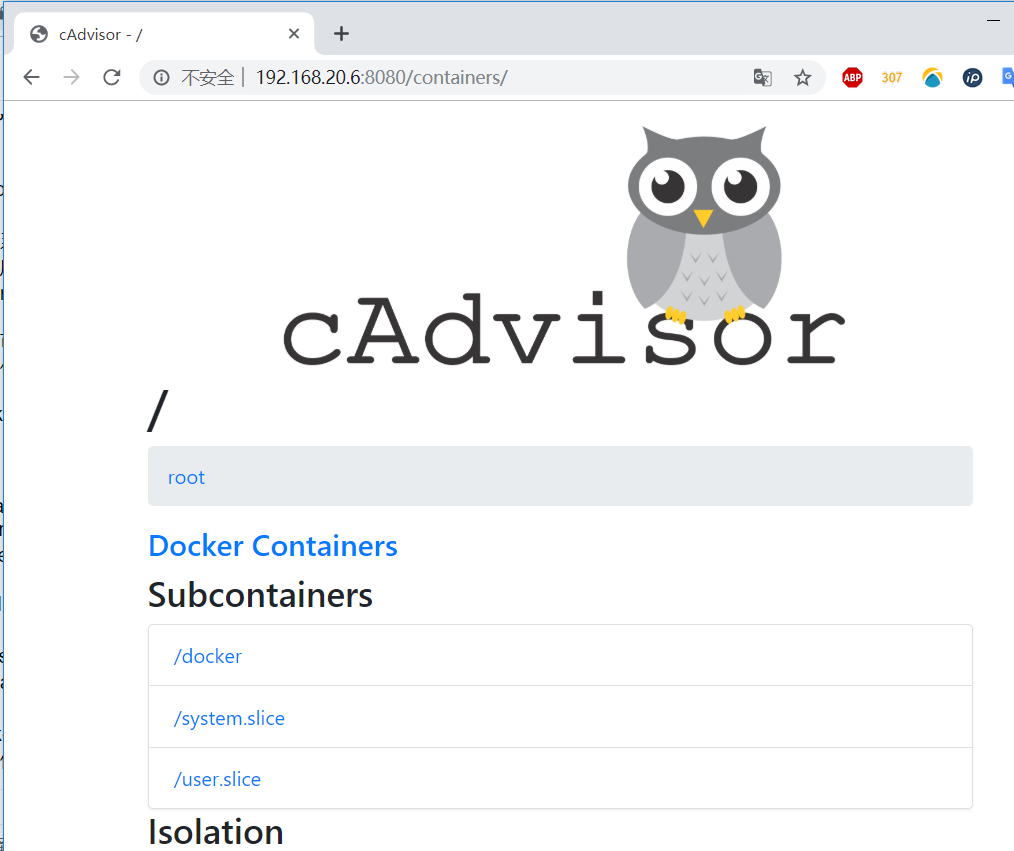
Similarly, it is best to access port 8080 of each server in order to confirm success.
3. Run Prometheus server container on docker01
Prometheus server is the primary server, so you only need to run this container on one of them. Here I run on the docker01 server:
[root@docker01 ~]# docker run -d -p 9090:9090 --name prometheus --net=host prom/prometheus
#First, run a container randomly based on the prom/prometheus image. We need to copy a copy of its main configuration file to make changes.
[root@docker01 ~]# docker cp prometheus:/etc/prometheus/prometheus.yml /root/
#Copy the master profile from the prometheus container to the host local
[root@docker01 ~]# docker rm -f prometheus     #Delete the container you just created
[root@docker01 ~]# vim prometheus.yml     #Open the copied configuration file and jump to the last line of the configuration file.
                  .......................#Omit part of the content
#Amend to read:
- targets: ['localhost:9090','localhost:8080','localhost:9100','192.168.20.7:9100','192.168.20.7:8080','192.168.20.8:9100','192.168.20.8:8080']
#The above contents seem to be disorderly, but in fact, they only specify the three ports of 9090, 8080 and 9100.
#Port 8080 and 9100 of the other two monitored servers are added.
#If more servers need to be monitored, just add them one by one. Of course, the monitored end needs to run the first two containers.
#After modification, save and exit.
[root@docker01 ~]# docker run -d -p 9090:9090 -v /root/prometheus.yml:/etc/prometheus/prometheus.yml --name prometheus --net=host prom/prometheus
#Execute the above command, run the new prometheus container, and mount the main configuration file just modified to the specified location in the container
#In the future, if you want to modify the main configuration file, you can directly modify the local one.
#After the master configuration file is mounted, the local and the container are equivalent to the same copy. If the content is modified locally, it will be synchronized to the container.
When the client accesses port 9090 of docker01, it will see the following page:

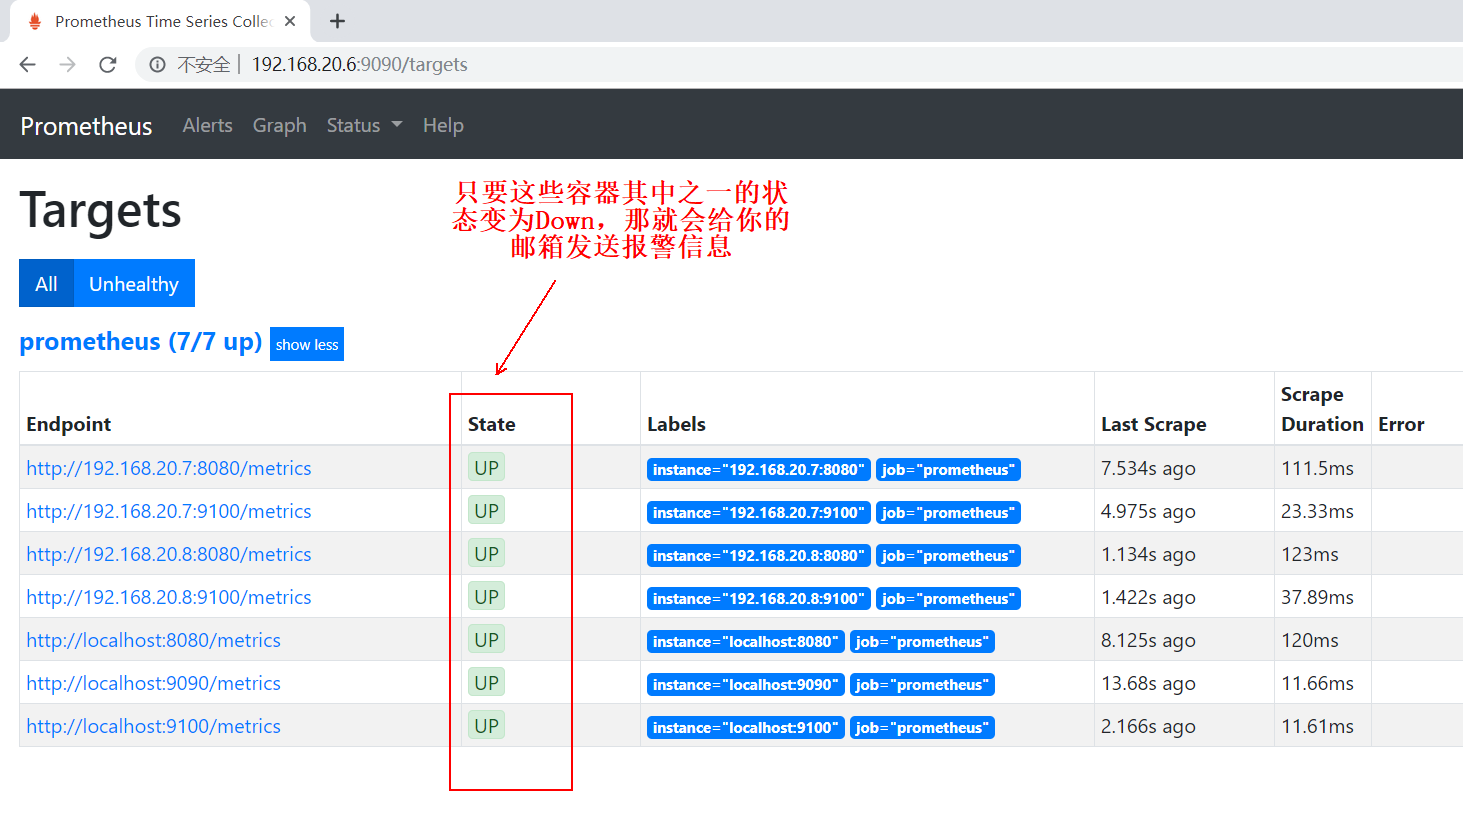
Then click "status" above, and then click "Targets", as shown below: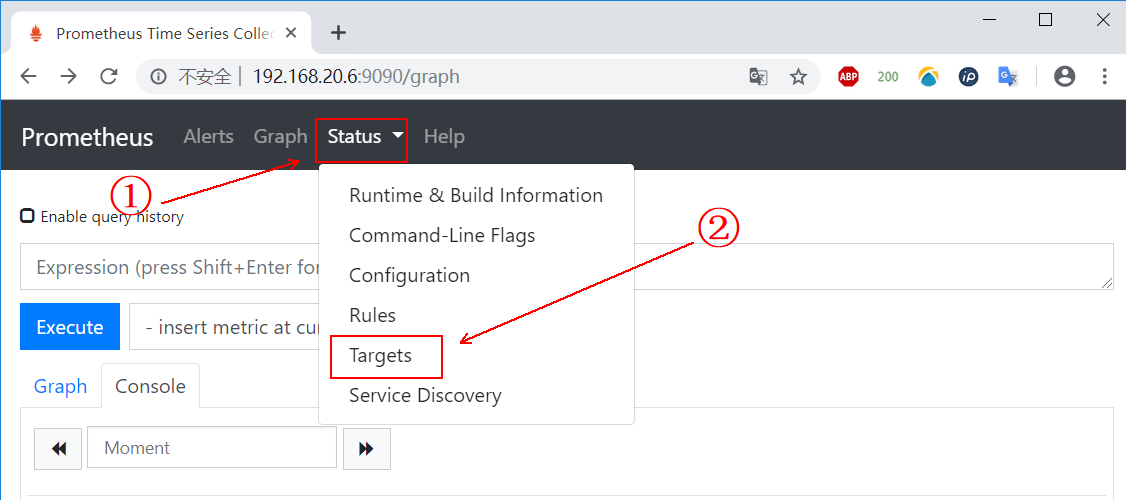
If you see the following page, all operations to this point are OK:

4. Run the grafana container on docker01
This container is to provide us with a friendly web presentation page.
[root@docker01 ~]# mkdir grafana-storage
[root@docker01 ~]# chmod 777 -R grafana-storage/
[root@docker01 ~]# docker run -d -p 3000:3000 --name grafana -v /root/grafana-storage:/var/lib/grafana -e "GF_SECURITY_ADMIN_PASSWORD=123.com" grafana/grafana
#The "- e" option in the above command is to set the default login user admin with the password "123.com".
#If you prompt iptables and other related error messages during container startup,
#You need to execute the command systemctl restart docker, restart the docker service, and then run the container again
#However, it should be noted that if the "- restart=always" option is not added when running the container,
#After restarting the docker service, you need to manually restart all containers.
#Restart all container commands "docker ps -a -q | xargs docker start"
After the container is running, you can use the client to access the docker01IP address + 3000 port, and you can see the following page:

On the above login page, enter the user name "admin", and the password is the password we specified at runtime. Here I am "123.com". After entering, log in, and you will see the following interface, and then click add data source: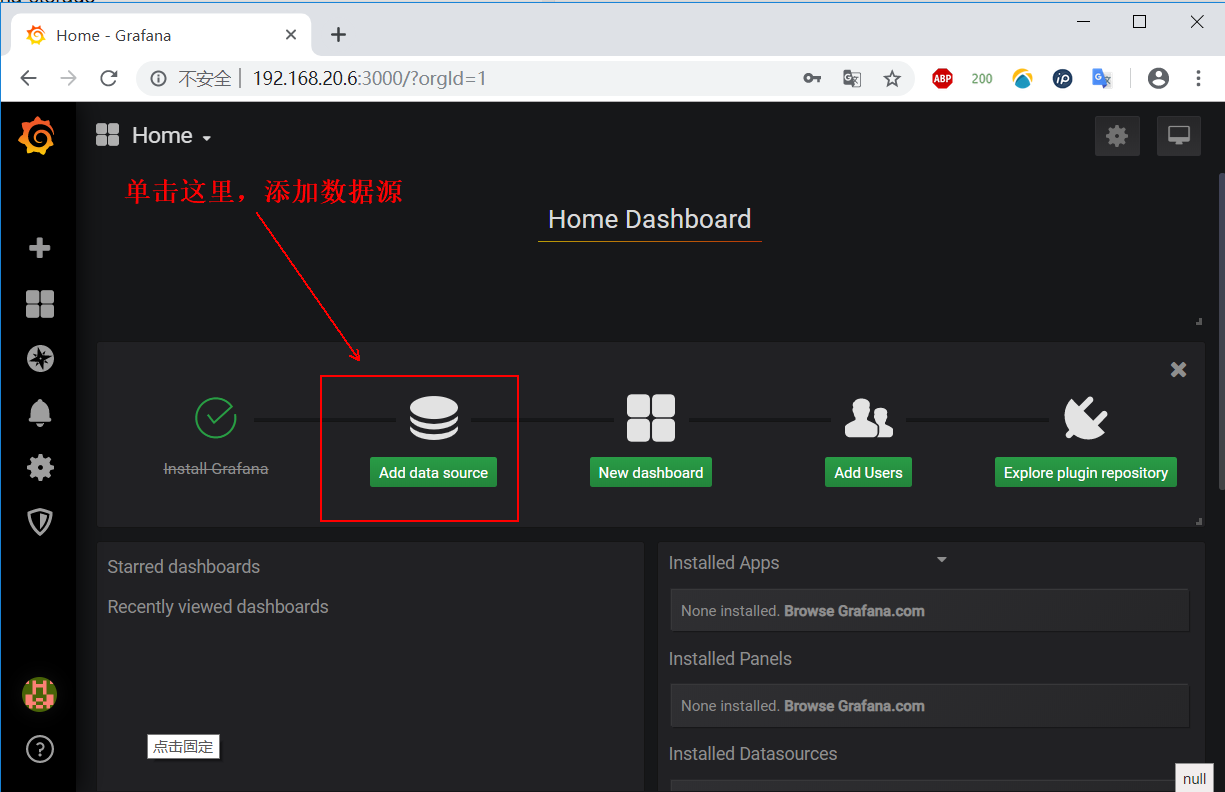
See the following interface, find Prometheus, and click "select" to select it:

Modify the configuration according to the prompts given in the following figure:

After the above configuration is completed, we need to configure it in what form to show us. It can be customized, but it's very troublesome. I choose to go directly. grafana official website Look for out of the box templates.
Sign in grafana official website , click on the following options:
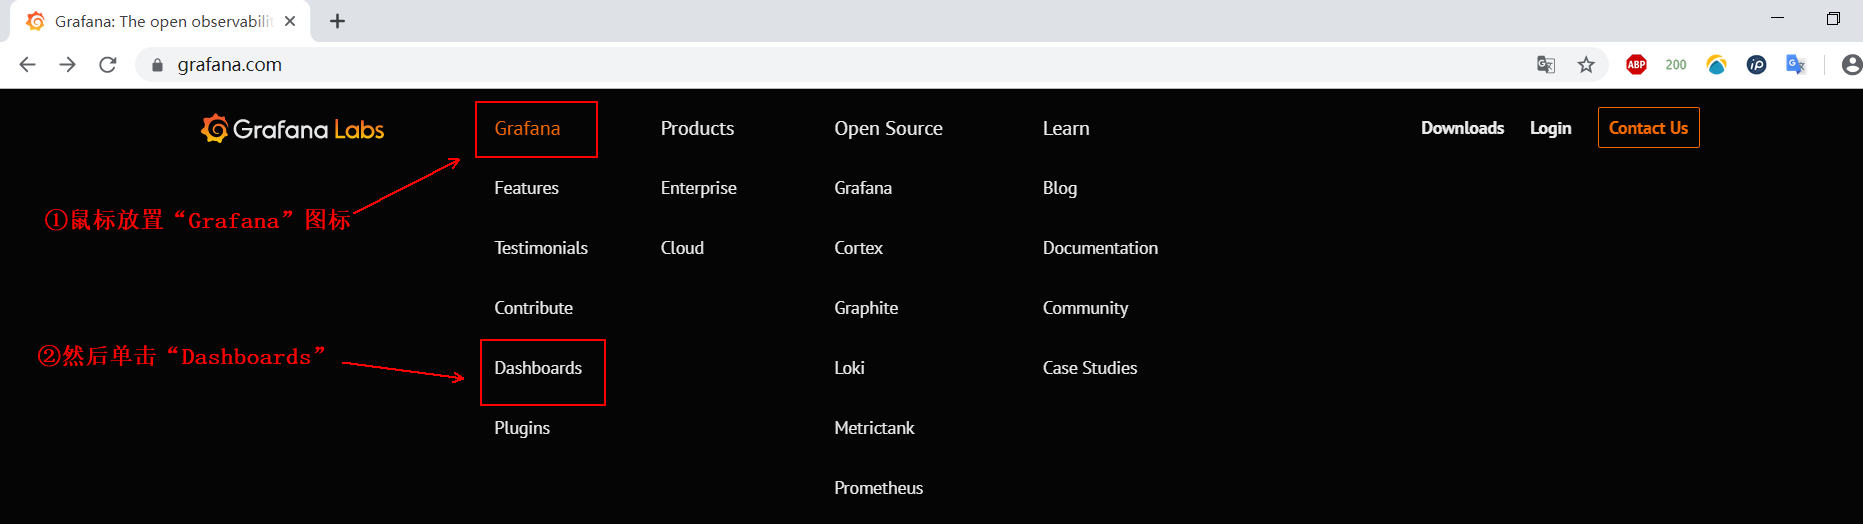
See the figure:

There are two ways to import these templates into our grafana web interface:
Mode 1:
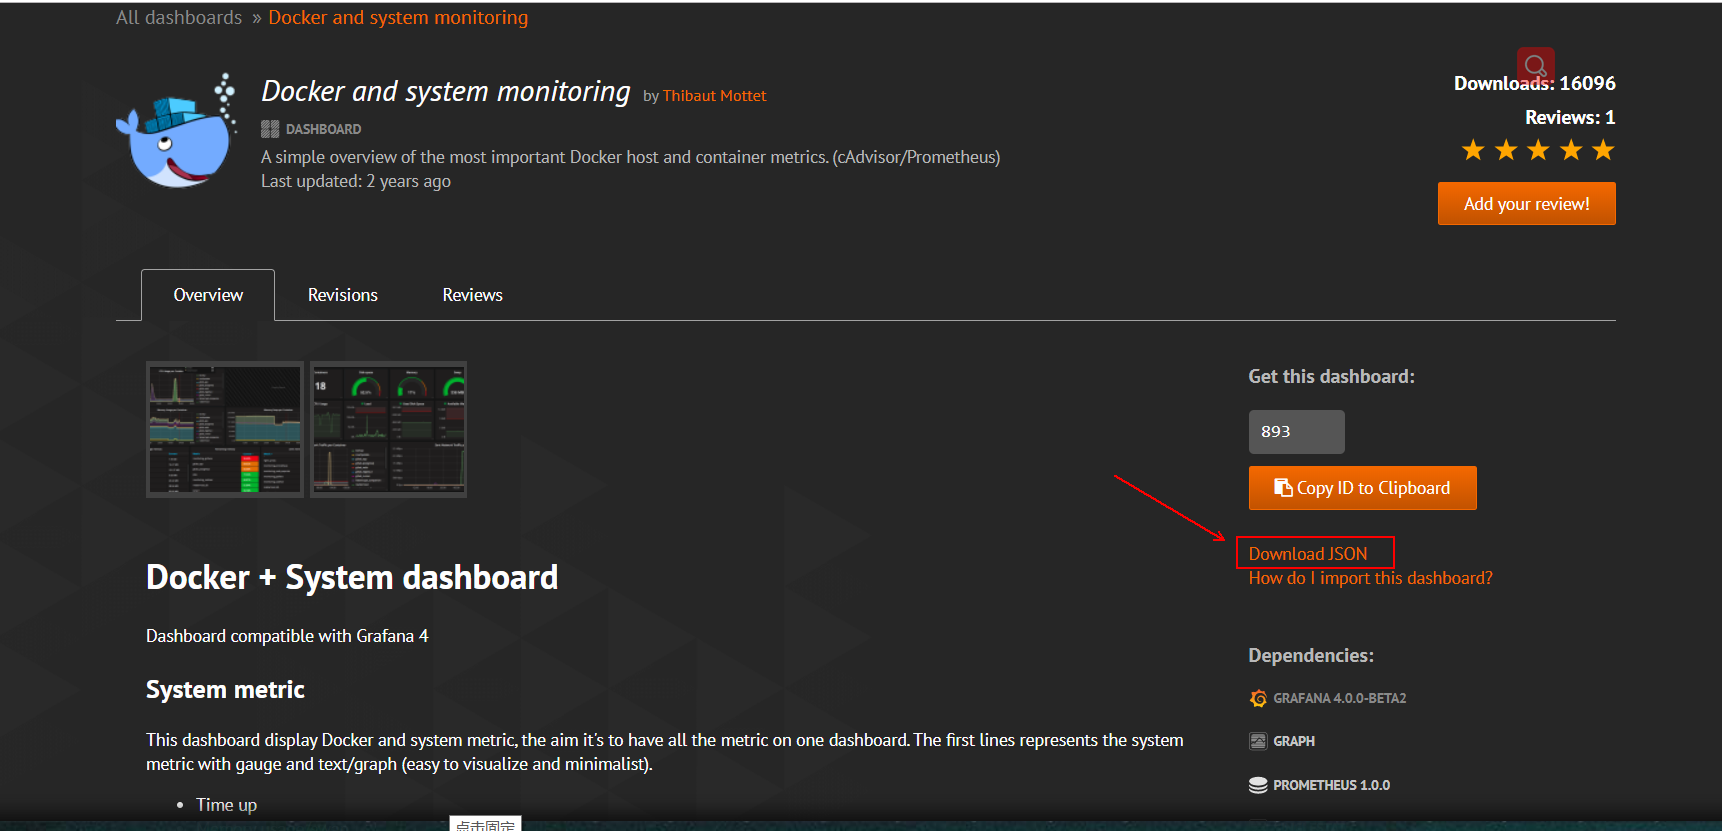
1) after entering the template, click "Download JSON" to download:
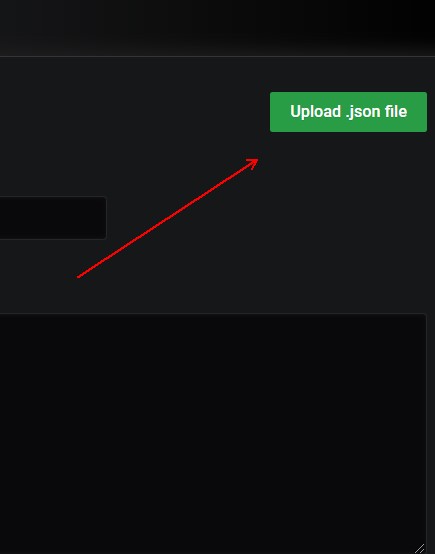
2) after downloading, return to the grafana interface and click as follows:

3) click "Upload.json file" and upload the template we downloaded on the grafana official website:
4) after uploading, please refer to the following figure for operation:
5) at this point, you can see the following monitoring page, indicating that the import is successful:

However, if you look at it carefully, you will find that some information of this template cannot be detected, so this is just to show the first way to import the template. I prefer to use mode 2 for import.
Mode 2
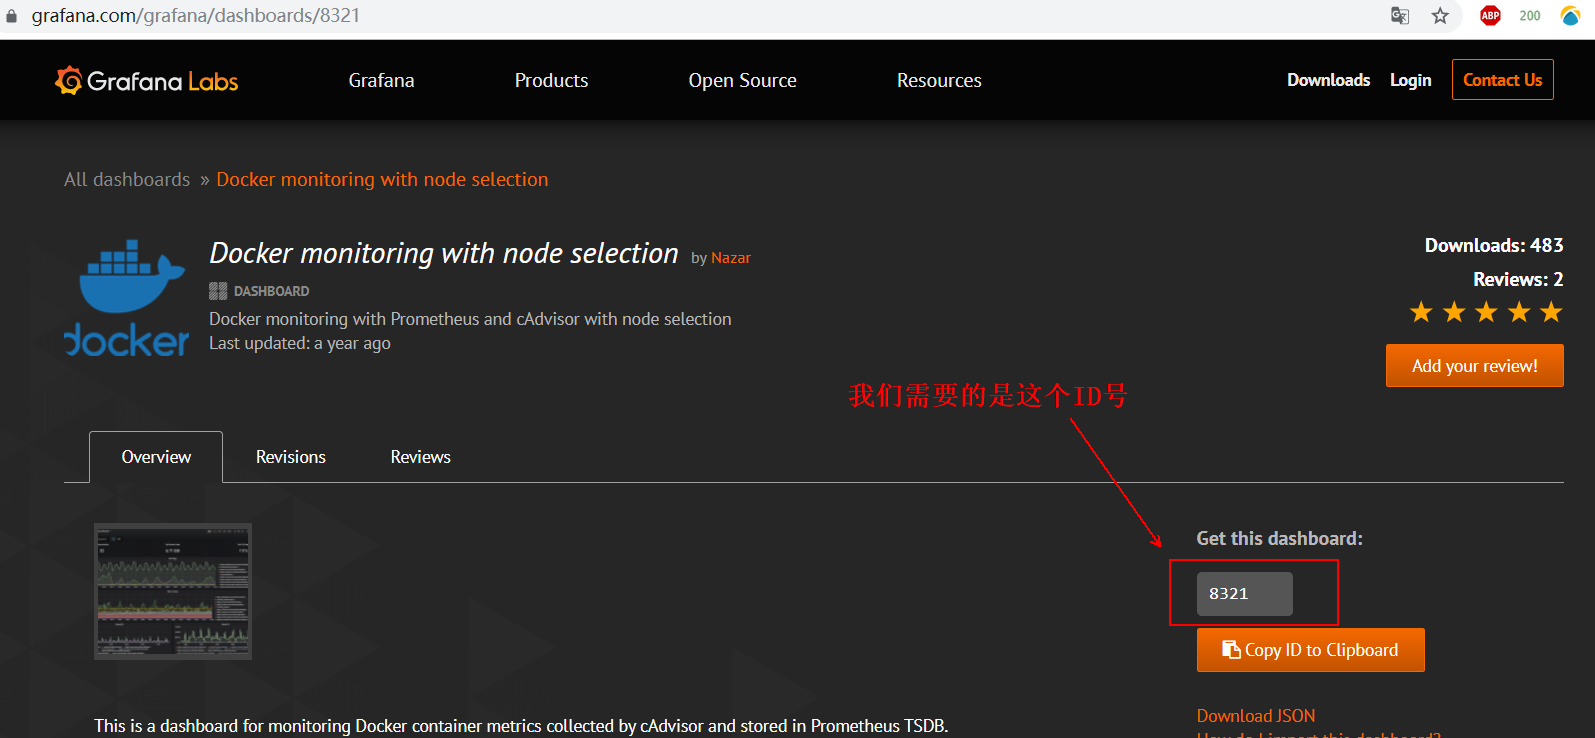
1) after entering the template provided on the official website, we need to record its ID number as follows:
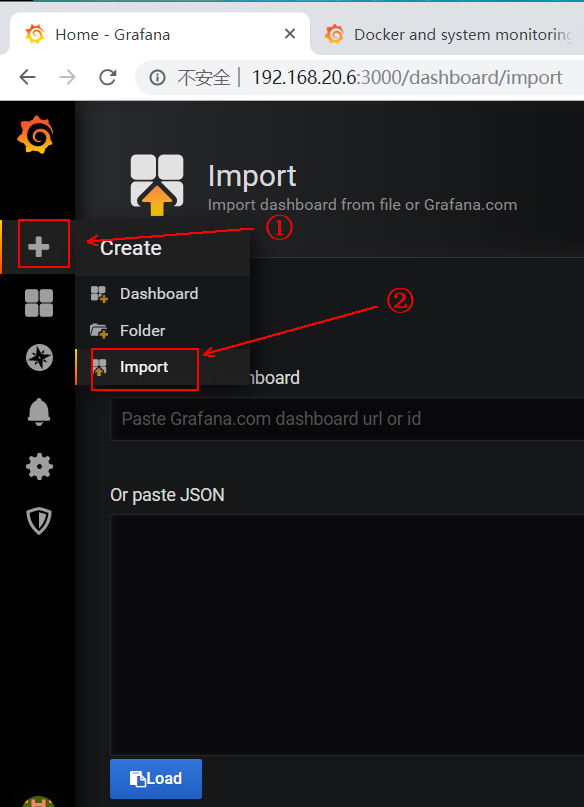
2) then return to the web interface of grafana, and click the following to import:
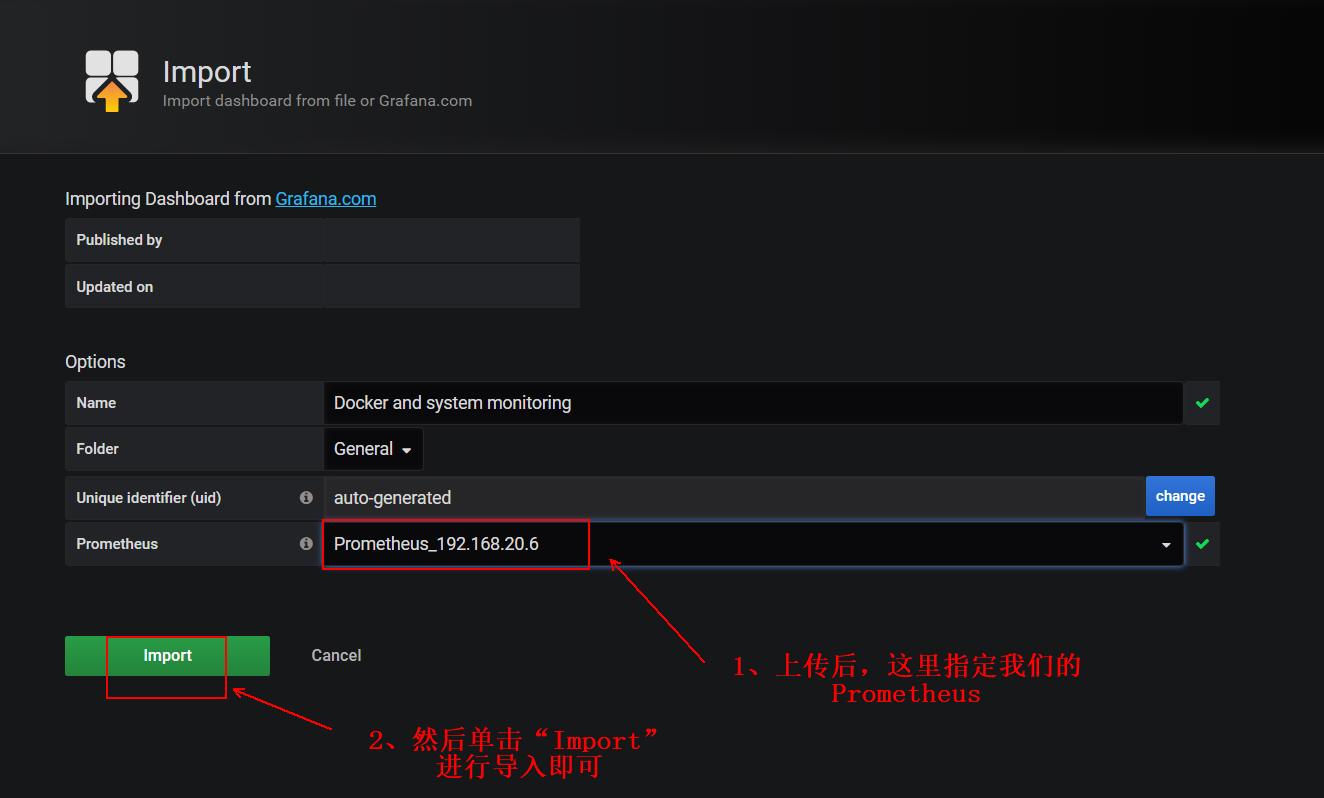
3) enter the ID number of our record in the following red box:
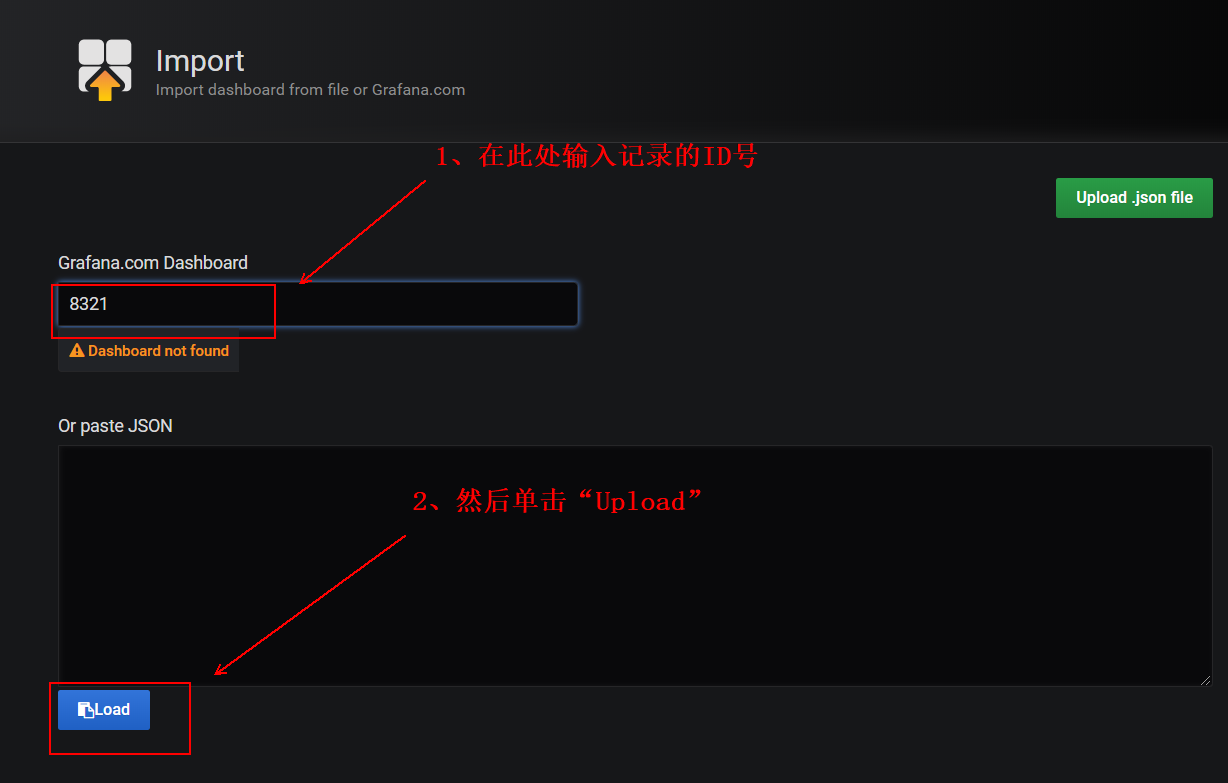
4) the following operations are the same as those in mode 1, as follows:
5) after importing the template, you will see the interface provided by the template, as follows:
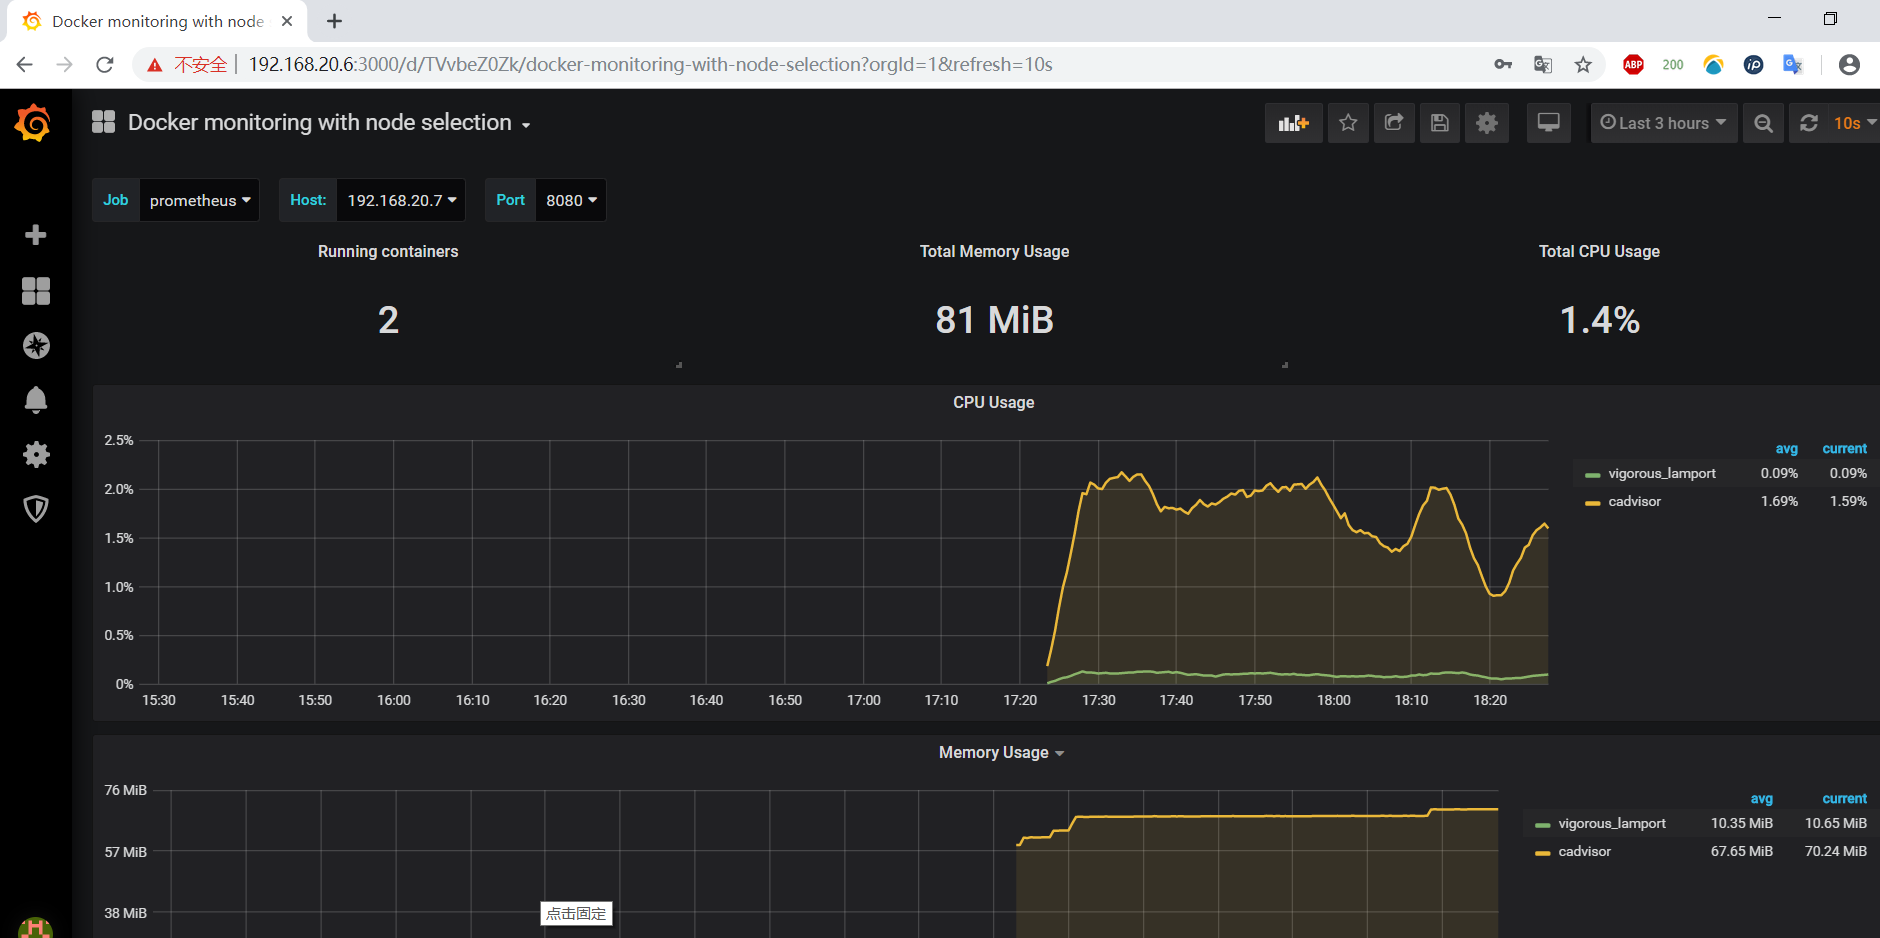
At this point, the monitoring of the web interface is deployed.
5. Set Prometheus alarm
There are several alarm modes of Prometheus, such as mailbox, pin, wechat, etc. I choose the alarm mode of mailbox here.
1) run the alertmanager container on the docker01 server
[root@docker01 ~]# docker run --name alertmanager -d -p 9093:9093 prom/alertmanager
#Simply run a container first
[root@docker01 ~]# docker cp alertmanager:/etc/alertmanager/alertmanager.yml /root
#Copy the configuration file from the container to the local
[root@docker01 ~]# docker rm -f alertmanager   #Delete containers that were run casually before
[root@docker01 ~]# vim alertmanager.yml    #Edit the copied configuration file
#Configuration files can be divided into the following groups:
#Global: global configuration. Set up alarm strategy, alarm channel, etc.
#route: distribution strategy;
#receivers: receiver, specify who will receive the information you send;
#inhibit_rules: suppression policy. When there is another set of matching alerts, the suppression rule will be disabled for one set of matching alerts.
The configuration file I changed here is as follows:
[root@docker01 ~]# vim alertmanager.yml    #Edit the copied configuration file
#Change all the following email accounts and auth ﹣ password to your own account.
global:
  resolve_timeout: 5m
  smtp_from: '916551516@qq.com'
  smtp_smarthost: 'smtp.qq.com:465'
  smtp_auth_username: '916551516@qq.com'
  smtp_auth_password: 'abdgwyaxickabccb'
  smtp_require_tls: false
  smtp_hello: 'qq.com'
route:
  group_by: ['alertname']
  group_wait: 5s
  group_interval: 5s
  repeat_interval: 5m
  receiver: 'email'
receivers:
- name: 'email'
  email_configs:
  - to: '916551516@qq.com'
    send_resolved: true                 #The purpose of this line is to send an email when the container returns to normal.
inhibit_rules:
  - source_match:
      severity: 'critical'
    target_match:
      severity: 'warning'
    equal: ['alertname', 'dev', 'instance']
#After the change is completed, save to exit
[root@docker01 ~]# docker run -d --name alertmanger -p 9093:9093 -v /root/alertmanager.yml:/etc/alertmanager/alertmanager.yml --restart=always prom/alertmanager
#Run the new alertmanager container and mount the changed configuration file
#If there is an error in the configuration file, the container cannot run.
2) set alertmanager alarm rules
[root@docker01 ~]# mkdir -p prometheus/rules
[root@docker01 ~]# cd prometheus/rules/
[root@docker01 rules]# vim node-up.rules     #The editing rules are as follows
groups:
- name: node-up     #Set the name of the alarm
  rules:
  - alert: node-up
    expr: up{job="prometheus"} == 0      #The job must be exactly the same as the job name in the Prometheus configuration file
    for: 15s
    labels:
      severity: 1           #First level warning
      team: node
    annotations:
      summary: "{{ $labels.instance }} Stopped running more than 15 s!
"
#After the definition is completed, save to exit.
If you want to write your own alarm rules, you can refer to its Official documents , I have some problems with the alarm rules here, but I can receive its alarm information.
3) related to Prometheus
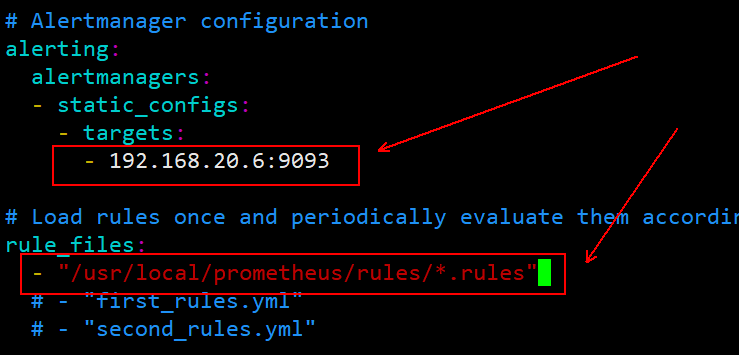
[root@docker01 ~]# vim prometheus.yml      #Change the following
alerting:
  alertmanagers:
  - static_configs:
    - targets:
      - 192.168.20.6:9093       #Remove the comment from this line and change it to the IP + port of the alertmanager container
rule_files:
  - "/usr/local/prometheus/rules/*.rules"   #Note that this path is within the container
#You must pay special attention to the format of the configuration file, and pay attention to indentation. After the change is completed, save to exit.
To prevent format errors, I attach a screenshot of the configuration file:
[root@docker01 ~]# docker rm -f prometheus    #Delete this container
[root@docker01 ~]# docker run -d -p 9090:9090 -v /root/prometheus.yml:/etc/prometheus/prometheus.yml -v /root/prometheus/rules:/usr/local/prometheus/rules --name prometheus --net=host prom/prometheus
#Rerun this container to mount new files
[root@docker01 ~]# docker logs prometheus     #If an error is encountered during startup, you can view the container's log taking error.
At this point, if the target in the Prometheus page has a down container, an alarm message will be sent to your mailbox. When the container is normal, it will give you feedback
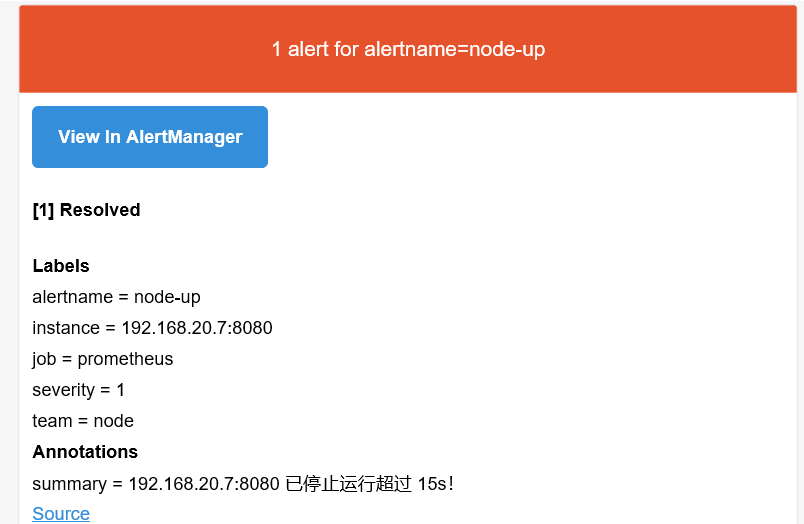
I received the following alarm email:
4) set alarm information template
[root@docker01 ~]# cd prometheus/
[root@docker01 prometheus]# mkdir alertmanager-tmpl
[root@docker01 prometheus]# cd alertmanager-tmpl/
[root@docker01 alertmanager-tmpl]# vim email.tmpl #Edit alarm template
{{ define "email.from" }}916551516@qq.com{{ end }} #Change this to your own mailbox
{{ define "email.to" }}916551516@qq.com{{ end }} #Change to your own mailbox
{{ define "email.to.html" }}
{{ range .Alerts }}
=========start==========<br>
//Alarm procedure: Prometheus < br >
//Alarm level: {. Labels.severity}} level < br >
//Alarm type: {. Labels. Alertname}} < br >
//Failed host: {. Labels. Instance}} < br >
//Warning subject: {. Annotations. Summary}} < br >
//Trigger time: {. Startsat. Format "2006-01-02 15:04:05"} < br >
=========end==========<br>
{{ end }}
{{ end }}
#Save and exit after changing your mailbox
[root@docker01 ~]# cd
[root@docker01 ~]# vim alertmanager.yml #Edit the alertmanager configuration file and modify the following commented lines.
global:
resolve_timeout: 5m
smtp_from: '916551516@qq.com'
smtp_smarthost: 'smtp.qq.com:465'
smtp_auth_username: '916551516@qq.com'
smtp_auth_password: 'abdgwyaxickabccb'
smtp_require_tls: false
smtp_hello: 'qq.com'
templates: #Add this trip
- '/etc/alertmanager-tmpl/*.tmpl' #Add this trip
route:
group_by: ['alertname']
group_wait: 5s
group_interval: 5s
repeat_interval: 5m
receiver: 'email'
receivers:
- name: 'email'
email_configs:
- to: '{{ template "email.to" }}' #Must correspond to {define "email. To"}} 916551516@qq.com {end}}}
html: '{{ template "email.to.html" . }}' #Must correspond to the name in {define "email.to.html"}}}
send_resolved: true
inhibit_rules:
- source_match:
severity: 'critical'
target_match:
severity: 'warning'
equal: ['alertname', 'dev', 'instance']
#After modification, save to exit
[root@docker01 ~]# docker rm -f alertmanger #Delete this container
[root@docker01 ~]# docker run -d --name alertmanger -p 9093:9093 -v /root/alertmanager.yml:/etc/alertmanager/alertmanager.yml -v /root/prometheus/alertmanager-tmpl:/etc/alertmanager-tmpl --restart=always prom/alertmanager
#Run a new container
[root@docker01 ~]# docker ps #Confirm that 9093 port operation mapping is normal
CONTAINER ID IMAGE COMMAND CREATED STATUS PORTS NAMES
f9d718071d4d prom/alertmanager "/bin/alertmanager -..." 7 seconds ago Up 6 seconds 0.0.0.0:9093->9093/tcp alertmanger
1b1379e3e12a prom/prometheus "/bin/prometheus --c..." 11 minutes ago Up 11 minutes prometheus
65240a28e383 grafana/grafana "/run.sh" 2 hours ago Up 2 hours 0.0.0.0:3000->3000/tcp grafana
3bd83eb145e2 google/cadvisor "/usr/bin/cadvisor -..." 2 hours ago Up 2 hours cadvisor
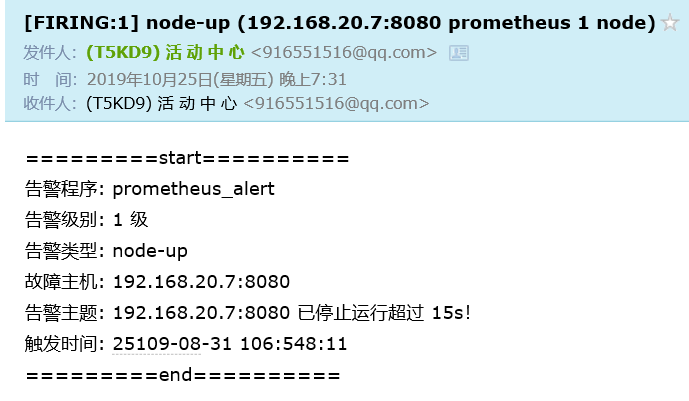
a57b77a33e79 prom/node-exporter "/bin/node_exporter ..." 2 hours ago Up 2 hours eloquent_wescoffAt this point, a new alarm template has also been generated. If the following containers have Down, they will send you a new email. After returning to normal, they will also send you an email. Similarly, the content format in the email is wrong, but you can receive the alarm information normally. If you want to change the alarm template, you can refer to Official documents of github
The alarm information received by my email is as follows:
————————Thank you for reading————————