Installation and Configuration of Dashboard and Heapster on the Main Node k8s 1.10.6 (II)
One: Configure the mirrors used by Kubeadm on all nodes
This is the top priority, because for domestic reasons, we can not access Google's image library, so we need to execute the following script to get the same image from the Docker Hub repository, and change TAG to make it consistent with Google's image pull.
Create a new Shell script and save it after filling in the following code.
mkdir  -p  /opt/sh  &&  cd  /opt/sh
cat  /opt/sh/auto_deploy_k8s.sh
#!/bin/bash
images=(coredns:1.1.3 pause-amd64:3.1 kubernetes-dashboard-amd64:v1.8.3 k8s-dns-sidecar-amd64:1.14.9 k8s-dns-kube-dns-amd64:1.14.9
k8s-dns-dnsmasq-nanny-amd64:1.14.9 heapster-influxdb-amd64:v1.3.3  heapster-amd64:v1.4.2   heapster-grafana-amd64:v4.4.3)


for imageName in ${images[@]} ; do
docker pull keveon/$imageName
docker tag keveon/$imageName k8s.gcr.io/$imageName
docker rmi keveon/$imageName
done
$chmod +x /opt/sh/auto_deploy_k8s.sh
$/opt/sh/auto_deploy_k8s.shII: Installation and Configuration of Kubernetes-Dashboard (WebUI) on the Main Node
1: Install dashboard
Like network plug-ins, dashboard is also a container application. First, download yaml:
cd     /opt/k8s/config
wget  https://raw.githubusercontent.com/kubernetes/dashboard/master/src/deploy/recommended/kubernetes-dashboard.yaml
To modify the document, at the end of the document, the following will be done:
#------------------- Dashboard Service ------------------- #

kind: Service
apiVersion: v1
metadata:
  labels:
    k8s-app: kubernetes-dashboard
  name: kubernetes-dashboard
  namespace: kube-system
spec:
  ports:
    - port: 443
      targetPort: 8443
  selector:
    k8s-app: kubernetes-dashboard
Revised to:
# ------------------- Dashboard Service ------------------- #

kind: Service
apiVersion: v1
metadata:
  labels:
    k8s-app: kubernetes-dashboard
  name: kubernetes-dashboard
  namespace: kube-system
spec:
  # Add Service type to NodePort
  type: NodePort
  ports:
    - port: 443
      targetPort: 8443
      # Adding ports mapped to virtual machines, k8s only supports ports over 30000
      nodePort: 30001
  selector:
    k8s-app: kubernetes-dashboard
Will:
image: k8s.gcr.io/kubernetes-dashboard-amd64:v1.10.0
Revised to:
image: k8s.gcr.io/kubernetes-dashboard-amd64:v1.8.3
If you have installed yaml files before, you need to delete them with the following commands:
$kubectl delete -f https://raw.githubusercontent.com/kubernetes/dashboard/master/src/deploy/recommended/kubernetes-dashboard.yaml
Then perform the installation of yaml
$kubectl create -f /opt/k8s/config/kubernetes-dashboard.yaml
After installation, execute:
$kubectl get pods --all-namespaces
NAMESPACE NAME READY STATUS RESTARTS AGE
kube-system coredns-7997f8864c-gnvd5 1/1 Running 0 1h
kube-system coredns-7997f8864c-svl7v 1/1 Running 0 1h
kube-system kube-apiserver-k8s-m1.trjcn.com 1/1 Running 0 1h
kube-system kube-apiserver-k8s-m2.trjcn.com 1/1 Running 0 1h
kube-system kube-apiserver-k8s-m3.trjcn.com 1/1 Running 0 1h
kube-system kube-controller-manager-k8s-m1.trjcn.com 1/1 Running 0 1h
kube-system kube-controller-manager-k8s-m2.trjcn.com 1/1 Running 0 1h
kube-system kube-controller-manager-k8s-m3.trjcn.com 1/1 Running 0 1h
kube-system kube-flannel-ds-f8647 1/1 Running 0 1h
kube-system kube-flannel-ds-k6scr 1/1 Running 0 49m
kube-system kube-flannel-ds-l8hwz 1/1 Running 1 1h
kube-system kube-flannel-ds-v5ht6 1/1 Running 0 1h
kube-system kube-proxy-78ht6 1/1 Running 0 1h
kube-system kube-proxy-7wsl7 1/1 Running 0 49m
kube-system kube-proxy-9xlds 1/1 Running 0 1h
kube-system kube-proxy-p5fp8 1/1 Running 0 1h
kube-system kube-scheduler-k8s-m1.trjcn.com 1/1 Running 0 1h
kube-system kube-scheduler-k8s-m2.trjcn.com 1/1 Running 0 1h
kube-system kube-scheduler-k8s-m3.trjcn.com 1/1 Running 0 1h
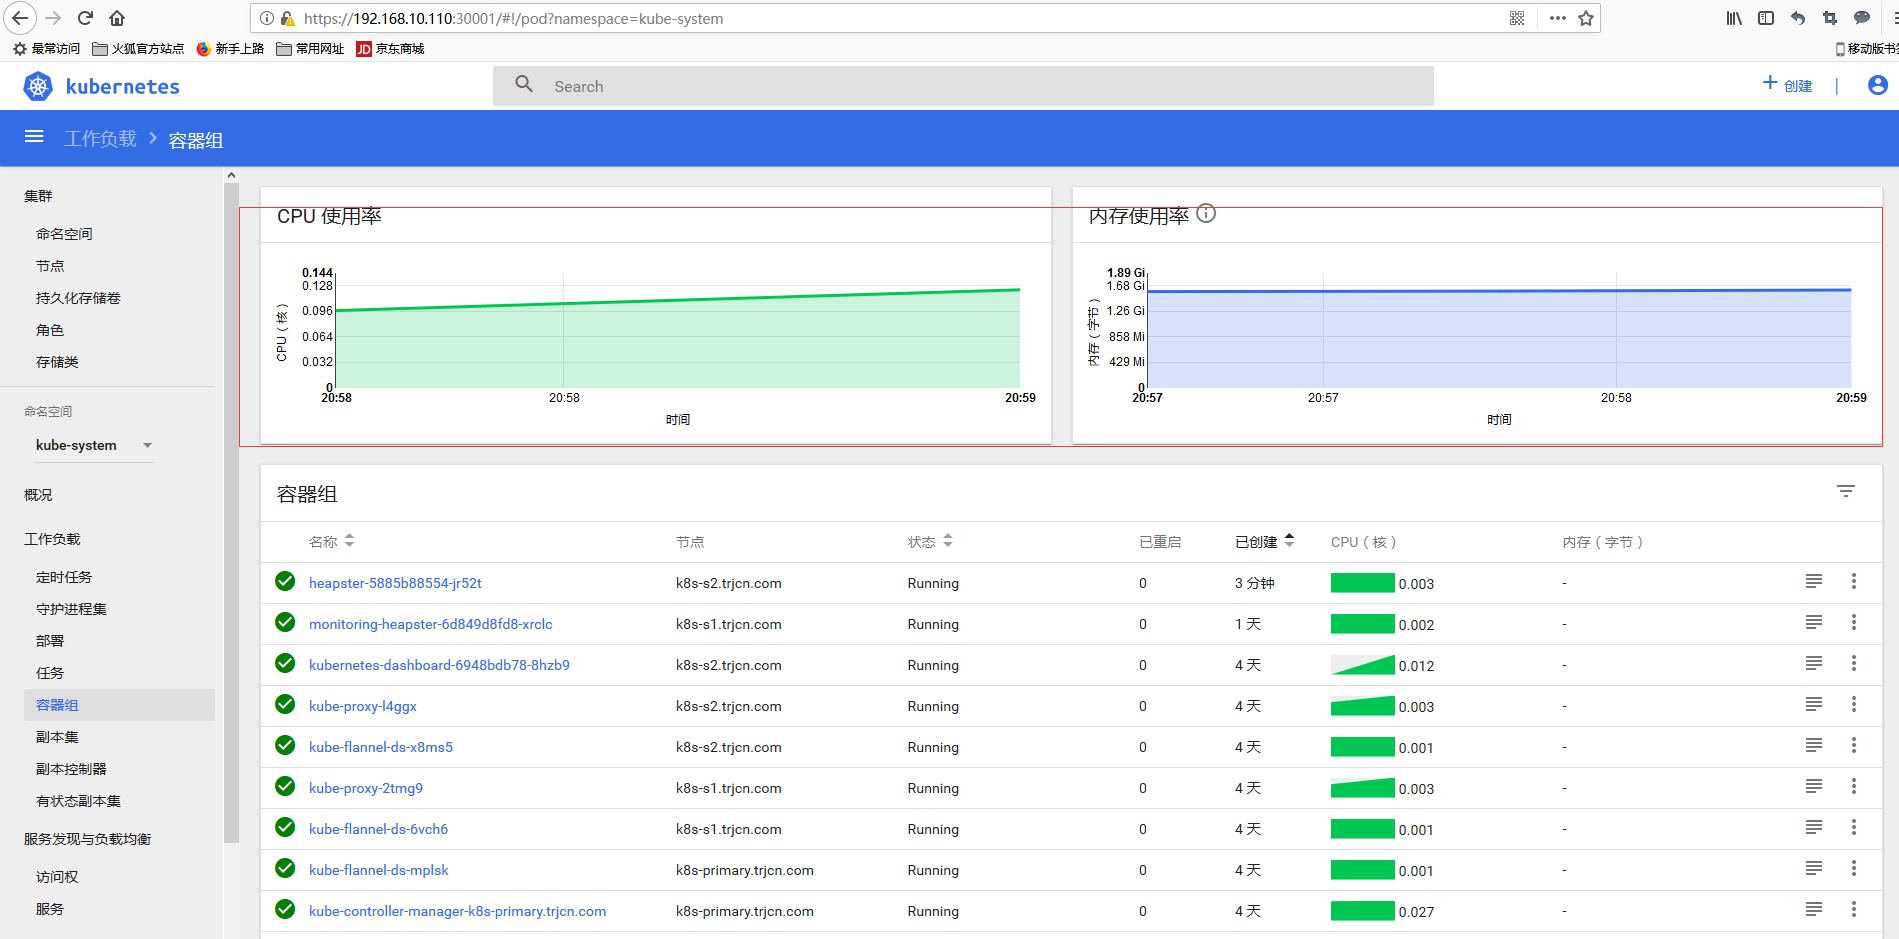
kube-system kubernetes-dashboard-7d5dcdb6d9-kvxhz 1/1 Running 0 27sOpen WebUI:
https://192.168.10.110:30001
See the following page:
2: Configure role permissions and empowerment and log on to WebUI
We create an admin user and grant admin role binding, create admin user with the following yaml file and grant him administrator privileges, then we can login dashbaord through token, which is essentially achieved through the authentication of Service Account and the request of API server by Bearer token.
mkdir -p  /opt/k8s/config
cat     /opt/k8s/config/user-admin.yaml

//The contents are as follows:

kind: ClusterRoleBinding
apiVersion: rbac.authorization.k8s.io/v1beta1
metadata:
  name: admin
  annotations:
    rbac.authorization.kubernetes.io/autoupdate: "true"
roleRef:
  kind: ClusterRole
  name: cluster-admin
  apiGroup: rbac.authorization.k8s.io
subjects:
- kind: ServiceAccount
  name: admin
  namespace: kube-system
---
apiVersion: v1
kind: ServiceAccount
metadata:
  name: admin
  namespace: kube-system
  labels:
    kubernetes.io/cluster-service: "true"
    addonmanager.kubernetes.io/mode: Reconcile
Execute the configuration file written above:
$kubectl create -f /opt/k8s/config/user-admin.yaml
After the above admin user is created, we can get the corresponding token of the user, as follows:
$kubectl get secret -n kube-system | grep admin
admin-token-jvwk5 kubernetes.io/service-account-token 3 26s
$kubectl describe secret admin-token-jvwk5 -n kube-system
//The output is as follows:
Name: admin-token-5bf9b
Namespace: kube-system
Labels: <none>
Annotations: kubernetes.io/service-account.name=admin
kubernetes.io/service-account.uid=da7fe0df-97a0-11e8-981f-000c2906f499
Type: kubernetes.io/service-account-token
Data
====
ca.crt: 1025 bytes
namespace: 11 bytes
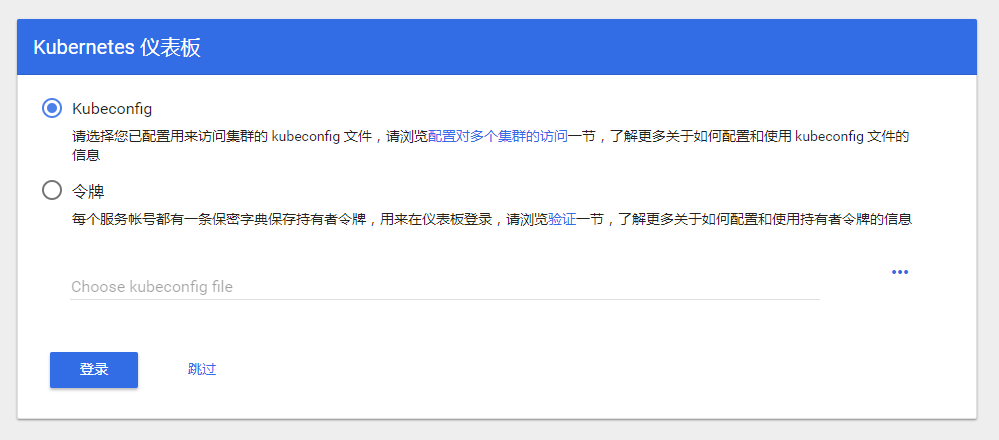
token: eyJhbGciOiJSUzI1NiIsImtpZCI6IiJ9.eyJpc3MiOiJrdWJlcm5ldGVzL3NlcnZpY2VhY2NvdW50Iiwia3ViZXJuZXRlcy5pby9zZXJ2aWNlYWNjb3VudC9uYW1lc3BhY2UiOiJrdWJlLXN5c3RlbSIsImt1YmVybmV0ZXMuaW8vc2VydmljZWFjY291bnQvc2VjcmV0Lm5hbWUiOiJhZG1pbi10b2tlbi1jd2o3NyIsImt1YmVybmV0ZXMuaW8vc2VydmljZWFjY291bnQvc2VydmljZS1hY2NvdW50Lm5hbWUiOiJhZG1pbiIsImt1YmVybmV0ZXMuaW8vc2VydmljZWFjY291bnQvc2VydmljZS1hY2NvdW50LnVpZCI6ImY5MDliNGI5LWIwYTktMTFlOC1iNDQ3LTAwMGMyOTA3OTg4NiIsInN1YiI6InN5c3RlbTpzZXJ2aWNlYWNjb3VudDprdWJlLXN5c3RlbTphZG1pbiJ9.T8kRnhiDtrKNnXklkwuBwg0DhtC2BRLMnGVuPh6lpsNulv-_-rwIQm7h9KSvG-ZulnluMhvZVp-py7_8H7uRZRmpiPM-yDkIYhGmyJJXWH88tq44ZNxAEjbkwbcxeOAD4i1Zbu0A-_8OwRUKKfPnHw0GvdS4VexkIGdIVNblRhVuhg3qOfhHiMEBQ59N9JZYK3yvkVNoNzBTVqGNK95s7a5kevsV_rYaV8T6QslWsGu0R89xzGBR73VBzUUESHwDElnVons3aPadRVD4d_JPuhKF8BCaFi68ZSAOeEG7jyahavcOTobGo7csHmDrflOKDOVonLss83Vr2a79R987DwThen in https://192.168.10.110:30001 Input the token generated by the user above on the interface to login; Attention!! firefox Firefox browser must be used to login here. google browser and IE can not jump after login.
III: Installation and configuration of monitoring component Heapster+influxdb+grafana
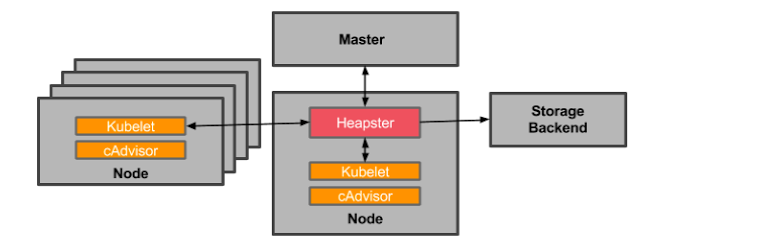
Heapster is a tool for monitoring cluster resources, such as computing, storage, network, etc. It collects cluster information using k8s built-in cAdvisor as data source, and aggregates valuable performance data (Metrics): cpu, memory, network, filesystem, etc. Then it outputs these data to external storage (backend), such as InfluxDB, and finally visualizes it through the corresponding UI interface, such as grafana. In addition, heapster's data source and external storage are pluggable, so many monitoring schemes can be flexibly constructed, such as Heapster + Elastic Search + Kibana and so on.
Heapster's overall architecture:
The software versions used in this test are as follows:
1: influxdb v1.3.3 rpm package installation
 2: Grafana v4.4.3 rpm package installation
 3: heapster docker image is installed using v1.5.0 version yaml file and docker image
3.1: Install and configure influxdb on the primary node
3.1.1: Install influxdb on the primary node
mkdir -p /opt/k8s/rpm && cd /opt/k8s/rpm
wget https://repos.influxdata.com/rhel/7Server/x86_64/stable/influxdb-1.3.3.x86_64.rpm
rpm -ivh influxdb-1.3.3.x86_64.rpm
3.1.2: Modify the configuration of InfluxDB, mainly configure the database and port number stored by jmeter, and need to open the UI port:
Vi/etc/influxdb/influxdb.conf Modify the following location:
#Setting the bound port
Bind address to use for the RPC service for backup and restore.
bind-address = "127.0.0.1:8088"
Find graphite and modify its libraries and ports
[[graphite]]
  # Determines whether the graphite endpoint is enabled.
  enabled = true
  database = "graphite"
  retention-policy = ""
  bind-address = ":2003"
  protocol = "tcp"
  consistency-level = "one"
Find http, remove the previous # and open its UI port
[http]
  # Determines whether HTTP endpoint is enabled.
  enabled = true

  # The bind address used by the HTTP service.
  bind-address = ":8086"

  # Determines whether HTTPS is enabled.
  https-enabled = false
3.1.3: Start influxdb
$systemctl enable influxdb && systemctl start influxdb
3.2: Install configuration grafana on the primary node
3.2.1: Install grafana on the primary node
cd /opt/k8s/rpm
yum -y install https://s3-us-west-2.amazonaws.com/grafana-releases/release/grafana-4.4.3-1.x86_64.rpm
systemctl enable grafana-server && systemctl start grafana-server
Browser opens, http://192.168.10.110:3000
Default admin/admin
3.3: Install and configure Heapster on the primary node
3.3.1: Download Heapster
docker pull daocloud.io/liukuan73/heapster-amd64:v1.5.2
3.3.2: Deployment and use
cd   /opt/k8s/config/
wget   https://raw.githubusercontent.com/liukuan73/kubernetes-addons/master/monitor/heapster%2Binfluxdb%2Bgrafana/heapster.yaml
Amend the document to read as follows:
apiVersion: v1
kind: ServiceAccount
metadata:
  name: heapster
  namespace: kube-system
---
apiVersion: extensions/v1beta1
kind: Deployment
metadata:
  name: heapster
  namespace: kube-system
spec:
  replicas: 1
  template:
    metadata:
      labels:
        task: monitoring
        k8s-app: heapster
    spec:
      serviceAccountName: heapster
      containers:
      - name: heapster
        image: daocloud.io/liukuan73/heapster-amd64:v1.5.2
        imagePullPolicy: IfNotPresent
        command:
        - /heapster
        - --source=kubernetes:https://192.168.10.115:6443?inClusterConfig=false&insecure=true&kubeletHttps=true&kubeletPort=10250
        #- --sink=influxdb:http://monitoring-influxdb.kube-system.svc:8086
        - --sink=influxdb:http://192.168.10.110:8086
---
apiVersion: v1
kind: Service
metadata:
  labels:
    task: monitoring
    # For use as a Cluster add-on (https://github.com/kubernetes/kubernetes/tree/master/cluster/addons)
    # If you are NOT using this as an addon, you should comment out this line.
    kubernetes.io/cluster-service: 'true'
    kubernetes.io/name: Heapster
  name: heapster
  namespace: kube-system
spec:
  ports:
  - port: 8082
    targetPort: 8082
  selector:
    k8s-app: heapster
Then apply these two files:
kubectl create -f /opt/k8s/config/heapster.yaml
Then perform the following commands for role binding:
kubectl create clusterrolebinding heapster-clusterrolebing --clusterrole=cluster-admin --user=system:anonymous --namespace=kube-systemImportant:
If this command is not executed, the following error will be reported in the log when the kubectl logs-f heapster-54b54dd8fb-d2p27-n kube-system command is executed:
E0905 11:57:02.694251       1 reflector.go:190] k8s.io/heapster/metrics/util/util.go:30: Failed to list *v1.Node: nodes is forbidden: User "system:anonymous" cannot list nodes at the cluster scope
E0905 11:57:02.694990       1 reflector.go:190] k8s.io/heapster/metrics/heapster.go:328: Failed to list *v1.Pod: pods is forbidden: User "system:anonymous" cannot list pods at the cluster scope
E0905 11:57:02.696373       1 reflector.go:190] k8s.io/heapster/metrics/util/util.go:30: Failed to list *v1.Node: nodes is forbidden: User "system:anonymous" cannot list nodes at the cluster scope
E0905 11:57:02.697472       1 reflector.go:190] k8s.io/heapster/metrics/util/util.go:30: Failed to list *v1.Node: nodes is forbidden: User "system:anonymous" cannot list nodes at the cluster scope
E0905 11:57:02.698596       1 reflector.go:190] k8s.io/heapster/metrics/processors/namespace_based_enricher.go:89: Failed to list *v1.Namespace: namespaces is forbidden: User "system:anonymous" cannot list namespaces at the cluster scope
3.3.3: Complete the effect display
3.3.3.1: View Cluster Information
$kubectl cluster-info
Kubernetes master is running at https://192.168.10.115:6443
Heapster is running at https://192.168.10.115:6443/api/v1/namespaces/kube-system/services/heapster/proxy
KubeDNS is running at https://192.168.10.115:6443/api/v1/namespaces/kube-system/services/kube-dns:dns/proxy
To further debug and diagnose cluster problems, use 'kubectl cluster-info dump'.
3.3.3.2: Access through NodePort
$kubectl  get  svc   -n  kube-system
NAME                   TYPE        CLUSTER-IP      EXTERNAL-IP   PORT(S)         AGE
heapster               ClusterIP   10.102.40.213   <none>        8082/TCP        42s
kube-dns               ClusterIP   10.96.0.10      <none>        53/UDP,53/TCP   1h
kubernetes-dashboard   NodePort    10.98.50.50     <none>        443:30001/TCP   34m
3.3.3.3: Container cpu and memory usage can be seen in dashboard's container group
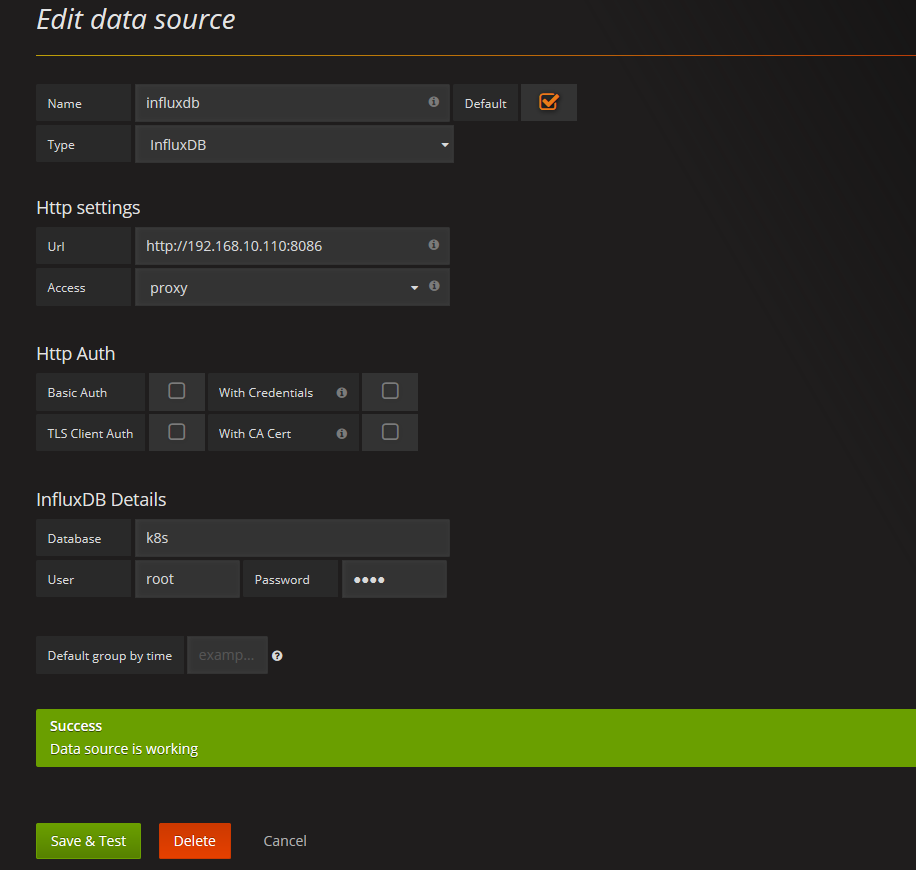
3.3.4: Graphics configuration
adopt http://192.168.10.110:3000 You can open grafana, select data sources in the upper left corner, and configure the data sources page as follows:
Then download the graphical template grafana needs:
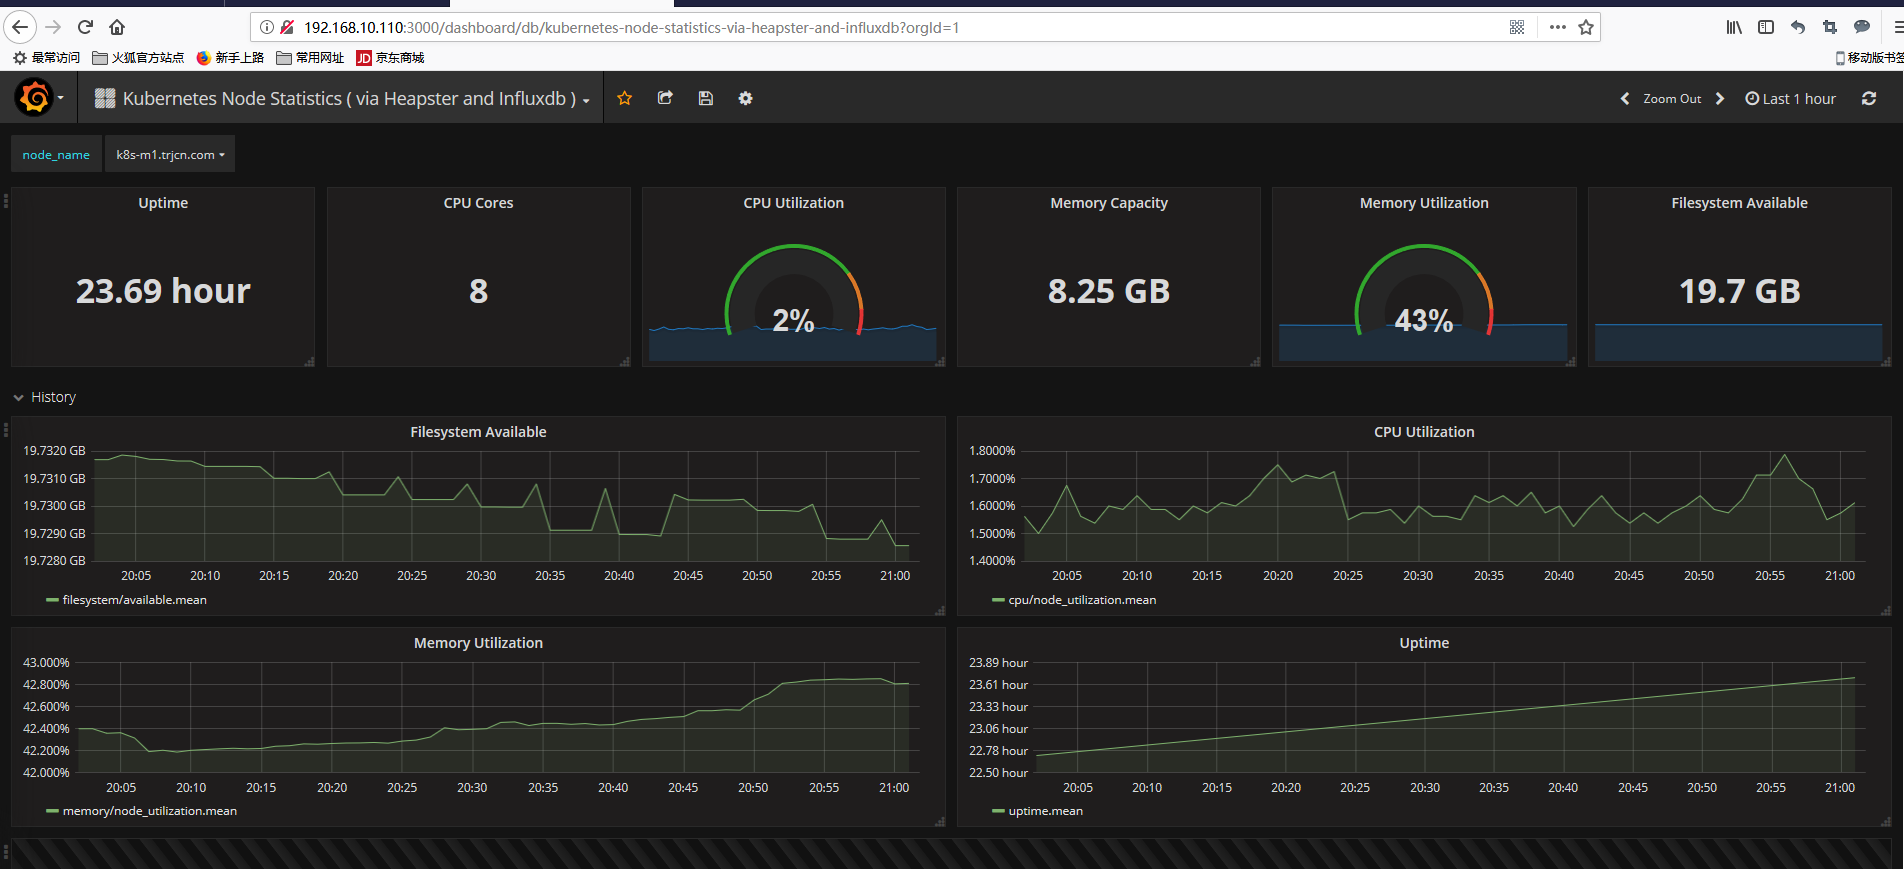
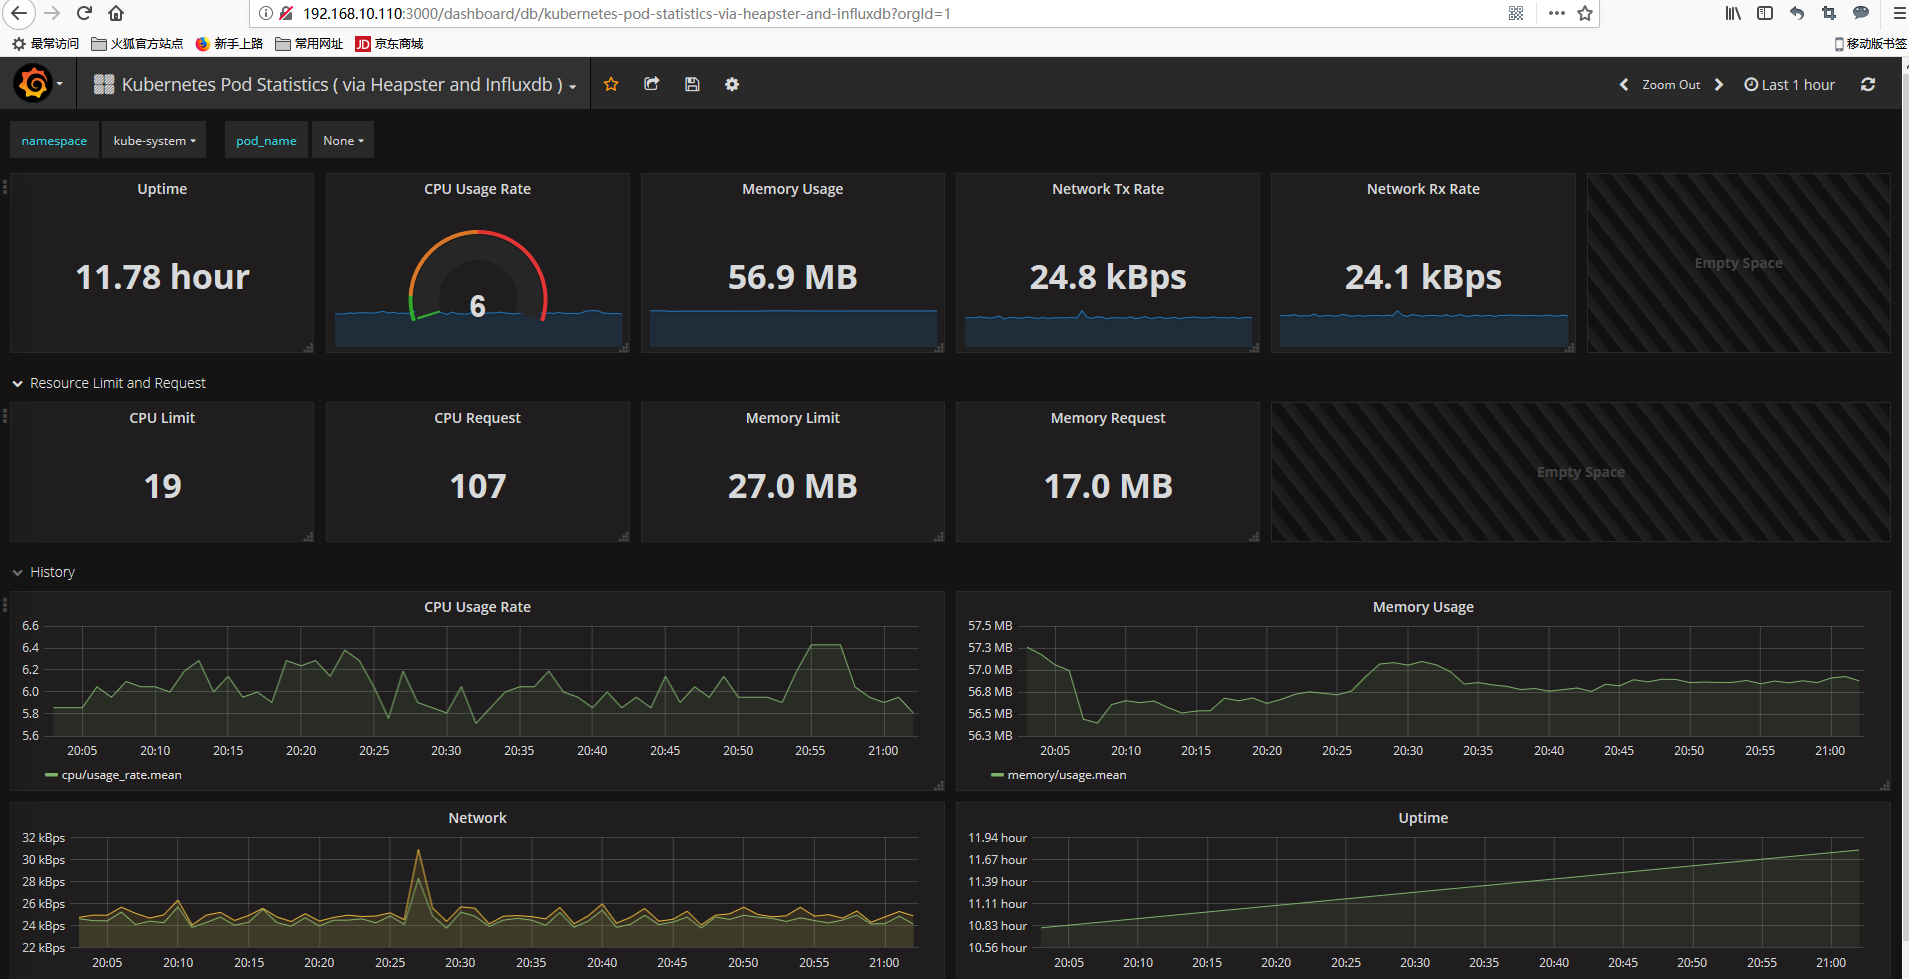
Node node monitoring template: https://grafana.com/dashboards/3649 ;
pod node monitoring template: https://grafana.com/dashboards/3646 ;
Then select the "DashBoard" - > "import" menu in the upper left corner of guafana's main interface and open the import dashboard interface as follows: 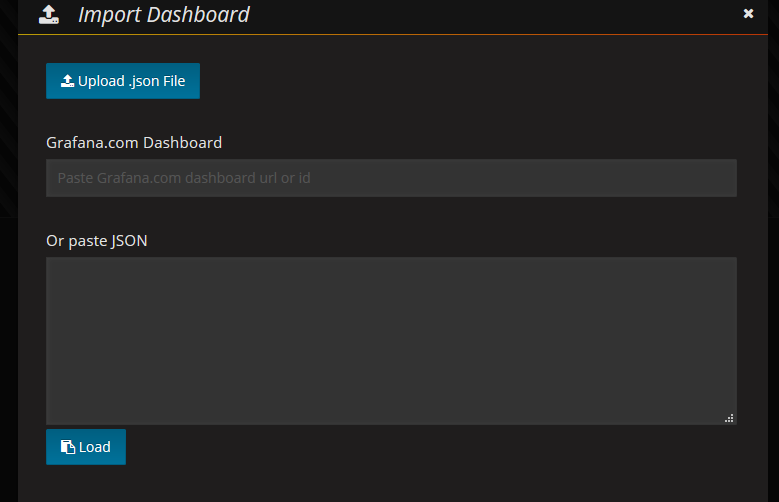
Then upload the downloaded template json file, and the result is as follows: