Source of the article: https://www.iteblog.com/archives/1956.html
There are tens of thousands of front-end and back-end equipments in the public security industry. Front-end equipments include cameras, detectors and sensors. Back-end equipments include servers, application servers, network equipments and power systems in central computer rooms at all levels. The huge number and variety of equipments bring great challenges to the internal operation and maintenance management of public security. The traditional way of diagnosing and analyzing equipment through ICMP/SNMP, Trap/Syslog and other tools can not meet the actual requirements. Because of the particularity of the internal operation and maintenance management of public security, the current way of using ELK and other structures can not meet the needs. In order to find a reasonable solution, we turn our attention to open source architecture and build a real-time operation and maintenance management platform for the public security industry.
Overall Architecture of Real-time Operations and Maintenance Platform
- Data acquisition layer: Logstash+Flume, responsible for collecting and filtering Snmp Trap, Syslog log information from various front and back hardware devices under different scenarios, and the system and business logs generated by the application server itself.
- Data transmission layer: High throughput distributed message queue Kafka cluster is adopted to ensure the reliable transmission of aggregated logs and messages.
- Data processing layer: Spark real-time Pull Kafka data, data stream processing and logical analysis through Spark Streaming and RDD operations;
- Data Storage Layer: Real-time data is stored in MySQL for real-time business application and display; full data is stored in ES and HBase for subsequent retrieval and analysis;
- Business Services Layer: Based on the Storage Layer, the follow-up business applications cover APM, network monitoring, topology, alarm, work order, CMDB and so on.
The main open source frameworks involved in the overall system are as follows:

In addition, the overall environment is based on JDK 8 and Scala 2.10.4. There are many kinds of equipment in the public security system. Next, taking the Syslog log of the switch as an example, the whole process of log processing and analysis is introduced in detail.
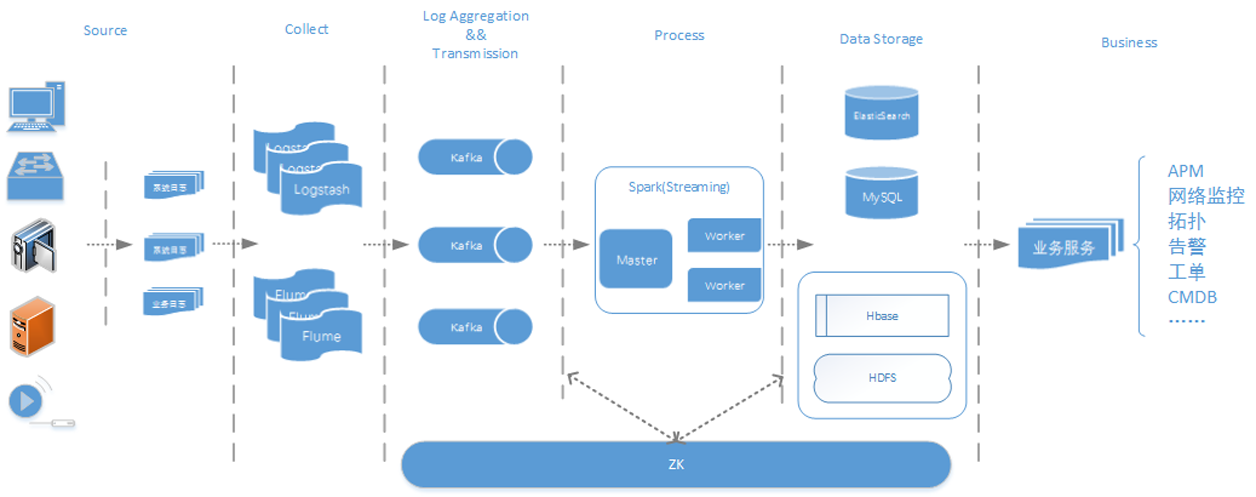
Fig. 1 The overall framework of real-time operation and maintenance platform for public security
Flume+Logstash Log Collection
Flume is a distributed, reliable and highly available mass log acquisition system contributed by Cloudera. It supports customization of various Source s for data collection. It also provides simple data processing and the ability to write Sink (data receiver) through cache.
In Flume, Source, Channel and Sink are configured as follows:
# Name the source, channel, and sink of the Flume Agent
a1.sources = r1
a1.sinks = k1
a1.channels = c1

# Configuring Syslog Sources
a1.sources.r1.type = syslogtcp
a1.sources.r1.port = 5140
a1.sources.r1.host = localhost

# Relevant configuration of Kafka Sink
a1.sinks.k1.type = org.apache.flume.sink.kafka.KafkaSink
a1.sinks.k1.topic = syslog-kafka
a1.sinks.k1.brokerList = gtcluster-slave01:9092
a1.sinks.k1.requiredAcks = 1
a1.sinks.k1.batchSize = 20
a1.sinks.k1.channel = c1

# Channel uses memory as a cache
a1.channels.c1.type = memory
a1.channels.c1.capacity = 1000
a1.channels.c1.transactionCapacity = 100

# Binding Source and Sink to Channel
a1.sources.r1.channels = c1
a1.sinks.k1.channel = c1
This configuration receives Syslog information sent by network devices through syslog source configuring localhost tcp 5140 port. Evet is cached in memory and sent to topic named "syslog-kafka" in Kafka cluster through KafkaSink.
Logstash, from Elastic, is designed to collect, analyze and transmit various types of logs, events and unstructured data. It has three main functions: event input (Input), event filter (Filter) and event output (Output), which are set in the configuration file suffixed with. conf. In this case, Syslog is configured as follows:
# syslog.conf
input {
    Syslog {
        port => "514"
    }
}
filter {
}
output {
    kafka {
        bootstrap_servers => "192.168.8.65:9092"
        topic_id => "syslog-kafka"
        compression_type => "snappy"
        codec => plain {
           format => "%{host} %{@timestamp} %{message}"
        }
    }
}
Input plug-in is used to specify various data sources. Logstash in this example receives Syslog information through udp 514 port.
Although the Filter plug-in does not need to be configured in this example, it has powerful functions and can perform complex logic processing, including regular expression processing, encoding and decoding, k/v segmentation and various data processing such as numerical value, time, etc. It can be set according to the actual scene.
Output plug-in is used to send processed event data to a specified destination, specifying the location of Kafka, topic, and compression type. In the final Codec coding plug-in, the IP address (host) of the source host and the time stamp (@timestamp) processed by Logstash are specified as prefixes and the original event message is integrated to facilitate the judgment of Syslog information sources during event transmission. A single original Syslog information flow sample is as follows:
147>12164: Oct 9 18:04:10.735: %LINK-3-UPDOWN: Interface GigabitEthernet0/16, changed state to downThe information processed by the Logstash Output plug-in becomes:
19.1.1.12 2016-10-13T10:04:54.520Z <147>12164: Oct 9 18:04:10.735: %LINK-3-UPDOWN: Interface GigabitEthernet0/16, changed state to downThe red field is the host and timestamp information embedded in the codec encoding plug-in. The processed Syslog information is sent to the Kafka cluster for message caching.
Kafka log buffer
Kafka is a high throughput distributed message queue and a subscription/publishing system. Each node in the Kafka cluster has an instance called broker, which is responsible for caching data. Kafka has two types of clients, Producer and Constumer. Messages from different business systems in Kafka can be distinguished by topic. Each message is partitioned to share the load of message reading and writing. Each partition can have multiple copies to prevent data loss. When consumers consume a topic message, they specify the initial offset. Kafka ensures real-time, efficient, reliable and fault-tolerant message transmission through Zero-Copy, Exactly One and other technical semantics.
The configuration file server.properties of a broker in the Kafka cluster is partially configured as follows:
########## Server Basics ###########
# Set a separate number for each broker as id
broker.id=1

###### Socket Server Settings ######
# socket listening port
port=9092

########### Zookeeper ##############
# Connection configuration of Zookeeper
zookeeper.connect=gtcluster-slave02:2181,gtcluster-slave03:2181,gtcluster-slave04:2181

# Timeout in ms for connecting to zookeeper
zookeeper.connection.timeout.ms=3000
It needs to specify the id of different brokers in the cluster. The id of this broker is 1, default monitoring port 9092, then configure Zookeeper (hereinafter referred to as zk) cluster, and then start broker.
The topic of the Kafka cluster named syslog-kafka:
bin/kafka-topics.sh
--create
--zookeeper gtcluster-slave02:2181,gtcluster-slave03:2181,gtcluster-slave04:2181
--replication-factor 3 --partitions 3
--topic syslog-kafka
Information such as topic and partition of Kafka cluster can also be observed by login zk. The following commands are then used to view all switch log information received by Kafka:
bin/kafka-console-consumer.sh--zookeeper gtcluster-slave02:2181--from-beginning
--topic Syslog-kafka
Some log samples are as follows:
10.1.1.10 2016-10-18T05:23:04.015Z <163>5585: Oct 18 13:22:45: %LINK-3-UPDOWN: Interface FastEthernet0/9, changed state to down
19.1.1.113 2016-10-18T05:24:04.425Z <149>10857: Oct 18 13:25:23.019 cmt: %LINEPROTO-5-UPDOWN: Line protocol on Interface GigabitEthernet1/0/3, changed state to down
19.1.1.113 2016-10-18T05:24:08.312Z <149>10860: Oct 18 13:25:27.935 cmt: %LINEPROTO-5-UPDOWN: Line protocol on Interface GigabitEthernet1/0/3, changed state to up
Spark Log Processing Logic
Spark is a fast and versatile engine for large-scale data processing. It has excellent performance in speed, efficiency and versatility.
In the main program of Spark, all Syslog information in topic named "syslog-kafka" in Kafka Source is parsed by Scala's regular expression, and the parsed valid fields are encapsulated as result objects. Finally, MyBatis is written into MySQL in near real time for real-time visualization display of front-end applications. In addition, full data storage into HBase and ES provides support for subsequent massive log retrieval analysis and other more advanced applications. The sample code of the main program is as follows:
object SwSyslogProcessor {
    def main(args: Array[String]): Unit = {
        // Initialize SparkContext, batch interval 5 seconds
        val sparkConf: SparkConf = new SparkConf().setAppName("SwSyslogProcessorApp ")
            .set("spark.serializer", "org.apache.spark.serializer.KryoSerializer")
        val ssc = new StreamingContext(sparkConf, Seconds(5))
        // Define topic
        val topic = Set("syslog-kafka")
        // Define the broker list address of kafka
        val brokers = "192.168.8.65:9092,192.168.8.66:9092,192.168.8.67:9092"
        val kafkaParams = Map[String, String]("metadata.broker.list" -> brokers, "serializer.class" -> "kafka.serializer.StringDecoder")
        // Create data streams from kafka through topic and brokers
        val swSyslogDstream = KafkaUtils.createDirectStream[String, String, StringDecoder, StringDecoder](
            ssc, kafkaParams, topic)
        val totalcounts = ssc.sparkContext.accumulator(0L, "Total count")
        val lines = swSyslogDstream.map(x => x._2)
        // Mapping row by row data into SwSyslog objects
        lines.filter(x => !x.isEmpty
            && x.contains("%LIN")
&& x.contains("Ethernet")
            .map(
                x => {
                    SwSyslogService.encapsulateSwSyslog(x) // Encapsulate and return SwSyslog
                }).foreachRDD((s: RDD[SwSyslog], time: Time) => {
            // Traversing RDD in DStream
            if (!s.isEmpty()) {
                // Traversing partition records in RDD
                s.foreachPartition {
                    records => {
                        if (!records.isEmpty) records.toSet.foreach {
                            r: SwSyslog => // Statistics the total number of records currently processed
                                totalcounts.add(1L) // Save SwSyslog information to MySQL
                                SwSyslogService.saveSwSyslog(r)
                        }
                    }
                }
            }
        }
        )

        //Startup program
        ssc.start()
        // Blocking wait
        ssc.awaitTermination()
 }
The overall processing analysis is divided into four steps:
- Initialize SparkContext and specify the parameters of Application.
- Create DirectStream based on Kafka topic "syslog-kafka";
- Mapping each row of data to Syslog object, calling Service to encapsulate and return the object;
- Traversing through RDD, records are not saved for space-time or updated Syslog information into MySQL.
Some of the basic attributes of Syslog POJO are as follows:
@Table(name = "sw_syslog")
public class SwSyslog {
    /**
     * Log ID
     */
    @Id
    @GeneratedValue(strategy = GenerationType.IDENTITY)
    private Long id;

    /**
     * Device IP
     */
    @Column(name = "dev_ip")
    private String devIp;

    /**
     * Server time
     */
    @Column(name = "server_time")
    private String serverTime;

    /**
     * thread of the message
     */
    @Column(name = "syslog_num")
    private Long syslogNum;

    ……
}
The basic attributes in SwSyslog entity correspond to the interface information in Syslog, the name in the annotation corresponds to the table sw_syslog in MySQL and each field, and MyBatis completes the ORM (Object Relational Mapping) of member attributes and database structure.
The SwSyslogService in the program has two main functions:
public static SwSyslog encapsulateSwSyslog(String syslogInfo) {
    SwSyslog swsyslog = new SwSyslog();
    swsyslog.setDevIp(SwSyslogExtractorUtil.extractDevIp(syslogInfo));
    swsyslog.setServerTime(SwSyslogExtractorUtil.extractServerTime(syslogInfo));
    swsyslog.setSyslogNum(SwSyslogExtractorUtil.extractSyslogNum(syslogInfo));
    swsyslog.setDevTime(SwSyslogExtractorUtil.extractDevTime(syslogInfo));
    swsyslog.setSyslogType(SwSyslogExtractorUtil.extractSyslogType(syslogInfo));
    swsyslog.setInfoType(SwSyslogExtractorUtil.extractInfoType(syslogInfo));
    swsyslog.setDevInterface(SwSyslogExtractorUtil
                                .extractDevInterface(syslogInfo));
    swsyslog.setInterfaceState(SwSyslogExtractorUtil
                                .extractInterfaceState(syslogInfo));
    return swsyslog;
}

public static void saveSwSyslog(SwSyslog swSyslog) {
    LOGGER.debug("Start saving or updating SwSyslog", swSyslog);
    // Query all Syslog s based on ip
    List<swsyslog> list = swSyslogMapper.queryAllByIp(swSyslog.getDevIp());
    //  If the list is not empty, the corresponding IP SwSyslog is found.
    if (list != null && !list.isEmpty()) {
        for (SwSyslog sys : list) {
            // If the IP interface is the same, update the information
            if (sys.getDevInterface().equals(swSyslog.getDevInterface())) {
                LOGGER.debug("Have the same IP Records of the same interface, start updating SwSyslog");
                sys.setServerTime(swSyslog.getServerTime());
                sys.setSyslogNum(swSyslog.getSyslogNum());
                sys.setDevTime(swSyslog.getDevTime());
                sys.setSyslogType(swSyslog.getSyslogType());
                sys.setInfoType(swSyslog.getInfoType());
                sys.setInterfaceState(swSyslog.getInterfaceState());
                sys.setUpdated(new Date());
                swSyslogMapper.update(sys);
            } else {
                // If the interface is different, save it directly
                LOGGER.debug("identical IP No corresponding interface, save SwSyslog");
                swSyslog.setCreated(new Date());
                swSyslog.setUpdated(swSyslog.getCreated());
                swSyslogMapper.insert(swSyslog);
            }
        }
    } else {
        // No corresponding IP record, save information directly
        LOGGER.debug("Not the same IP Record, direct preservation SwSyslog");
        swSyslog.setCreated(new Date());
        swSyslog.setUpdated(swSyslog.getCreated());
        swSyslogMapper.insert(swSyslog);
    }
}</swsyslog>
EnencapsulateSwSyslog () parses each line of Syslog processed by Spark into different fields through Scala's regular expression, and then encapsulates and returns Syslog objects. Every Syslog object generated by traversing RDD partitions has ip and interface information, and saveSwSyslog() determines whether to insert or update Syslog information into the database. In addition, the encapsulated Syslog objects interoperate with MySQL through the ORM tool MyBatis.
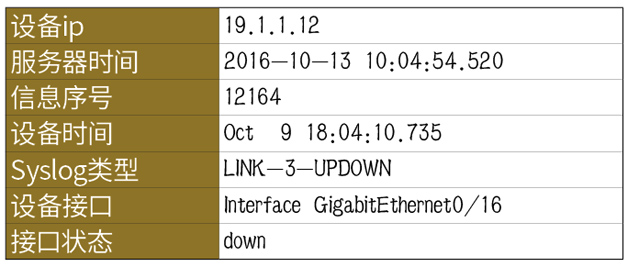
Each line of Syslog information obtained is as described earlier:
19.1.1.12 2016-10-13T10:04:54.520Z <147>12164: Oct 9 18:04:10.735: %LINK-3-UPDOWN: Interface GigabitEthernet0/16, changed state to downThis information needs to be resolved into device ip, server time, information serial number, device time, Syslog type, attribute, device interface, interface status and other fields. Scala's regular parsing logic is as follows:
/**
      * Extract server time
      * Example: 2016-10-09T10:04:54.517Z
      * @param line
      * @return
      */
    def extractServerTime(line: String): String = {
        val regex1 = "20\\d{2}-\\d{2}-\\d{2}".r
        val regex2 = "\\d{2}:\\d{2}:\\d{2}.?(\\d{3})?".r
        val matchedDate = regex1.findFirstIn(line)
        val matchedTime = regex2.findFirstIn(line)
        val result1 = matchedDate match {
            case Some(date) => date
            case None => " "
        }
        val result2 = matchedTime match {
            case Some(time) => time
            case None => " "
        }
        result1 + " " + result2
}

/**
      * Extraction equipment time
      * Example: Sep 2909:33:06
      *       Oct  9 18:04:09.733
      * @param line
      * @return
      */
    def extractDevTime(line: String): String = {
        val regex = "[a-zA-Z]{3}\\s+\\d+\\s\\d{2}:\\d{2}:\\d{2}((.\\d{3})|())".r
        val matchedDevTime = regex.findFirstIn(line)
        val result = matchedDevTime match {
            case Some(devTime) => devTime
            case None => " "
        }
        result
    }
Through regular filtering, Syslog encapsulation and MyBatis persistence layer mapping, Syslog interface status information is finally resolved as follows:
Finally, business applications such as APM, network monitoring or alarm can be visualized based on MySQL.
summary
Firstly, this paper briefly introduces the current situation of the operation and maintenance management of public security, then introduces the overall structure of the real-time operation and maintenance platform of public security. Then, taking the exchange Syslog information as an example, it introduces in detail how to use Flume+Logstash+Kafka+Spark Streaming for real-time log processing and analysis, describes a large number of technical details in the process of processing, and introduces the overall processing steps in detail through the code. The example in this paper has some performance bottlenecks in writing data to MySQL in real time. Later, the relevant code containing this example will be reconstructed, and the data will be written to HBase in real time to improve performance.