This blog post needs to be based on the basic environment of zabbix. Please refer to Build zabbix
1, Configure zabbix to monitor redis
(1) Deploy zabbix agent
Please refer to the blog for details of agent deployment and software package download Configure email alarm and wechat alarm monitored by Zabbix There is no detailed explanation here!
[root@agent ~]# tar zxf zabbix-3.2.1.tar.gz  && cd zabbix-3.2.1/
[root@agent zabbix-3.2.1]#   ./configure --prefix=/usr/local/zabbix --enable-agent && make && make install
[root@agent zabbix-3.2.1]#  useradd zabbix
[root@agent zabbix-3.2.1]#  cp /root/zabbix-3.2.1/misc/init.d/fedora/core/zabbix_agentd /etc/init.d/
[root@agent zabbix-3.2.1]# sed -i "s#BASEDIR=/usr/local#BASEDIR=/usr/local/zabbix#g" /etc/init.d/zabbix_agentd
[root@agent zabbix-3.2.1]#  chmod +x /etc/init.d/zabbix_agentd
[root@agent zabbix-3.2.1]#  cd /usr/local/zabbix/etc/
[root@agent etc]# sed -i '/PidFile=/s/^#//'  zabbix_agentd.conf
[root@agent etc]#  sed -i 's/Server=127.0.0.1/Server=192.168.1.10/g' zabbix_agentd.conf
[root@agent etc]#  sed -i '/ListenPort=/s/^#//'  zabbix_agentd.conf
[root@agent etc]#  sed -i 's/ServerActive=127.0.0.1/ServerActive=192.168.1.10/g' zabbix_agentd.conf
[root@agent etc]#  sed -i 's/Hostname=Zabbix server/Hostname=192.168.1.8/g' zabbix_agentd.conf
[root@agent etc]#  echo -e "Timeout=15" >> zabbix_agentd.conf
[root@agent etc]#  echo -e "Include=/usr/local/zabbix/etc/zabbix_agentd.conf.d/" >> zabbix_agentd.conf
[root@agent etc]# /etc/init.d/zabbix_agentd start
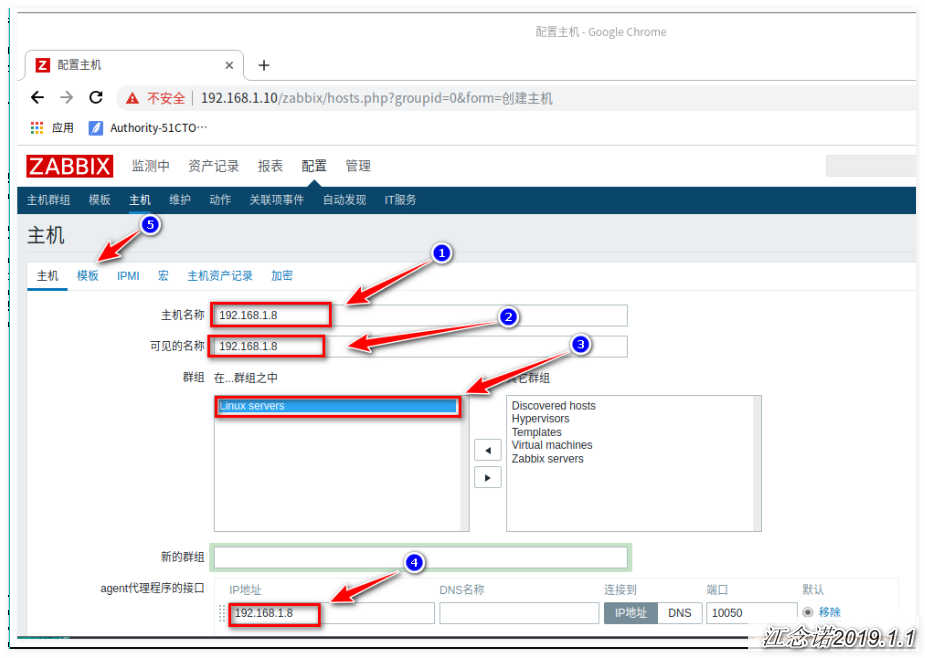
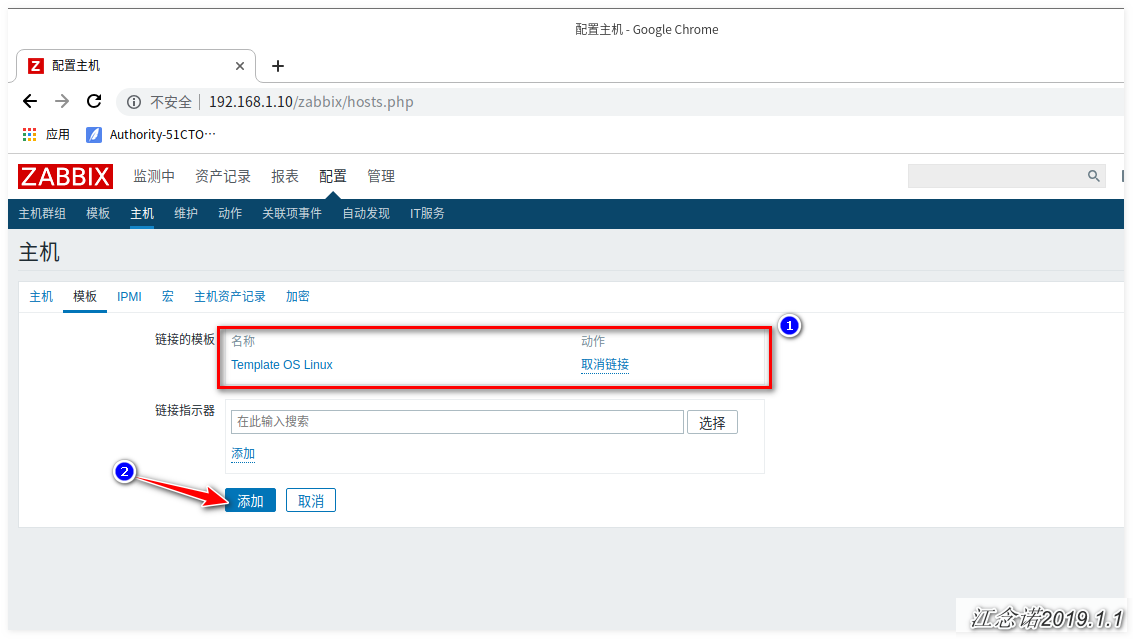
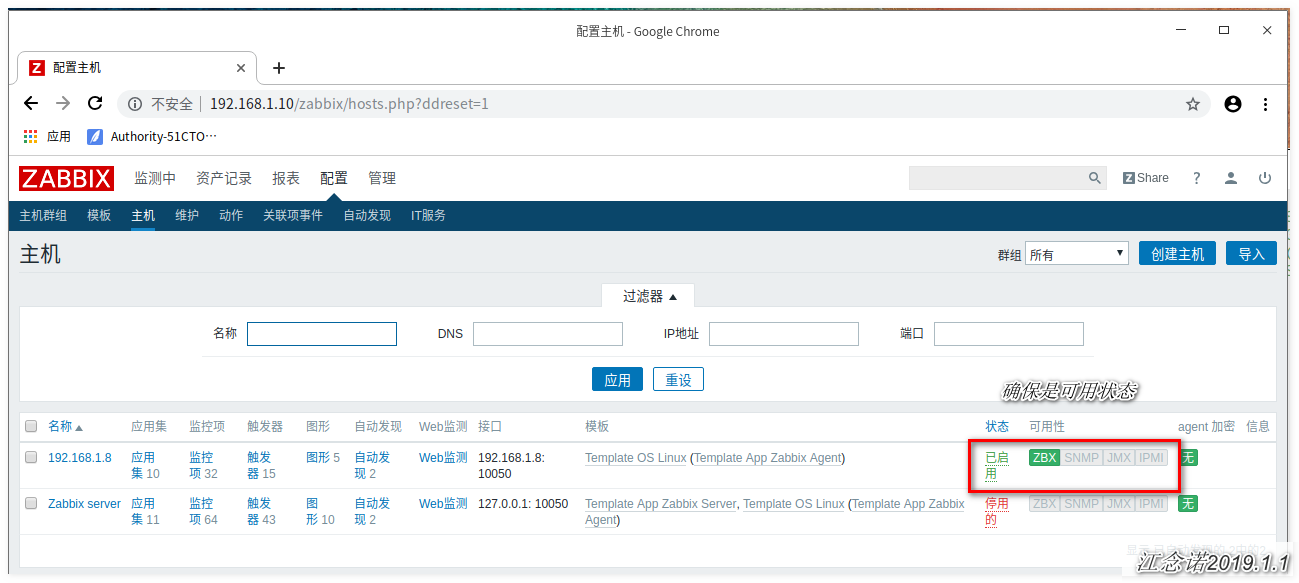
The configuration of web interface is as follows: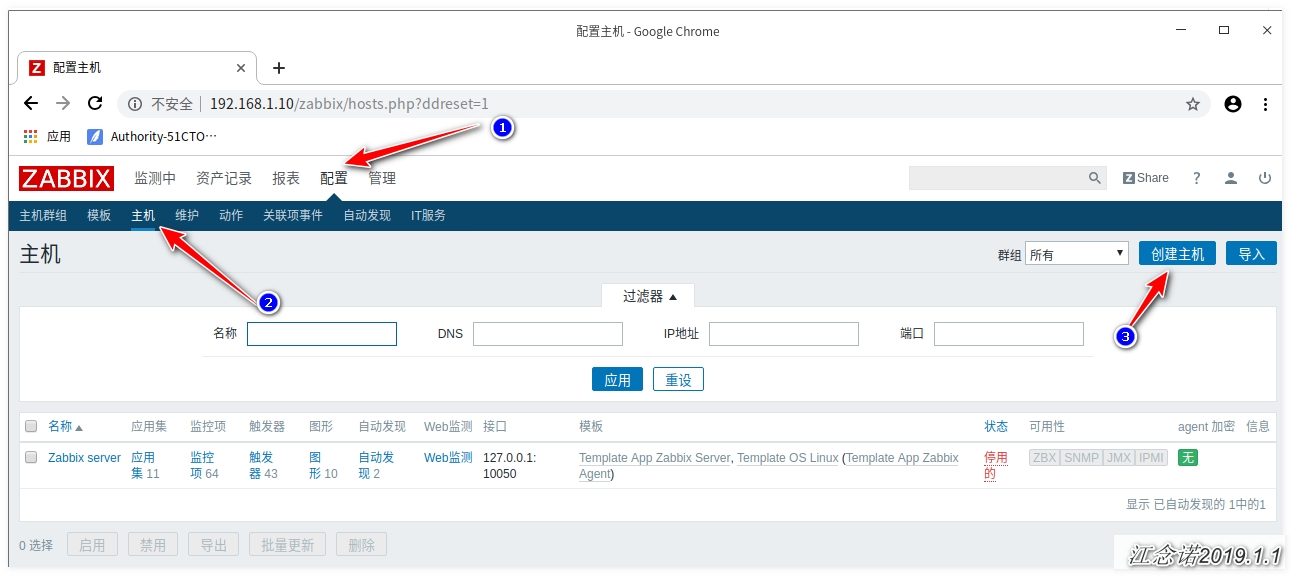
(2) Install redis service
To install in the agent:
[root@agent ~]# tar zxf redis-4.0.14.tar.gz
[root@agent ~]# cd redis-4.0.14/
[root@agent redis-4.0.14]# make && make install
[root@agent redis-4.0.14]# cd utils/
[root@agent utils]# ./install_server.sh
(3) Define monitoring redis file
As shown in the picture: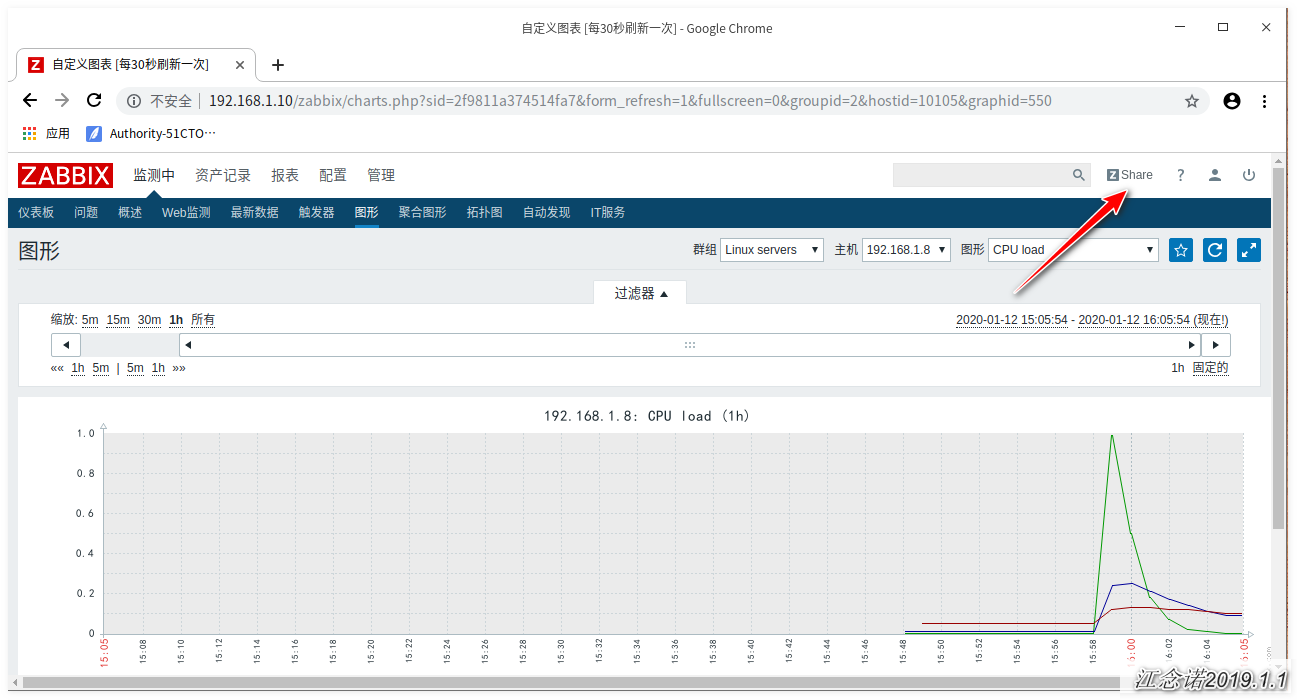

The zabbix agent needs to be configured as follows:
[root@zabbix ~]# cd /usr/local//zabbix/etc/zabbix_agentd.conf.d/
[root@zabbix zabbix_agentd.conf.d]# vim zbx_redis.conf
UserParameter=redis.status[*],/usr/local/bin/redis-cli -h 127.0.0.1 -p 6379 info|grep $1|grep -v _human|cut -d : -f2
UserParameter=redis.proc,pidof redis-server | wc -l
//Modify the downloaded configuration file and store it in the specified place
[root@agent zabbix_agentd.conf.d]# /etc/init.d/zabbix_agentd restart
//Restart zabbix agent service
(4) zabbix server for testing
[root@zabbix ~]# zabbix_get -s 192.168.1.8 -p 10050 -k redis.status[used_memory:]
849472
//Data return indicates no problem
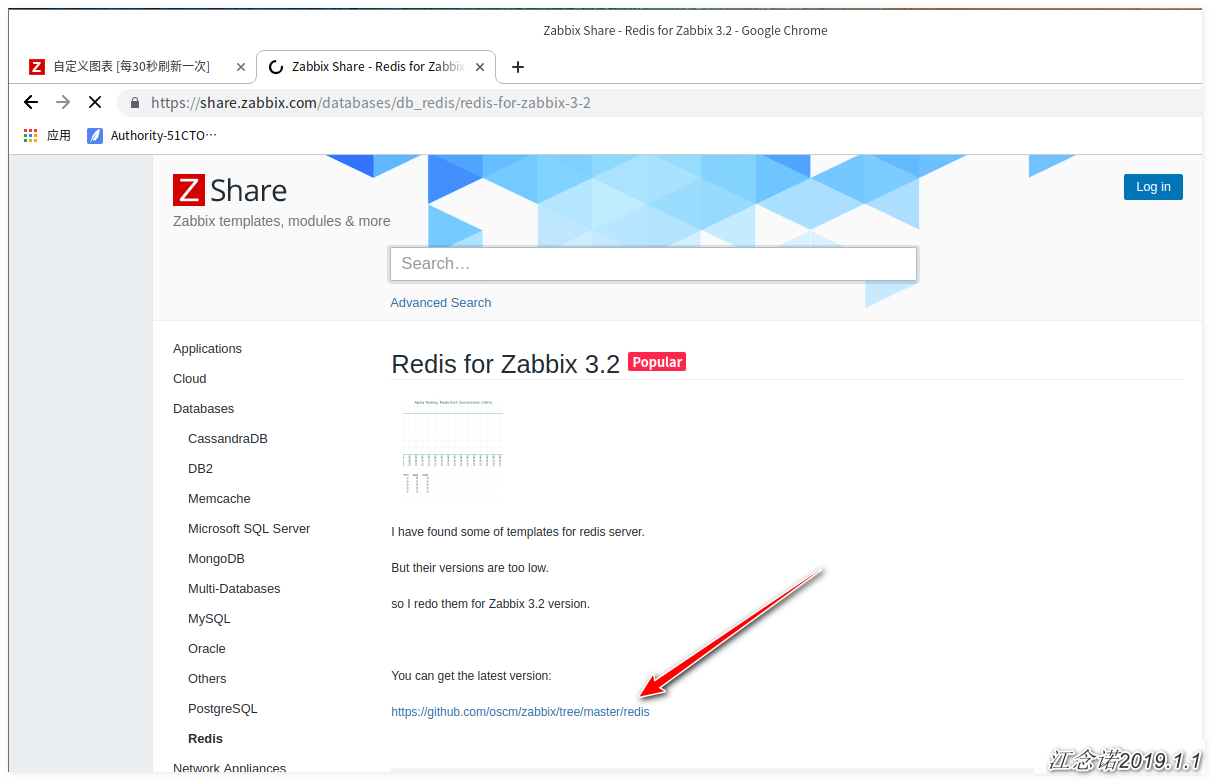
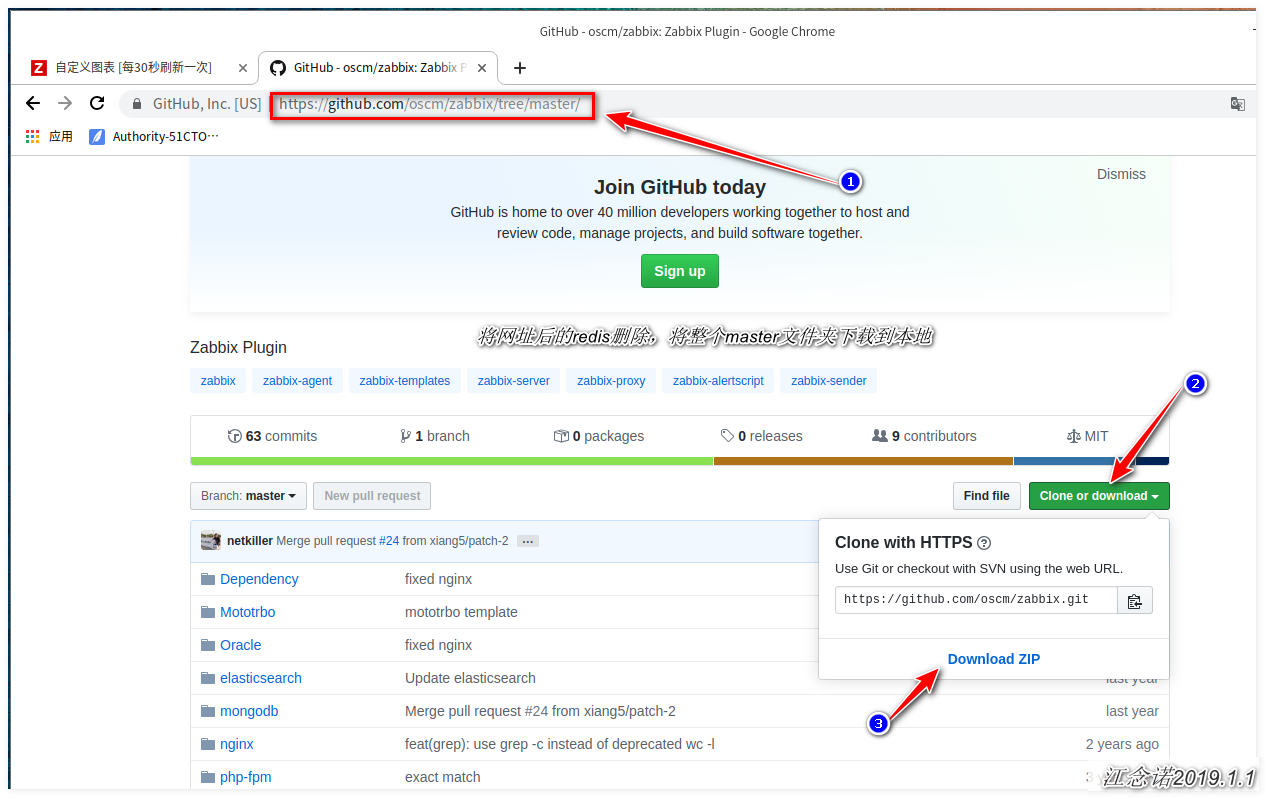
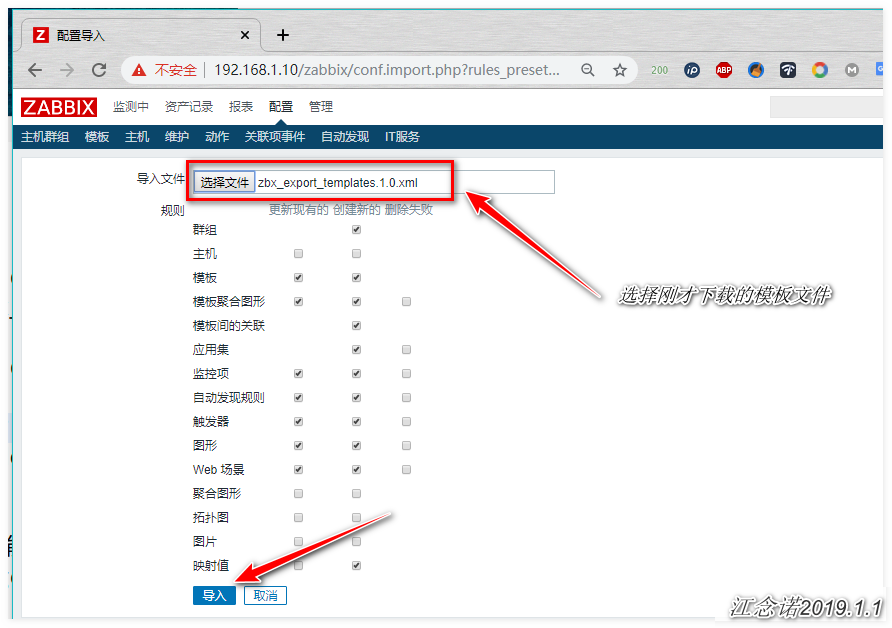
(5) Import template and monitor
As shown in the picture: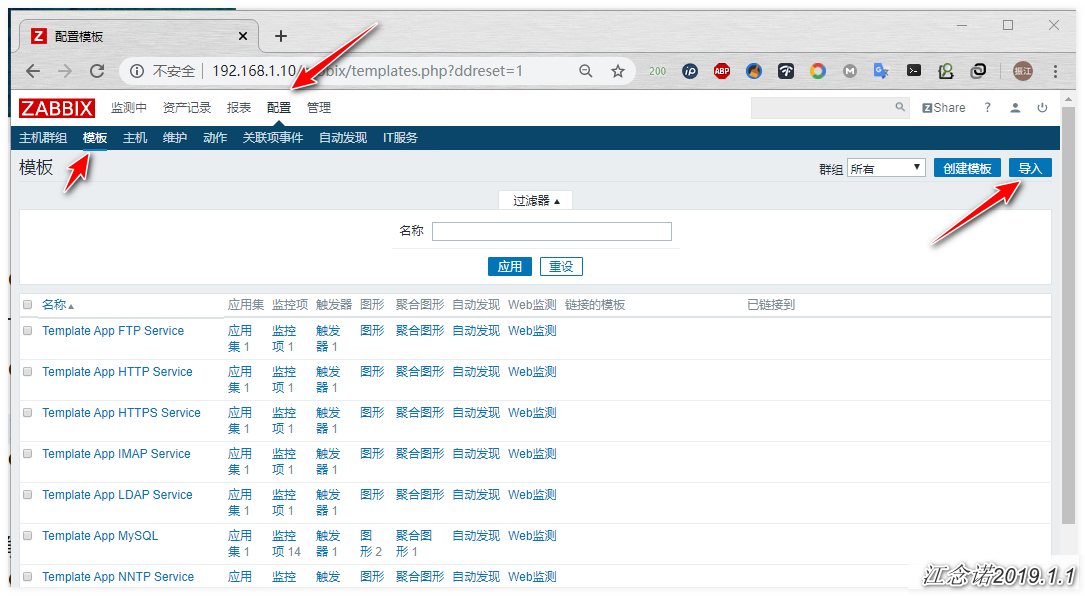
Verification succeeded!
2, Configure zabbix to monitor tomcat
Monitoring Tomcat requires the ZABBIX [Java] gateway component (introduced in zabbix2.0). As the name implies, Java gateway is similar to agent, but only used in Java. It should be noted that it can only obtain data actively, but not passively. Its data will eventually be submitted to the server or proxy.
If you need to enable the Tomcat monitoring function, you need to add the -- enable? Java parameter when compiling the zabbix server.
(1) zabbix server installs the ZABBIX? Java? Gateway program
ZABBIX? Java? Gateway program can be installed on either the ZABBIX server or the monitored side, or it can be installed separately, but it is generally installed on the ZABBIX server. Then this case is installed on the ZABBIX server.
download Required software
The operation of zabbix server (192.168.1.8) is as follows:
[root@zabbix ~]# rpm -ivh zabbix-java-gateway-3.2.1-1.el7.x86_64.rpm
[root@zabbix ~]# sed -i '/LISTEN_IP=/s/^#//' /etc/zabbix/zabbix_java_gateway.conf
[root@zabbix ~]# sed -i '/LISTEN_PORT=/s/^#//' /etc/zabbix/zabbix_java_gateway.conf
[root@zabbix ~]# systemctl start zabbix-java-gateway.service
[root@zabbix ~]# ss -lnt | grep 10052
LISTEN     0      50          :::10052                   :::*
[root@zabbix ~]# sed -i 's/# JavaGateway=/JavaGateway=192.168.1.10/g' /usr/local/zabbix/etc/zabbix_server.conf
[root@zabbix ~]# sed -i '/JavaGatewayPort/s/^#//' /usr/local/zabbix/etc/zabbix_server.conf
[root@zabbix ~]#  sed -i 's/# StartJavaPollers=0/StartJavaPollers=5/g' /usr/local/zabbix/etc/zabbix_server.conf
[root@zabbix ~]# /etc/init.d/zabbix_server restart
[root@zabbix ~]# jconsole / make sure the command is available, which is provided by Java gateway.
(2) Install and configure tomcat on the test side
The operation of tomcat tester (192.168.1.8) is as follows:
[root@tomcat ~]# java version / / ensure the java environment
openjdk version "1.8.0_161"
OpenJDK Runtime Environment (build 1.8.0_161-b14)
OpenJDK 64-Bit Server VM (build 25.161-b14, mixed mode)
[root@tomcat ~]# tar zxf apache-tomcat-8.5.35.tar.gz
[root@tomcat ~]# mv apache-tomcat-8.5.35 /usr/local/tomcat
[root@tomcat ~]# sed -i '308a CATALINA_OPTS=" $CATALINA_OPTS  -Dcom.sun.management.jmxremote  -Dcom.sun.management.jmxremote.port=8888 -Dcom.sun.management.jmxremote.ssl=false  -Djava.rmi.server.hostname=192.168.1.8  -Dcom.sun.management.jmxremote.authenticate=flase" ' /usr/local/tomcat/bin/catalina.sh
//It must be ensured that the content is inserted into the following positions (two ××)
# ----- Execute The Requested Command -----------------------------------------
CATALINA_OPTS=" $CATALINA_OPTS  -Dcom.sun.management.jmxremote  -Dcom.sun.management.jmxremote.port=8888 -Dcom.sun.management.jmxremote.ssl=false  -Djava.rmi.server.hostname=192.168.1.8  -Dcom.sun.management.jmxremote.authenticate=flase"

# Bugzilla 37848: only output this if we have a TTY
//In the added content: IP is the IP of Tomcat, port "8888" can be customized, do not conflict!
[root@tomcat ~]# /usr/local/tomcat/bin/startup.sh
[root@tomcat ~]# ss -lnt | grep 8080
LISTEN     0      100         :::8080                    :::*
[root@tomcat ~]# ss -lnt | grep 8888
LISTEN     0      50          :::8888                    :::*
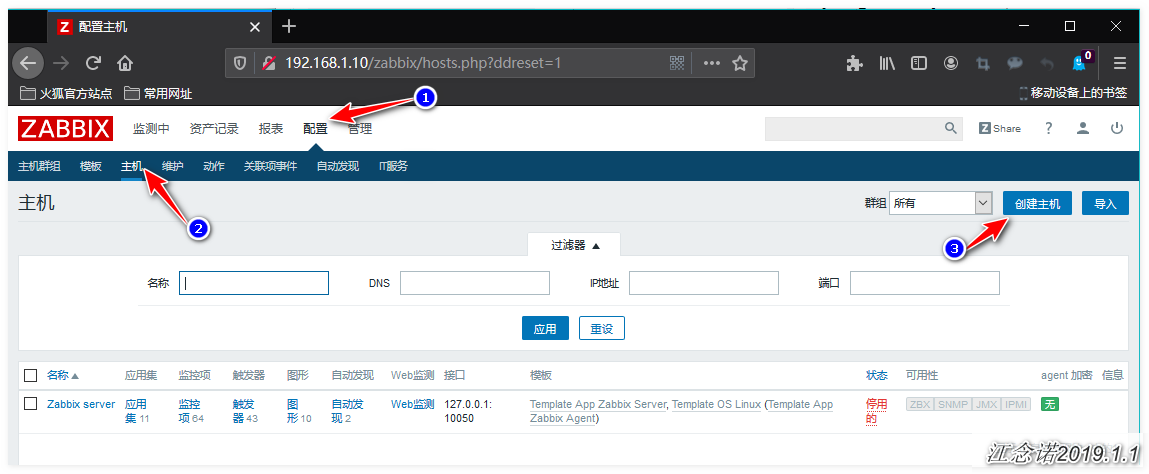
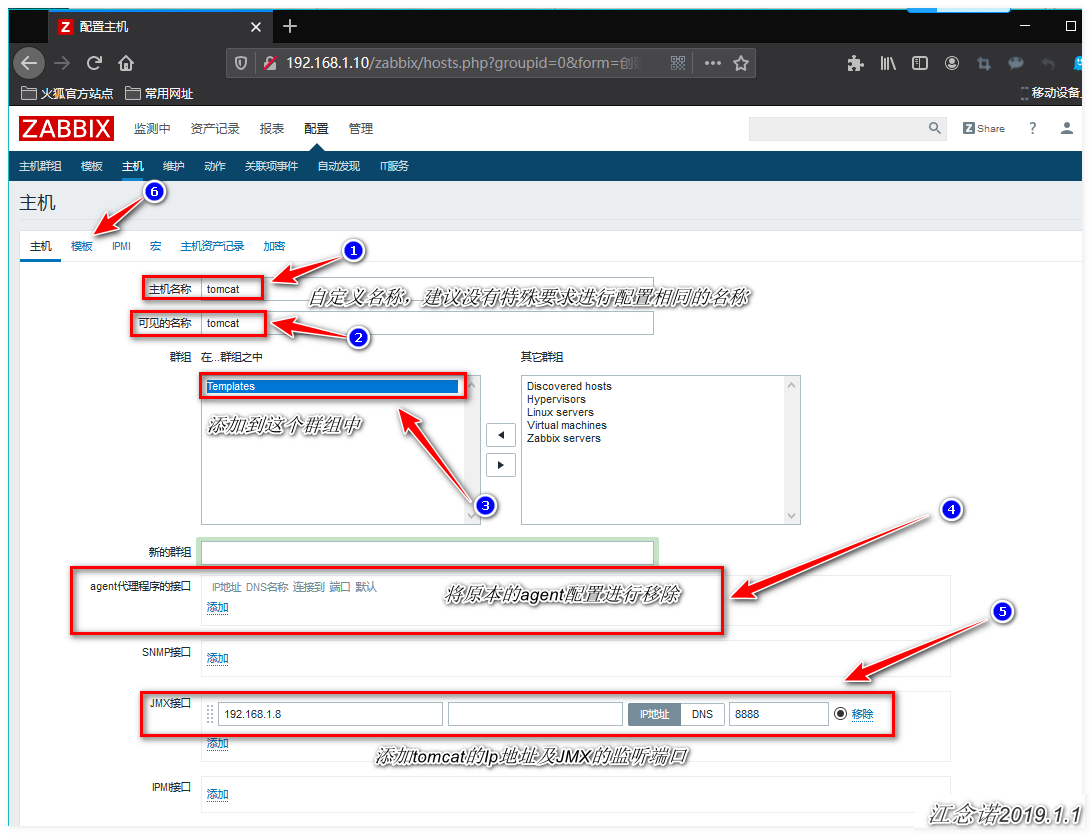
(3) Log in to the web interface provided by zabbix server for configuration
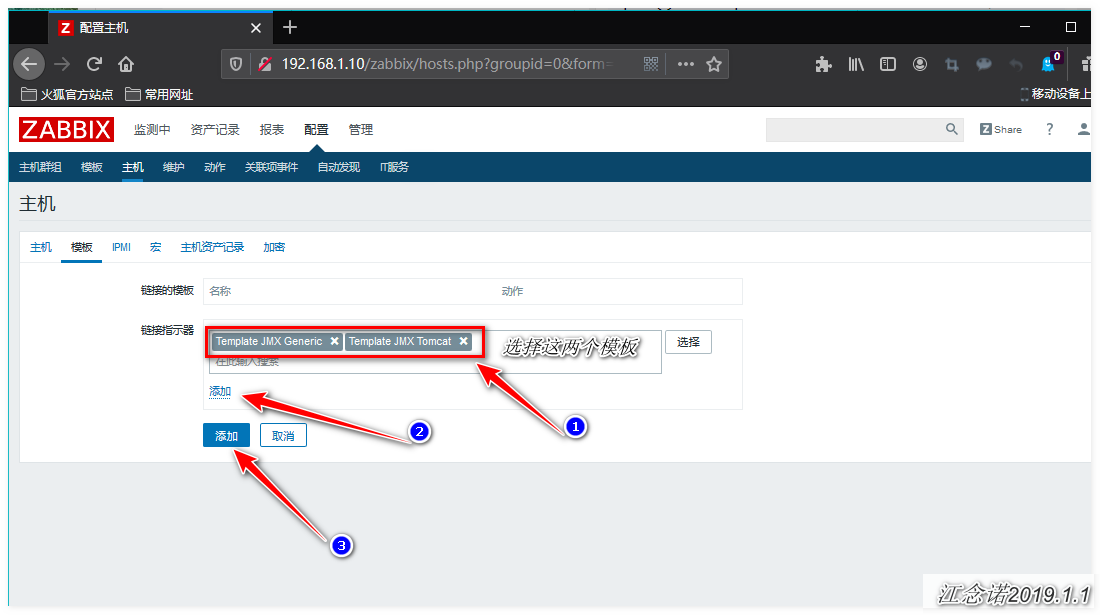
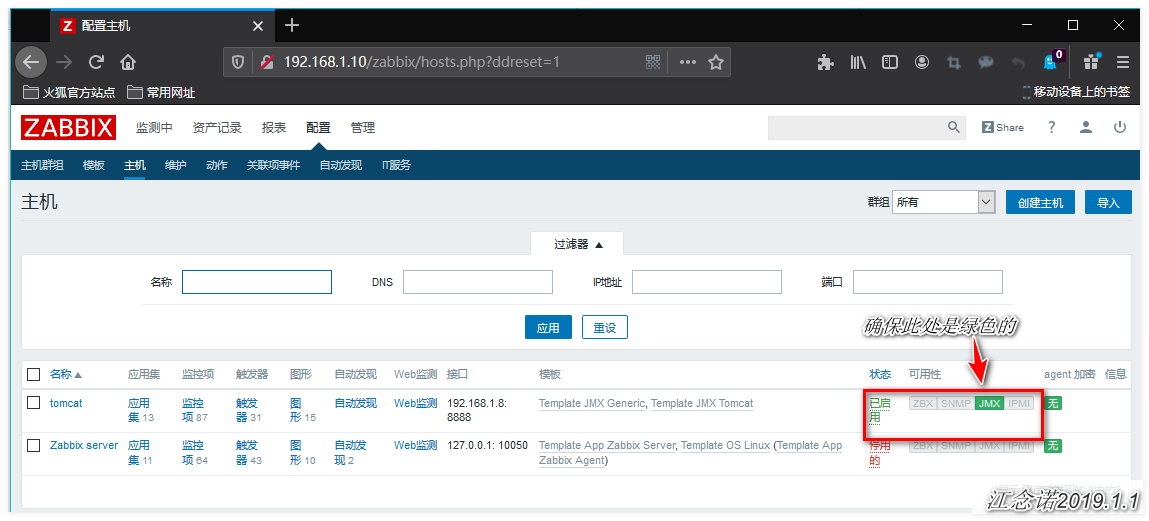
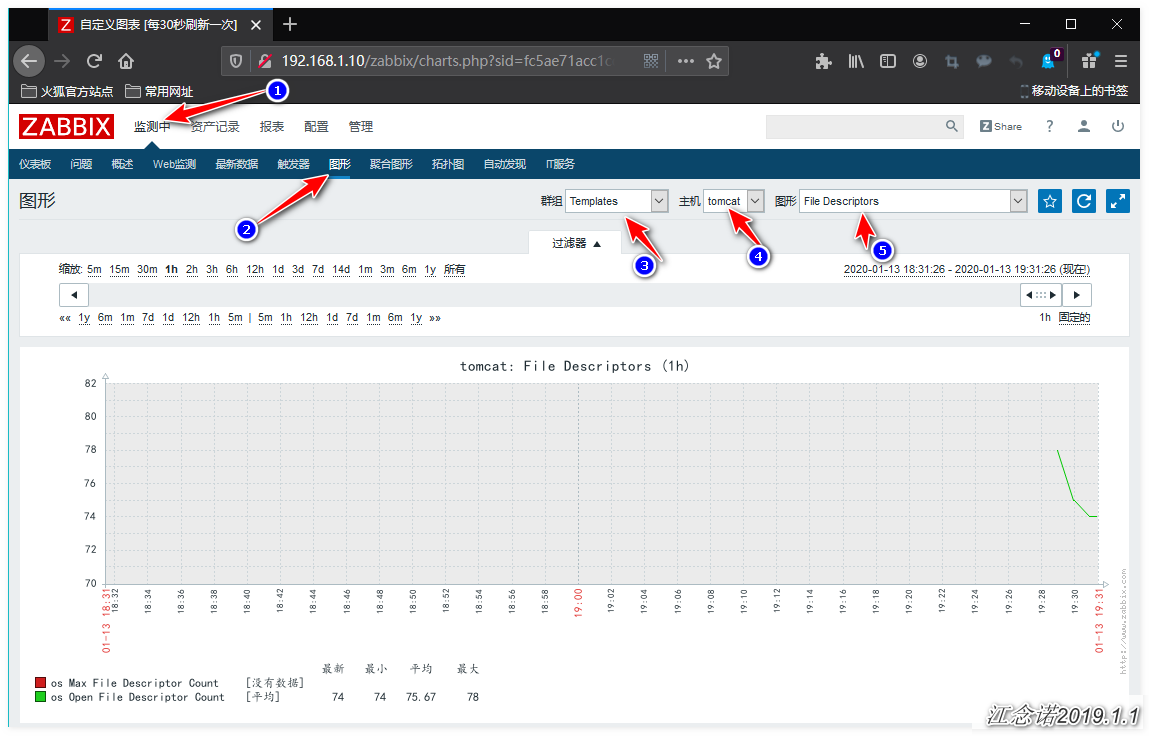
You can see that the data has been monitored!
tomcat monitoring complete!
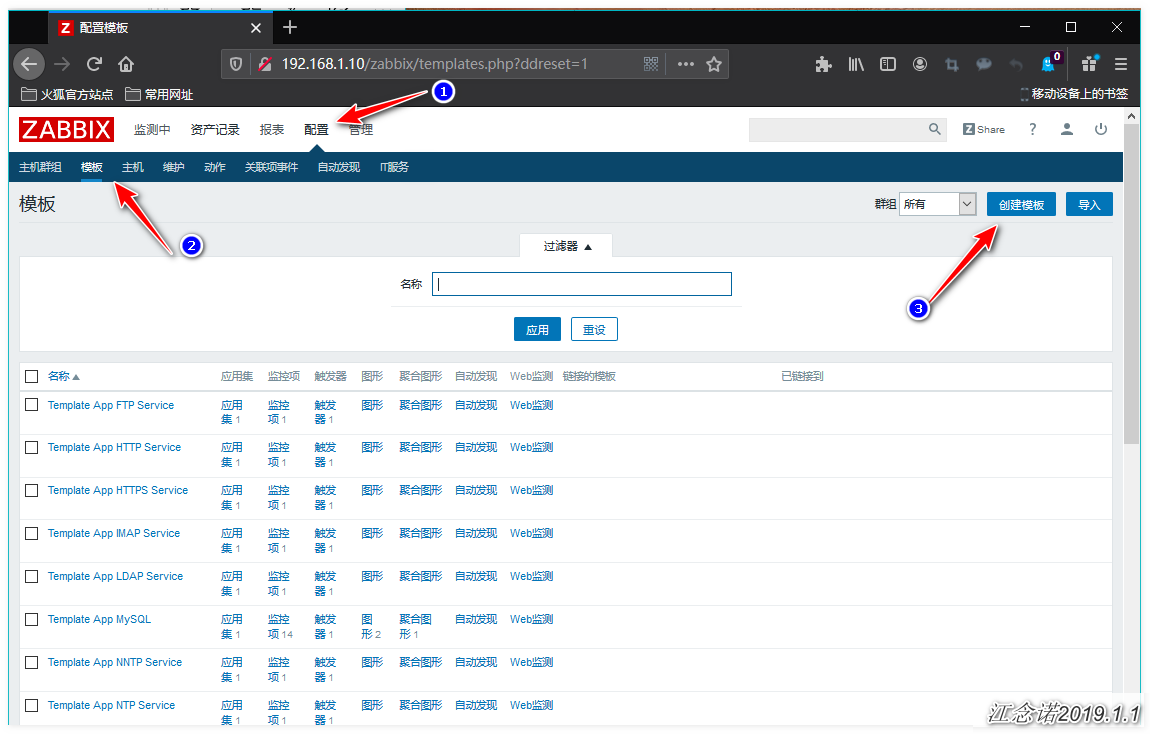
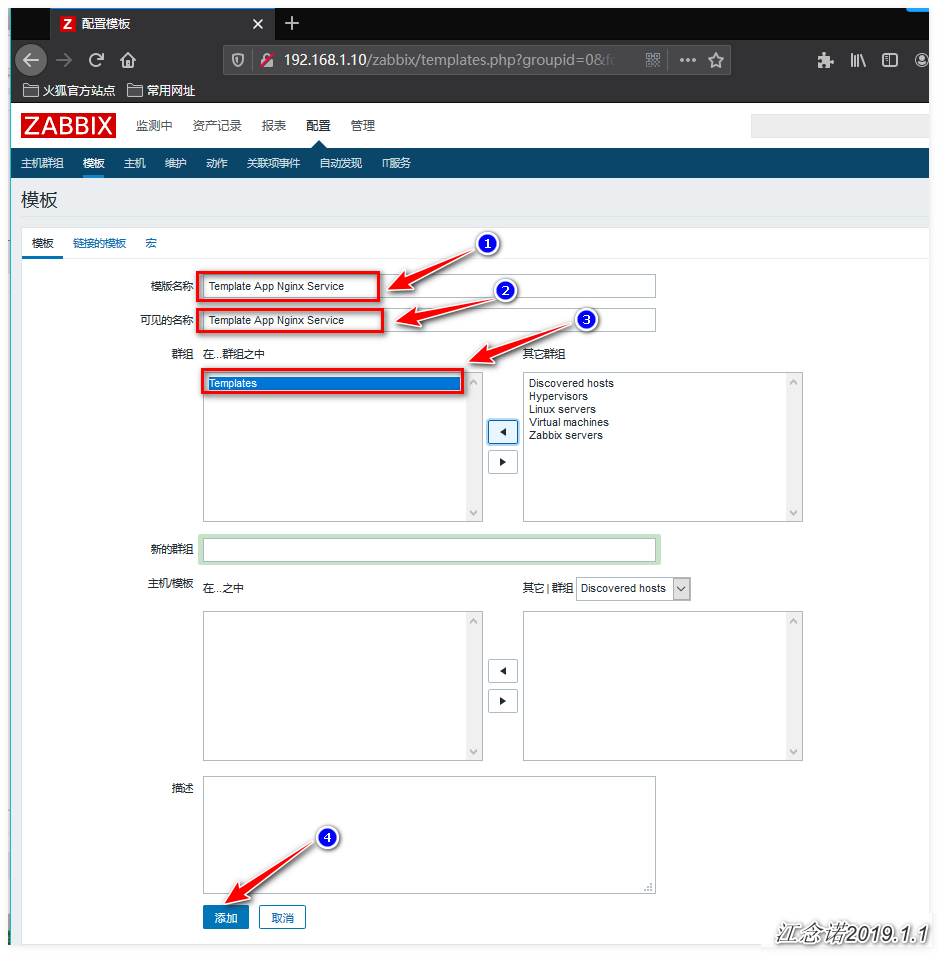
3, Configure zabbix to monitor nginx
(1) Test machine (192.168.1.7) deploy zabbix agent
[root@nginx ~]# tar zxf zabbix-3.2.1.tar.gz  && cd zabbix-3.2.1/
[root@nginx zabbix-3.2.1]#  ./configure --prefix=/usr/local/zabbix --enable-agent && make && make install
[root@nginx zabbix-3.2.1]# cp misc/init.d/fedora/core/zabbix_agentd /etc/init.d/
[root@nginx zabbix-3.2.1]# useradd zabbix
[root@nginx zabbix-3.2.1]# sed -i "s#BASEDIR=/usr/local#BASEDIR=/usr/local/zabbix#g" /etc/init.d/zabbix_agentd
[root@nginx zabbix-3.2.1]# chmod +x /etc/init.d/zabbix_agentd
[root@nginx zabbix-3.2.1]# cd /usr/local/zabbix/etc/
[root@nginx etc]#  sed -i '/PidFile=/s/^#//'  zabbix_agentd.conf
[root@nginx etc]# sed -i 's/Server=127.0.0.1/Server=192.168.1.10/g' zabbix_agentd.conf[root@nginx etc]# sed -i '/ListenPort=/s/^#//'  zabbix_agentd.conf
[root@nginx etc]# sed -i 's/ServerActive=127.0.0.1/ServerActive=192.168.1.10/g' zabbix_agentd.conf
[root@nginx etc]# sed -i 's/Hostname=Zabbix server/Hostname=192.168.1.7/g' zabbix_agentd.conf
[root@nginx etc]# echo -e "Timeout=15" >> zabbix_agentd.conf
[root@nginx etc]# echo -e "Include=/usr/local/zabbix/etc/zabbix_agentd.conf.d/" >> zabbix_agentd.conf
[root@nginx etc]# egrep -v '^$|^#' zabbix_agentd.conf
 PidFile=/tmp/zabbix_agentd.pid
LogFile=/tmp/zabbix_agentd.log
Server=192.168.1.10
 ListenPort=10050
ServerActive=192.168.1.10
Hostname=192.168.1.7
Timeout=15
Include=/usr/local/zabbix/etc/zabbix_agentd.conf.d/
[root@nginx etc]#  /etc/init.d/zabbix_agentd start
[root@nginx etc]# ss -lnt | grep 10050
(2) Testing machine (192.168.1.7) deploy nginx service
[root@nginx ~]# yum -y install pcre-devel zlib-devel openssl-devel
[root@nginx ~]# wget http://nginx.org/download/nginx-1.14.0.tar.gz
[root@nginx ~]# tar zxf nginx-1.14.0.tar.gz
[root@nginx ~]# cd nginx-1.14.0/
[root@nginx nginx-1.14.0]#  ./configure --with-http_stub_status_module && make && make install
[root@nginx nginx-1.14.0]# /usr/local/nginx/sbin/nginx
[root@nginx ~]#  mkdir /usr/local/zabbix/scripts/
[root@nginx ~]# vim /usr/local/zabbix/scripts/nginx.sh
#!/bin/bash
case $1 in
index)
    RS=`curl -s -I 192.168.1.7/index.html |head -n1 |awk '{print $2}'`
    echo $RS
    ;;
WorkerProcesses)
    RS=`ps aux |grep nginx | grep -w worker |wc -l`
    echo $RS
    ;;
bps)
    RS=`ab -q -n 1000 -c 1000 http://192.168.1.7/index.html |grep Request | awk '{print $4}'`
    echo $RS
    ;;
Current)
    LINES=`cat /usr/local/nginx/logs/access.log |wc -l`
    sleep 1
    NOW_LINES=`cat /usr/local/nginx/logs/access.log |wc -l`
    echo $NOW_LINES $LINES | awk '{print $1 -$2}'
;;
IP)
    RS=`cat /usr/local/nginx/logs/access.log | awk '{print $1}' |sort -u | wc -l`
    echo $RS
    ;;
VirtualHost)
    RS=`cat /usr/local/nginx/conf/nginx.conf |grep -v '#' | grep server_name | wc -l`
    echo $RS
    ;;
MD5)
    RS=`md5sum /usr/local/nginx/conf/nginx.conf |awk '{print $1}'`
    echo $RS
    ;;
PV)
    RS=`wc -l /usr/local/nginx/logs/access.log | awk '{print $1}'`
    echo $RS
    ;;
esac
[root@nginx ~]# chmod +s /usr/bin/netstat
[root@nginx ~]# chmod +x /usr/local/zabbix/scripts/nginx.sh
[root@nginx ~]# cd /usr/local/zabbix/etc/
[root@nginx etc]# echo -e 'UnsafeUserParameters=1' >> zabbix_agentd.conf
[root@nginx etc]# echo -e 'UserParameter=nginx.info[*],/usr/local/zabbix/scripts/nginx.sh  $1' >> zabbix_agentd.conf
[root@nginx etc]# echo -e 'UserParameter=nginx.ping[*],netstat -anput | grep -w 80 | grep -w LISTEN | wc -l' >> zabbix_agentd.conf
[root@nginx etc]# /etc/init.d/zabbix_agentd restart
(3) zabbix server for testing
[root@zabbix ~]# zabbix_get -s 192.168.1.7 -p 10050 -k nginx.info[index]
200
//A return value indicates a successful connection
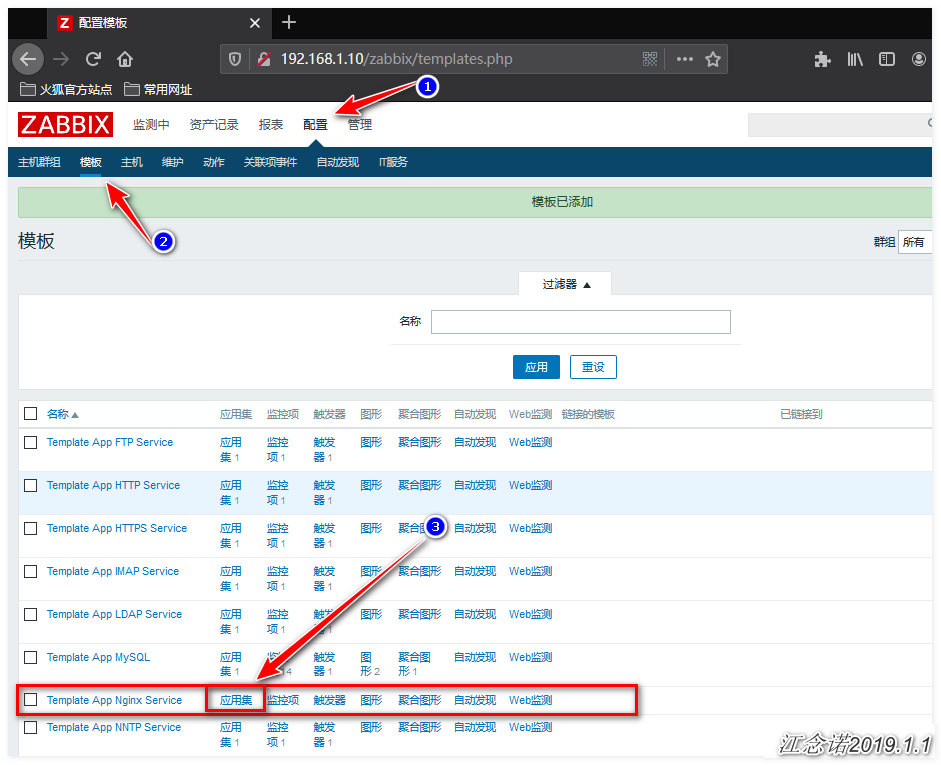
(4) Configure web pages
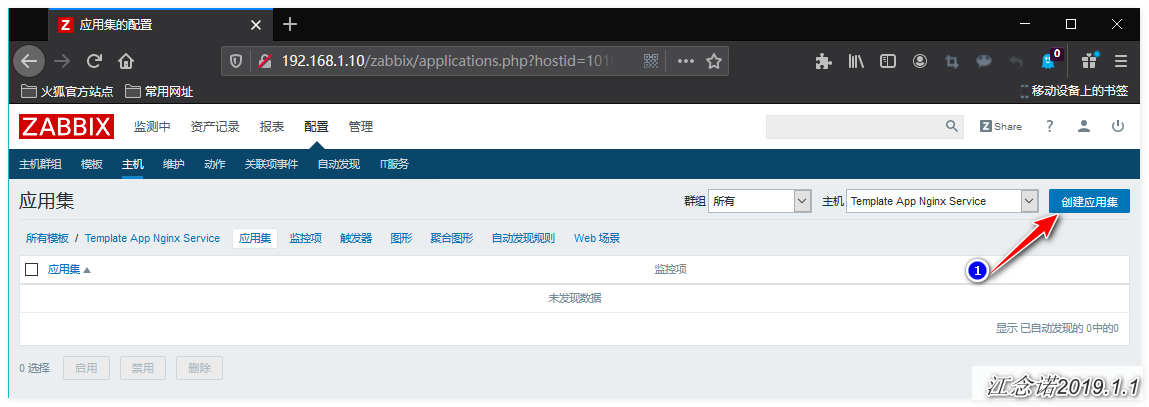
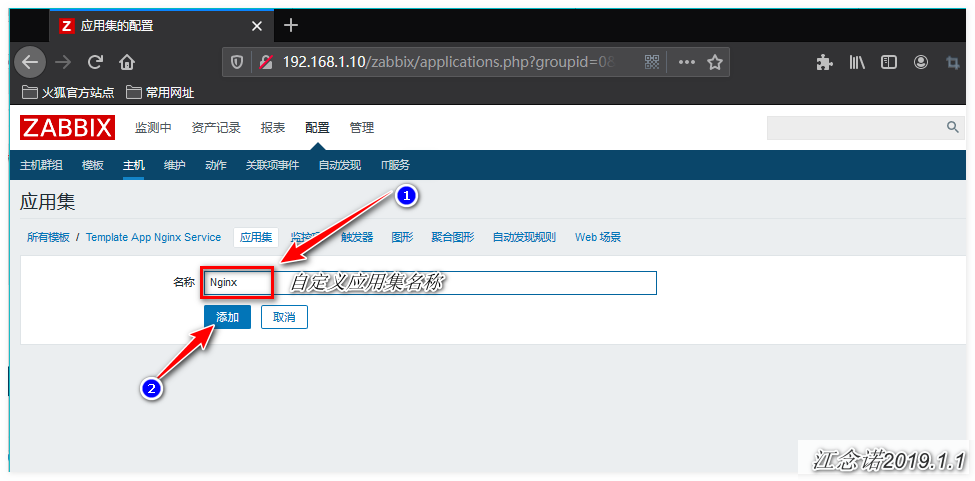
1) Configure application set
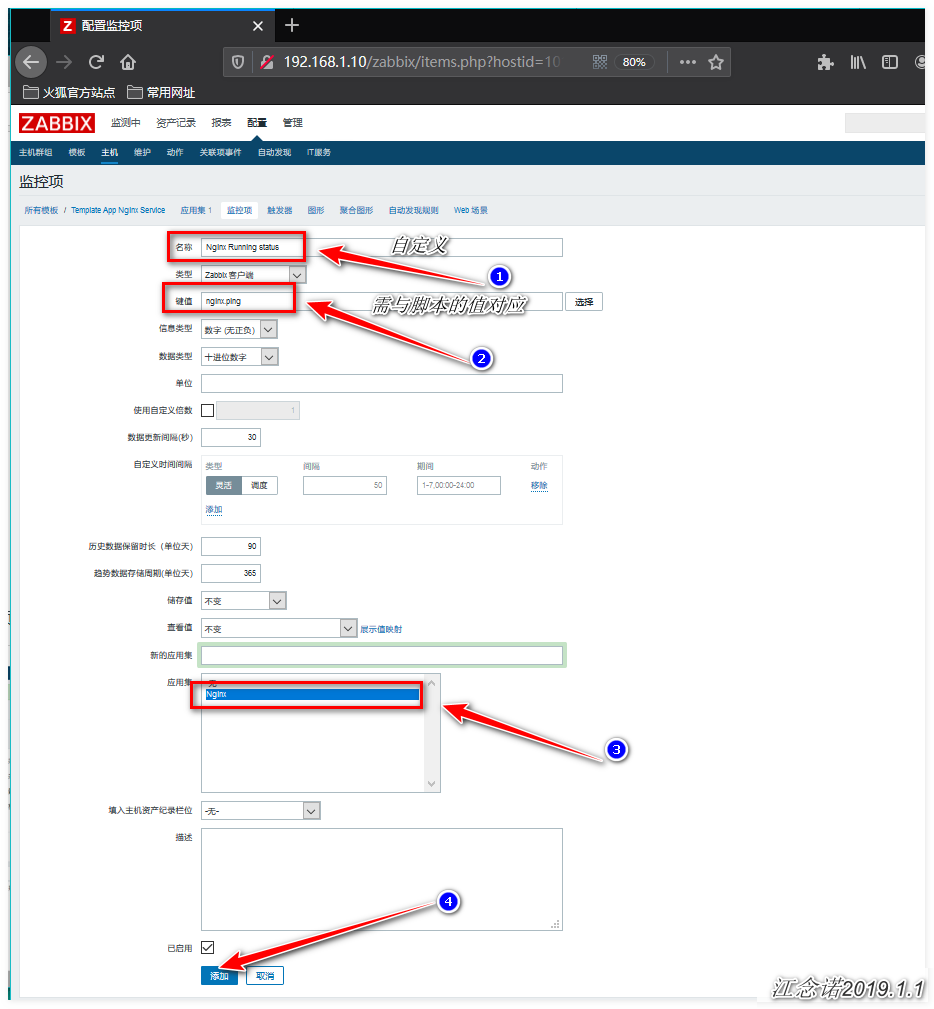
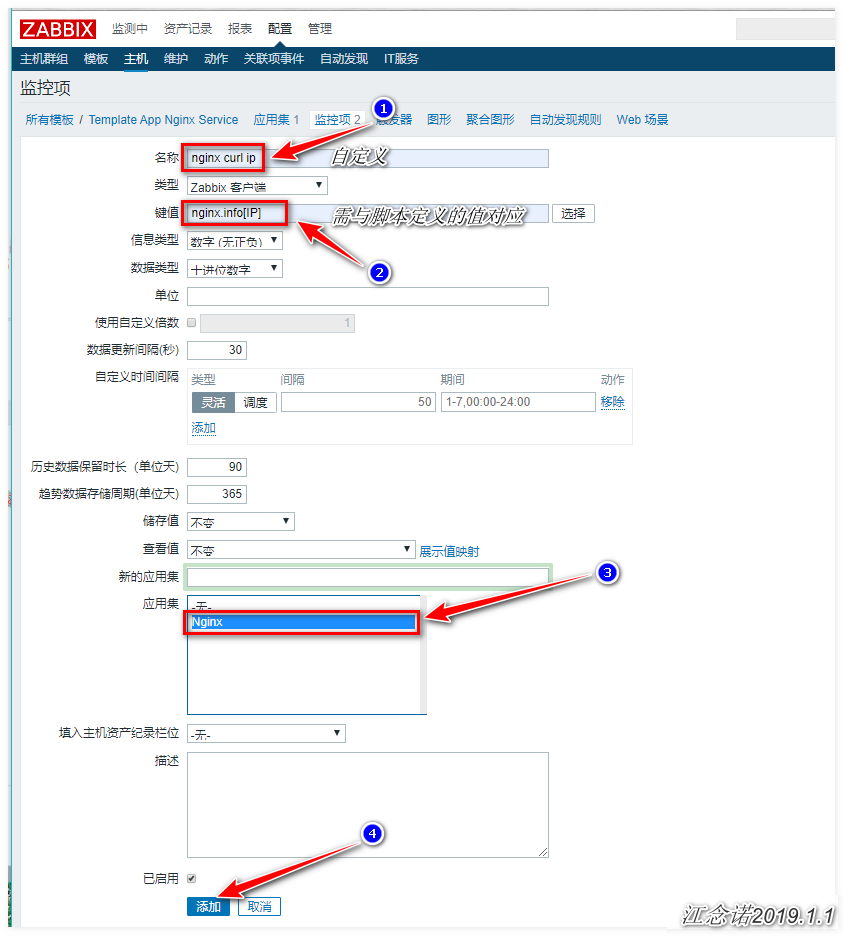
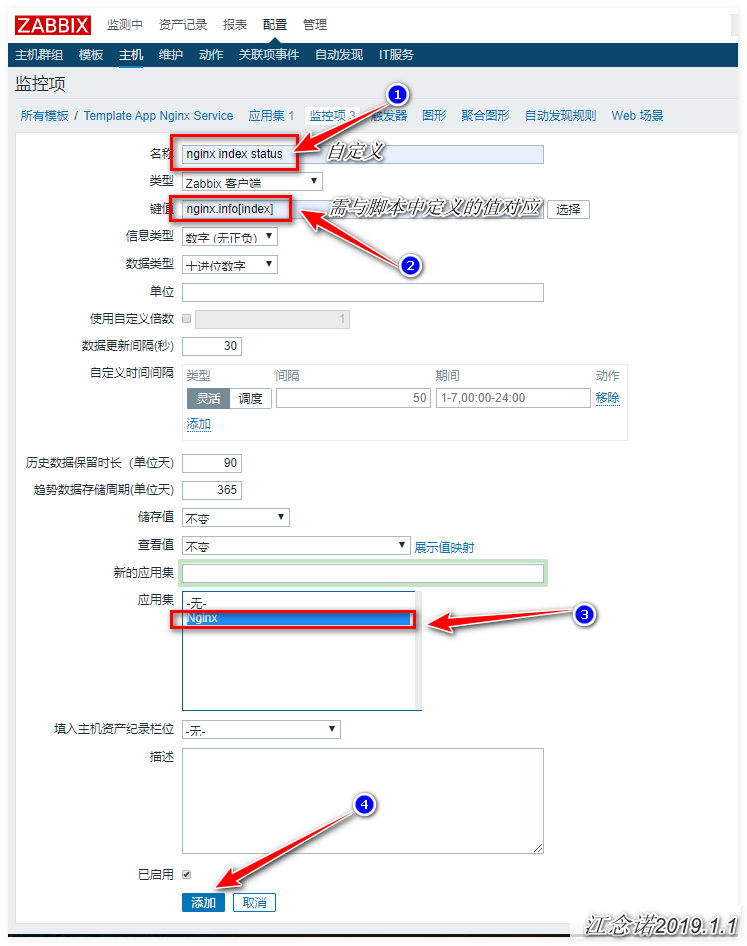
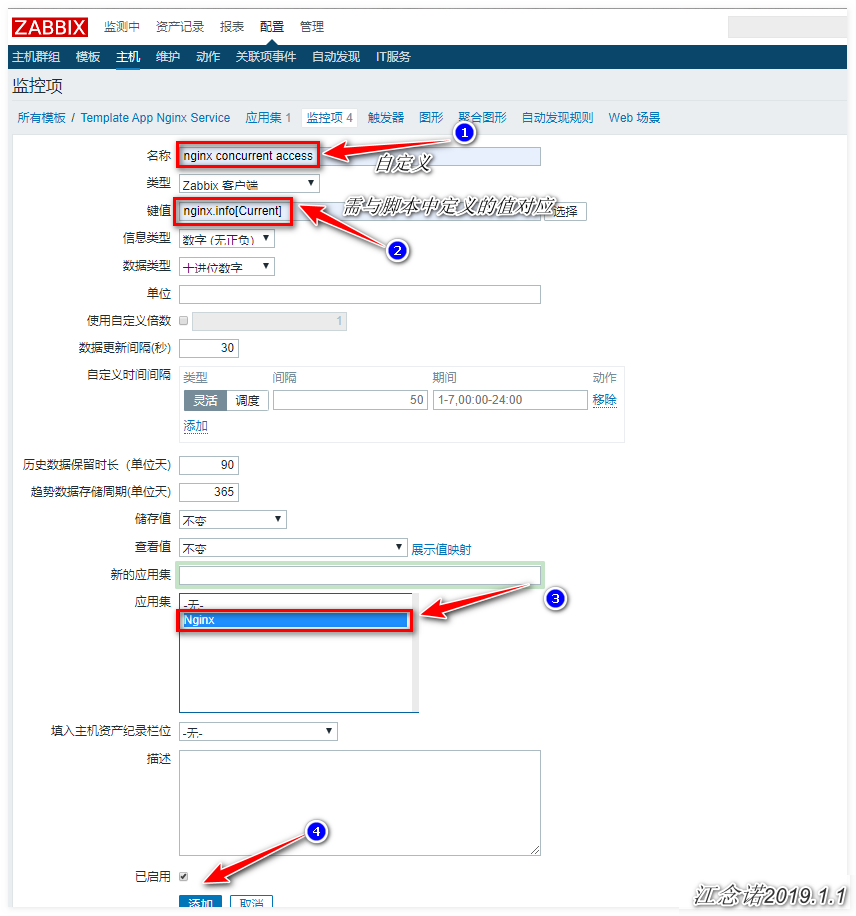
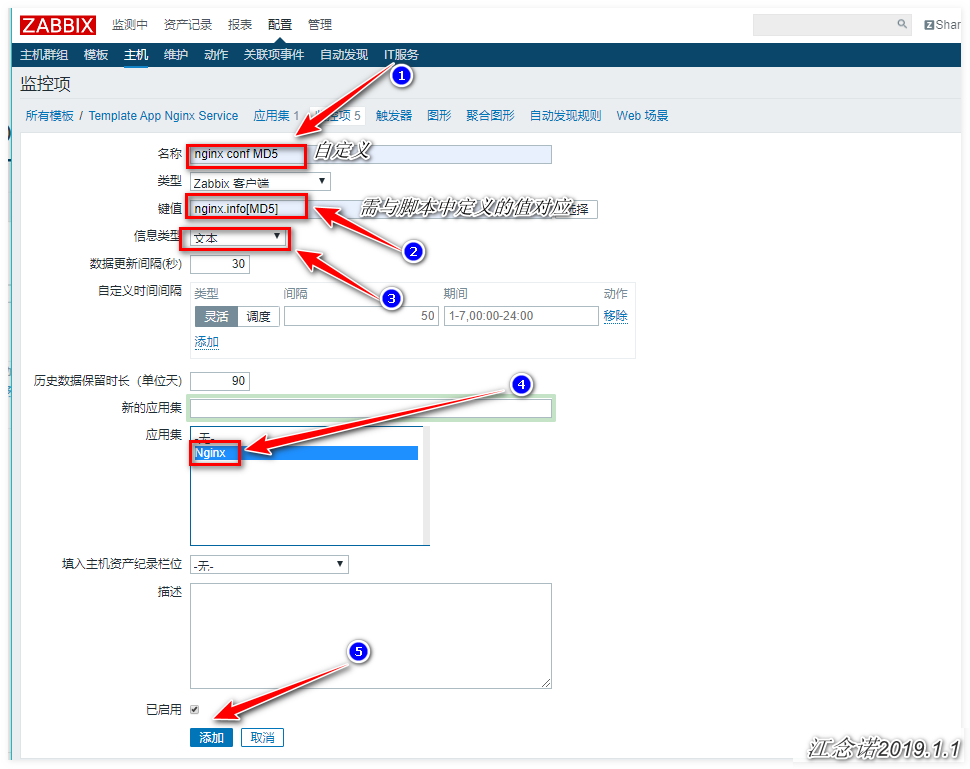
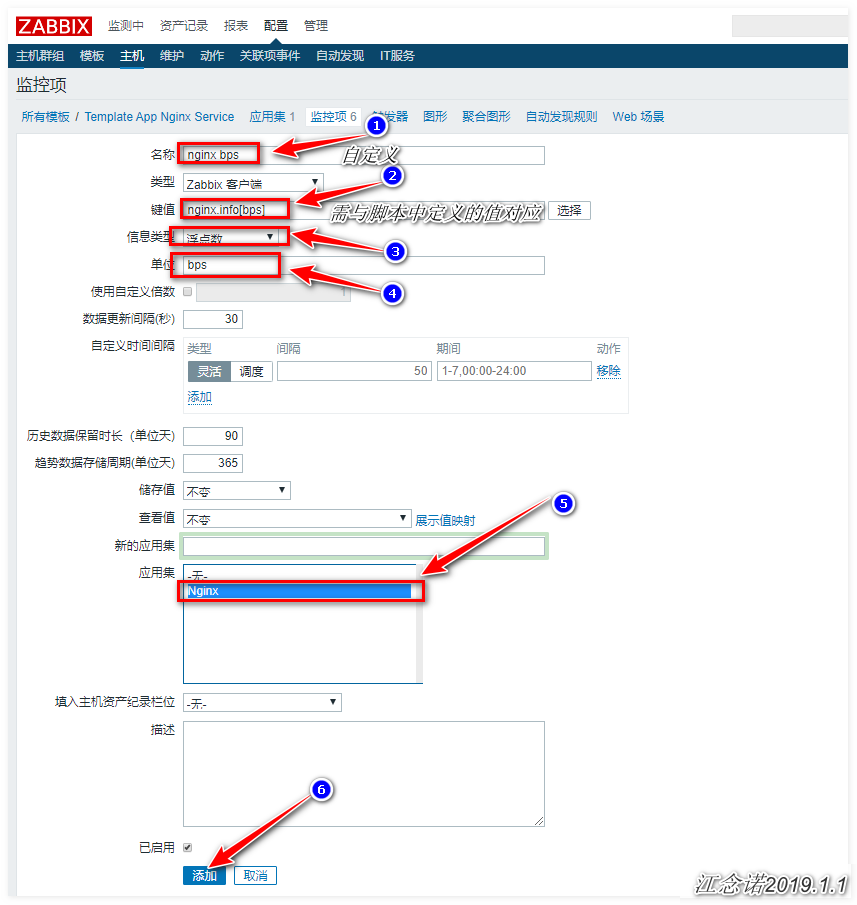
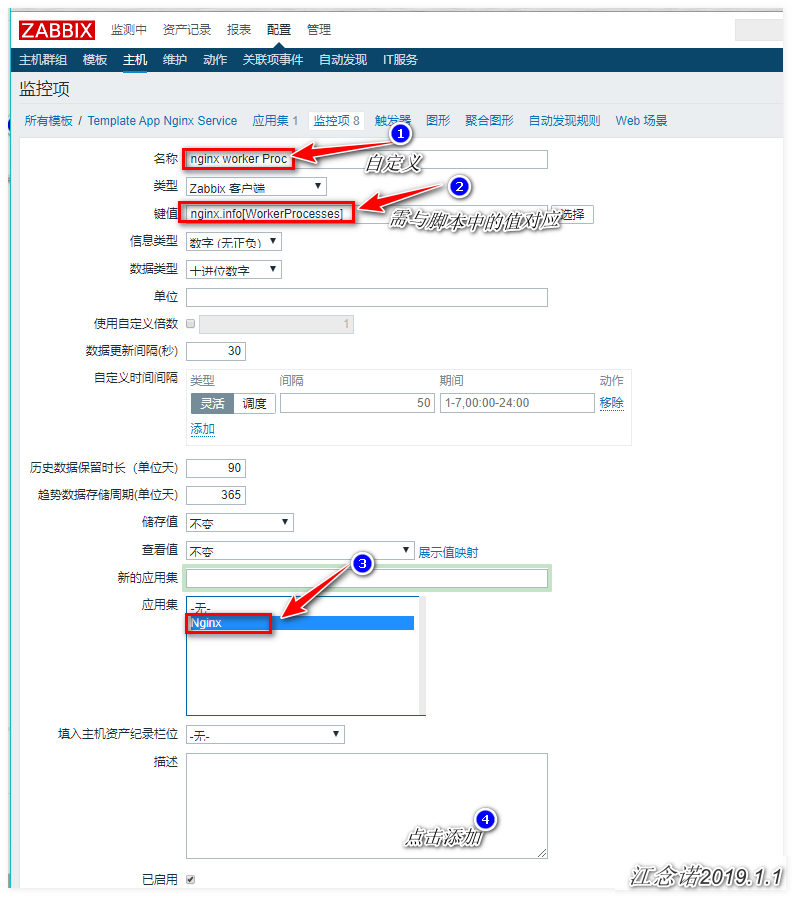
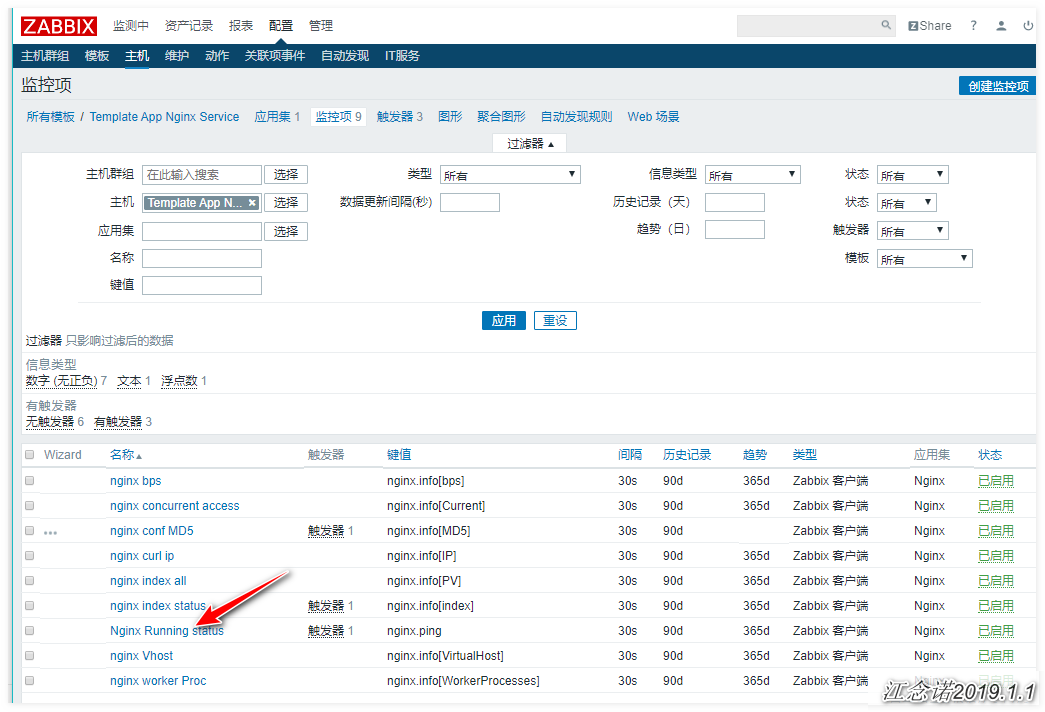
2) Configure monitoring items
Detect whether nginx survives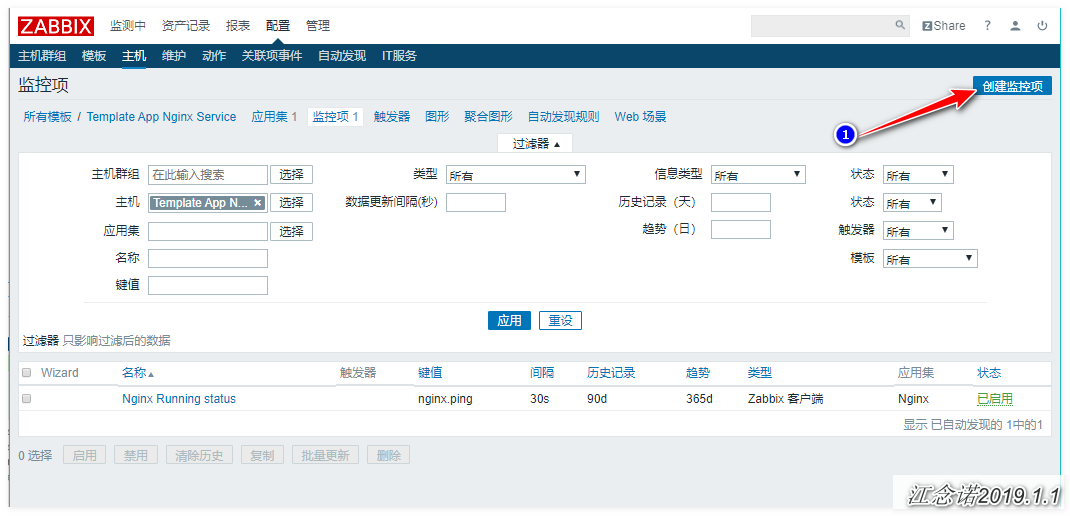
Monitor the total number of Nginx visits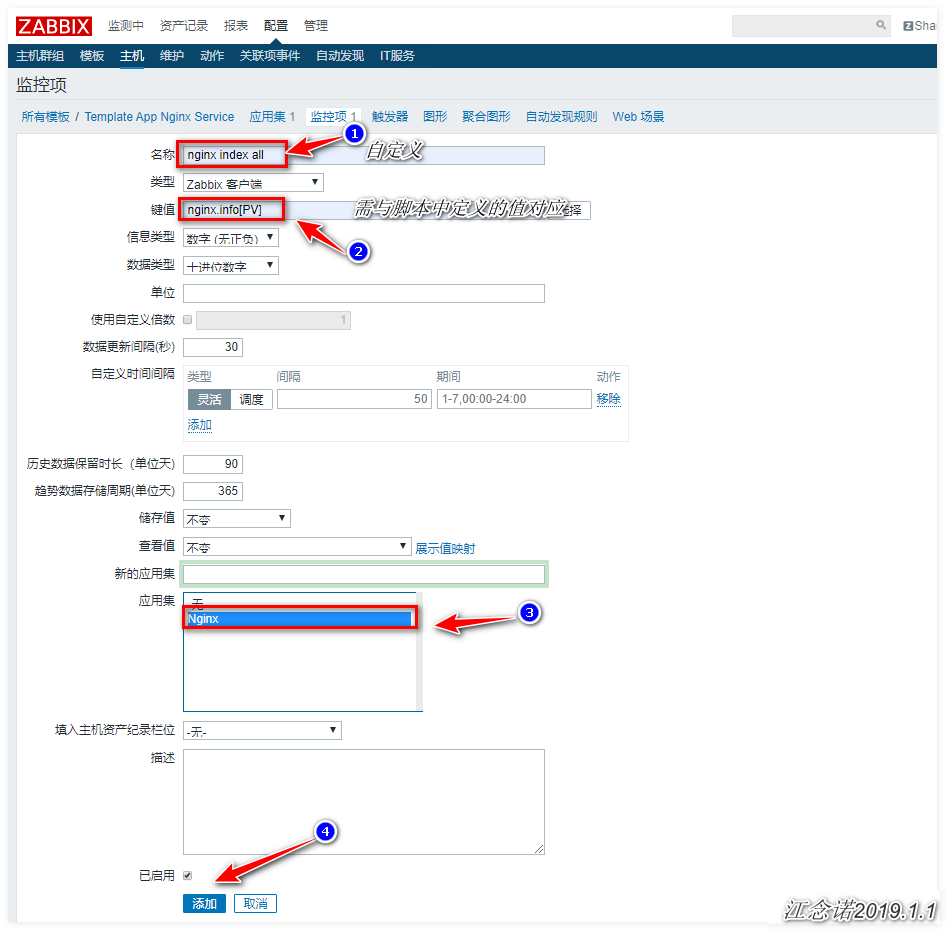
Independent IP number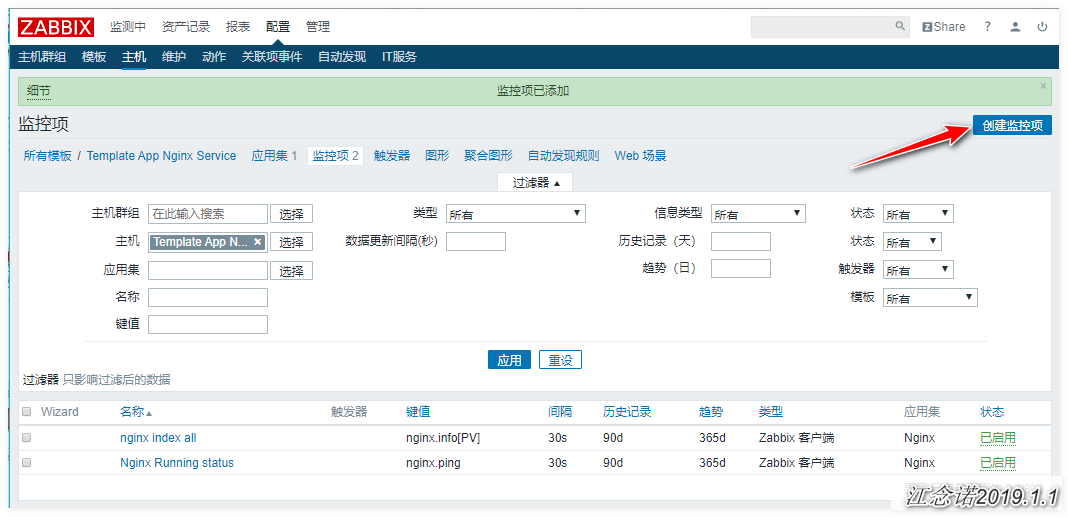
Status of Nginx home page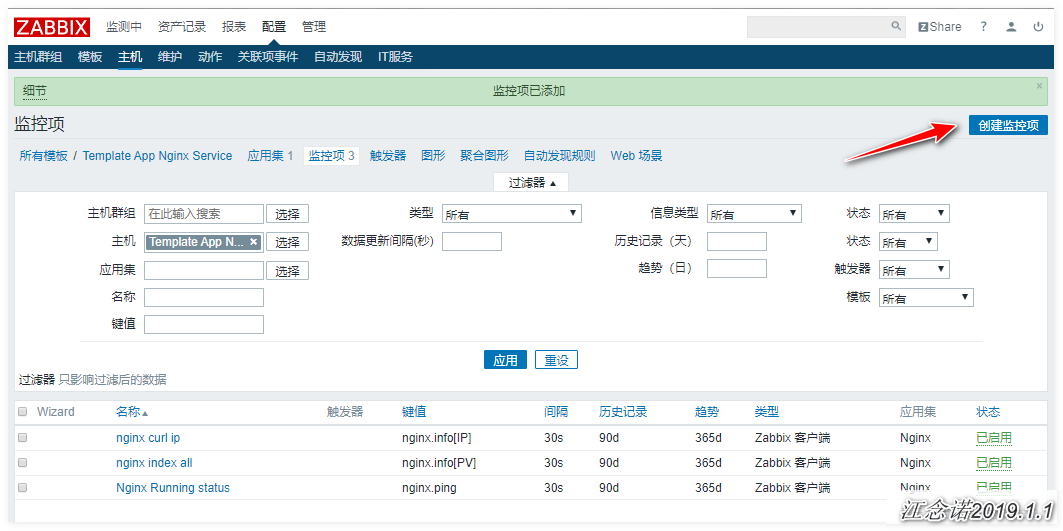
Current number of Nginx concurrent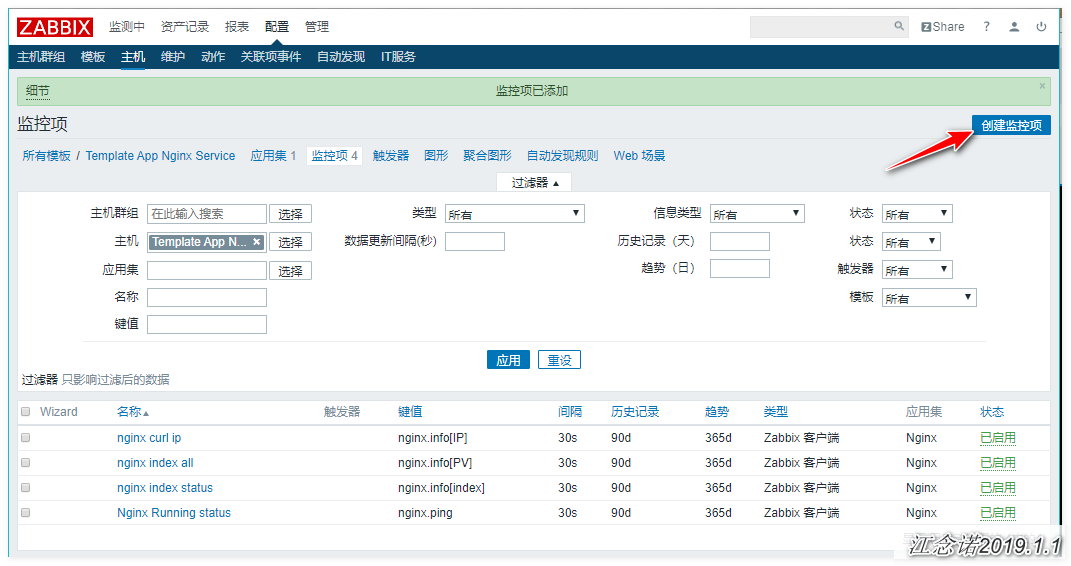
Monitor whether nginx configuration file is changed according to MD5 value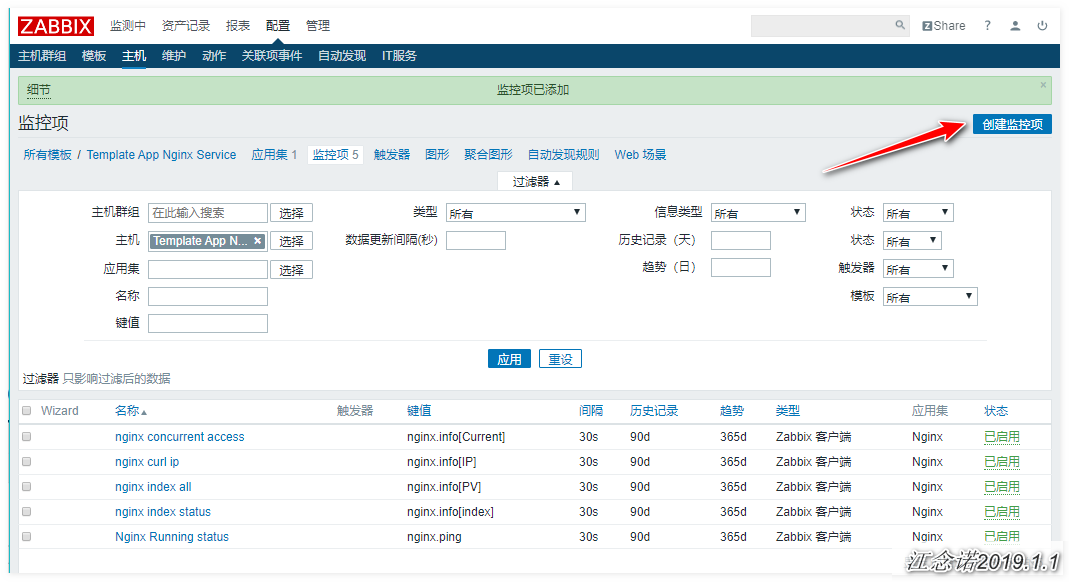
nginx current throughput bps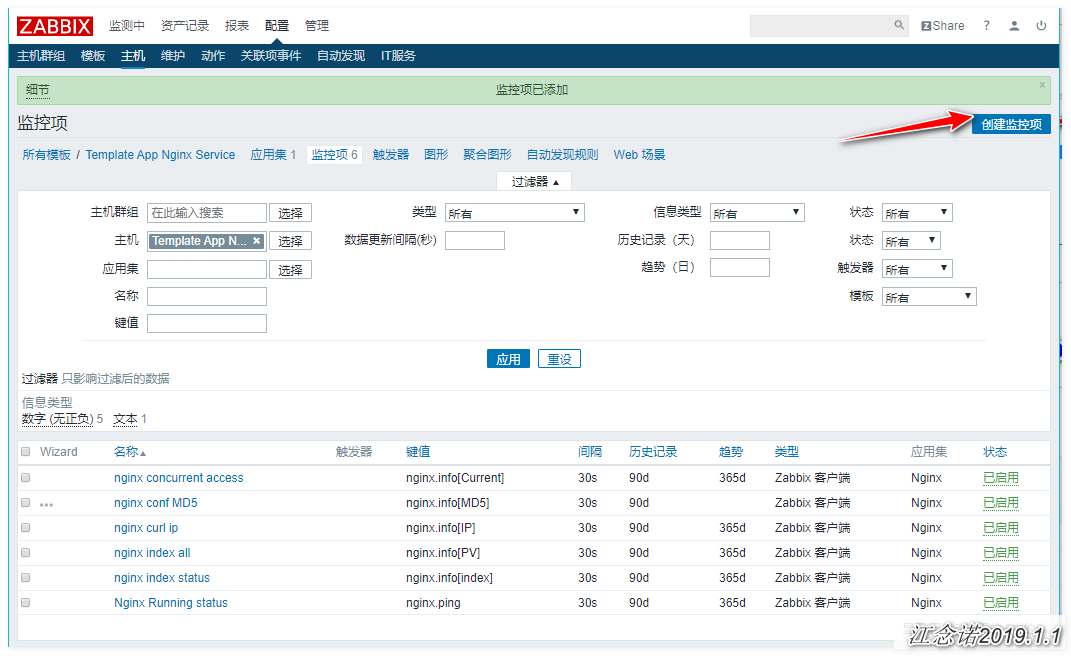
Monitor the number of nginx working processes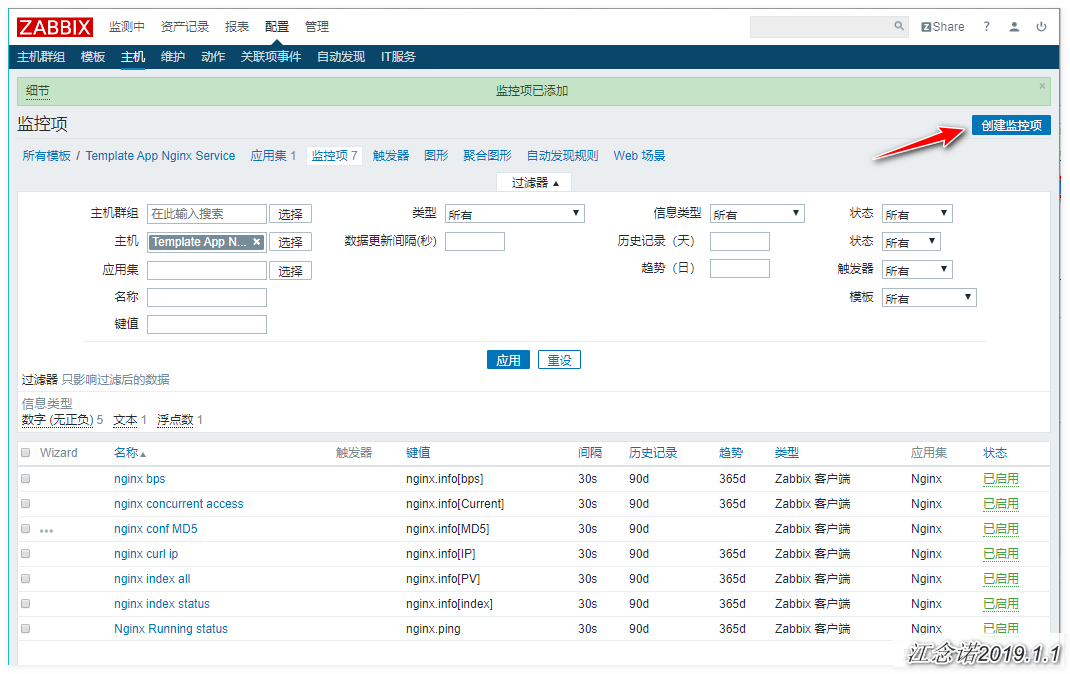
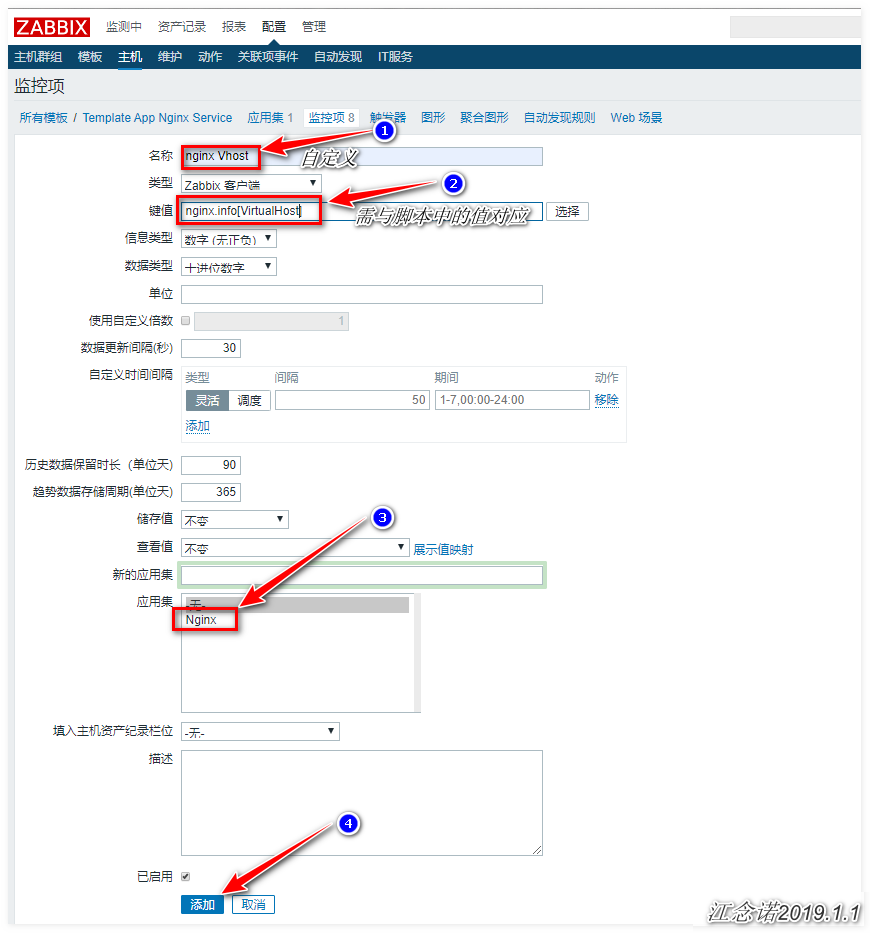
Monitor the number of nginx virtual hosts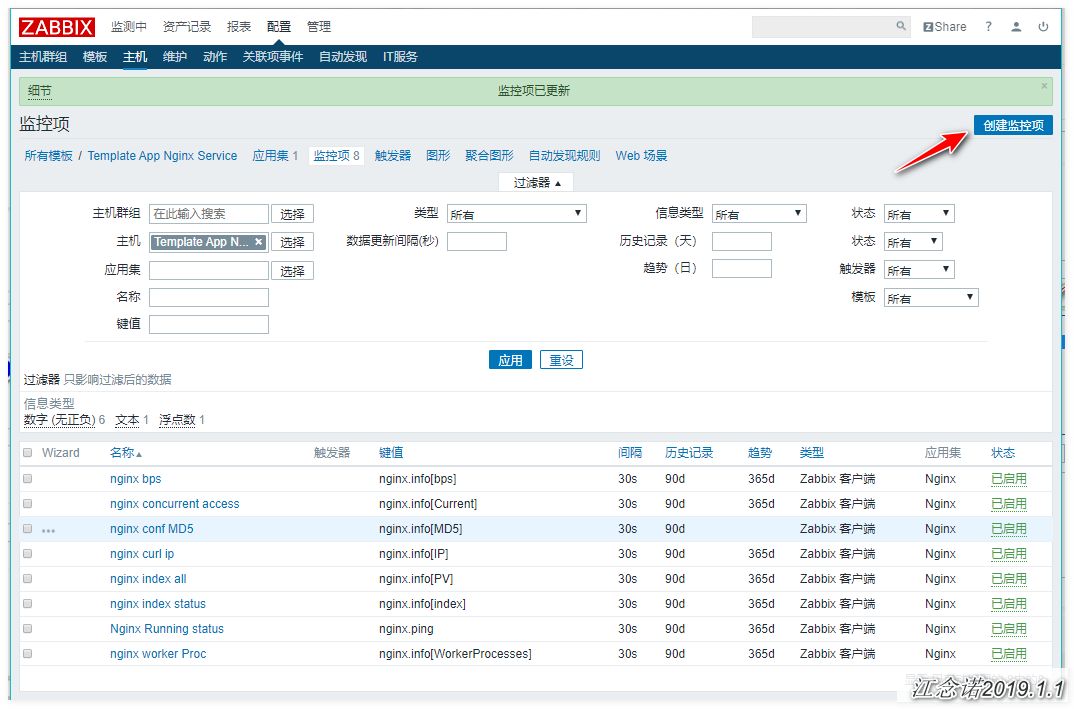
3) Create trigger
nginx service unexpected stop work trigger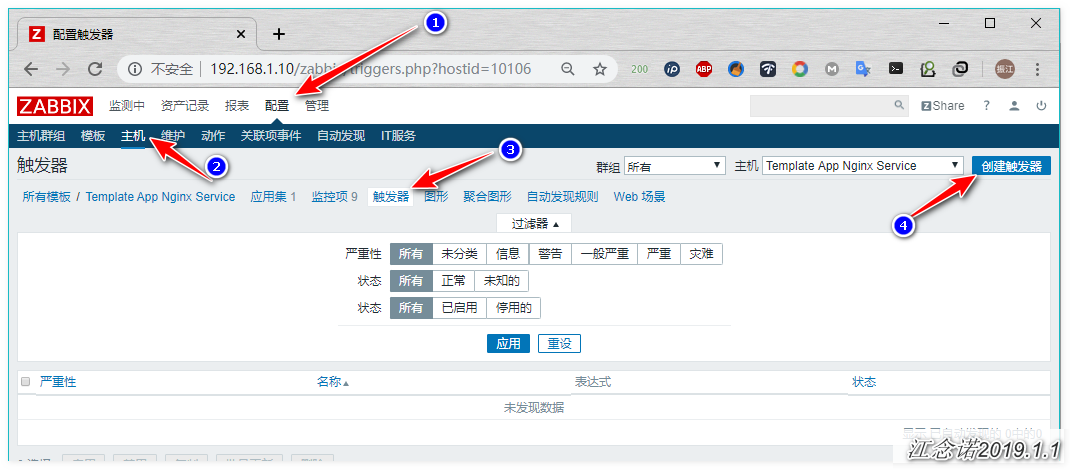
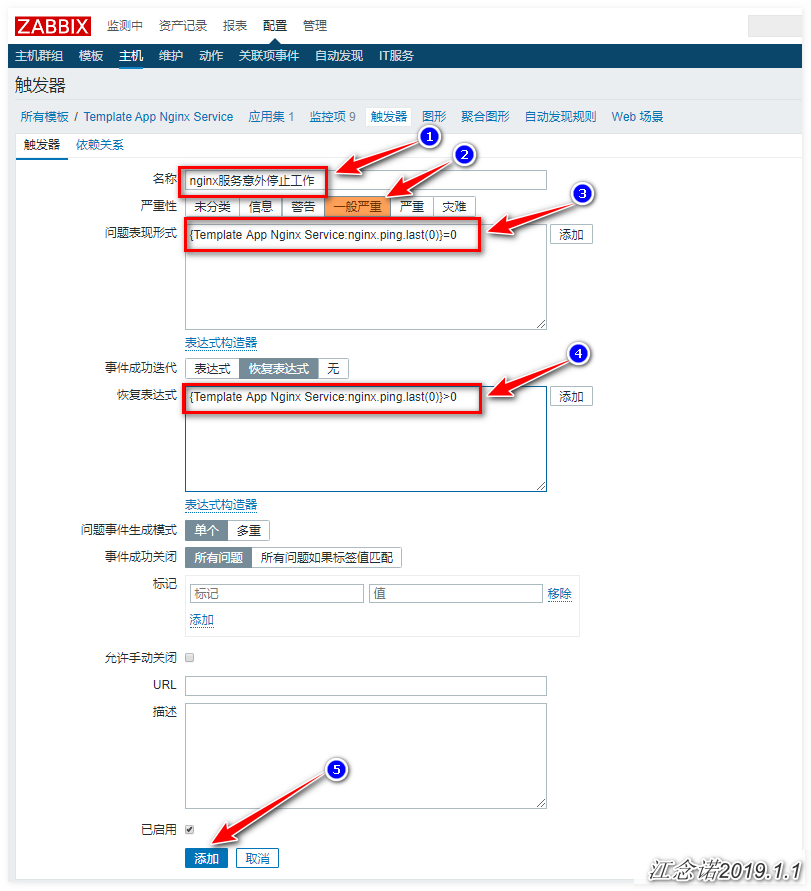
Expression authoring specification:
{Template App Nginx Service:nginx.ping.last(0)} = 0
Template App Nginx Service  Template name
nginx.ping    Key name
last(0)       Method: represents the current..  last(1)Indicates last..
Create triggers that are not accessible to the Nginx home page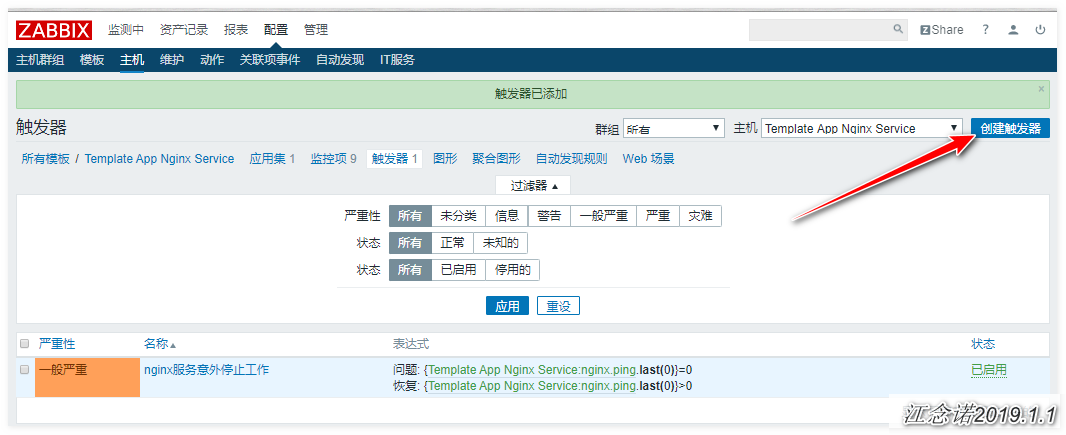
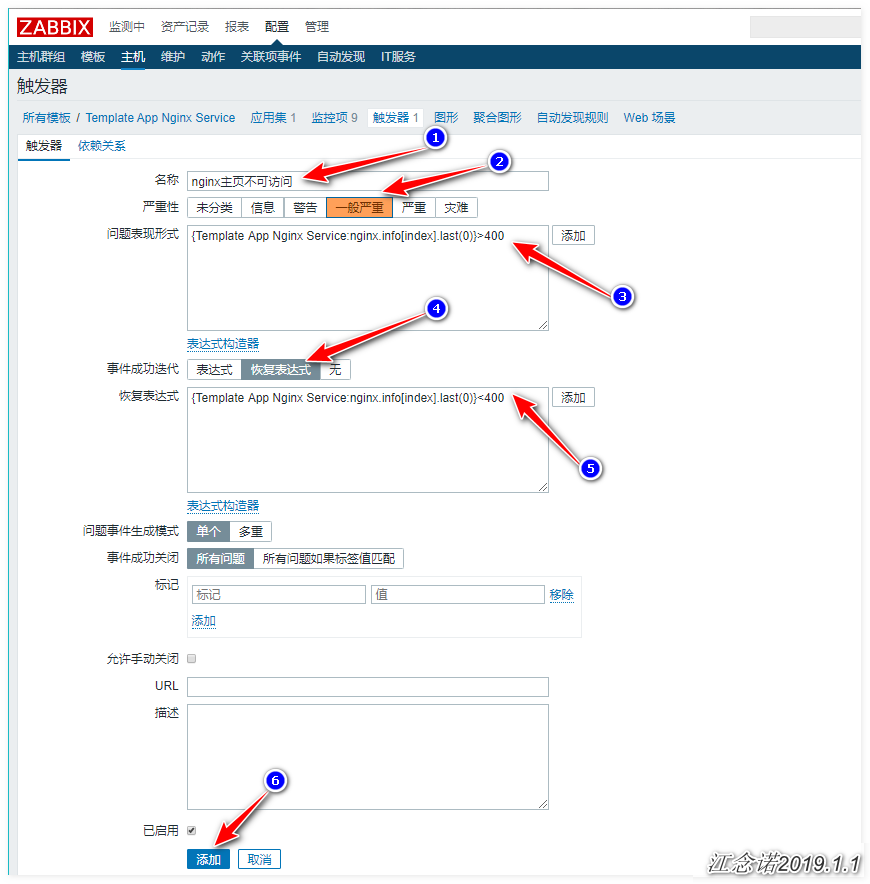
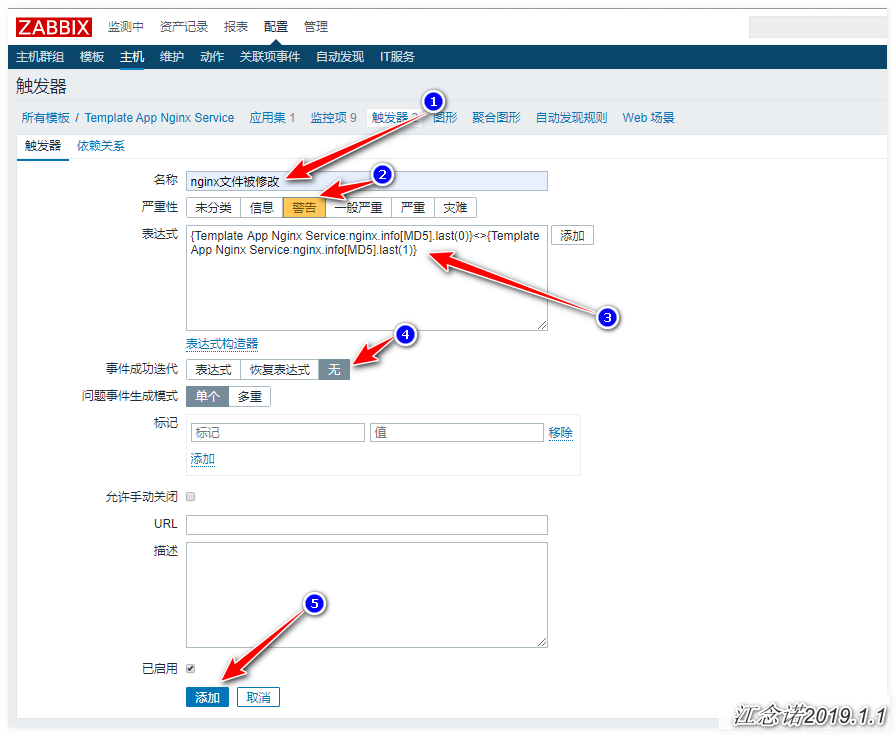
Trigger to create Nginx configuration file modified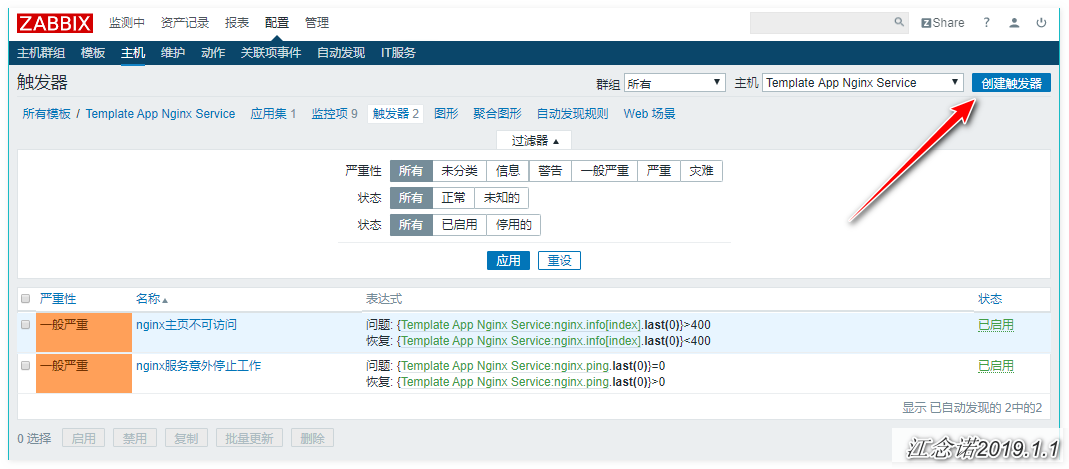
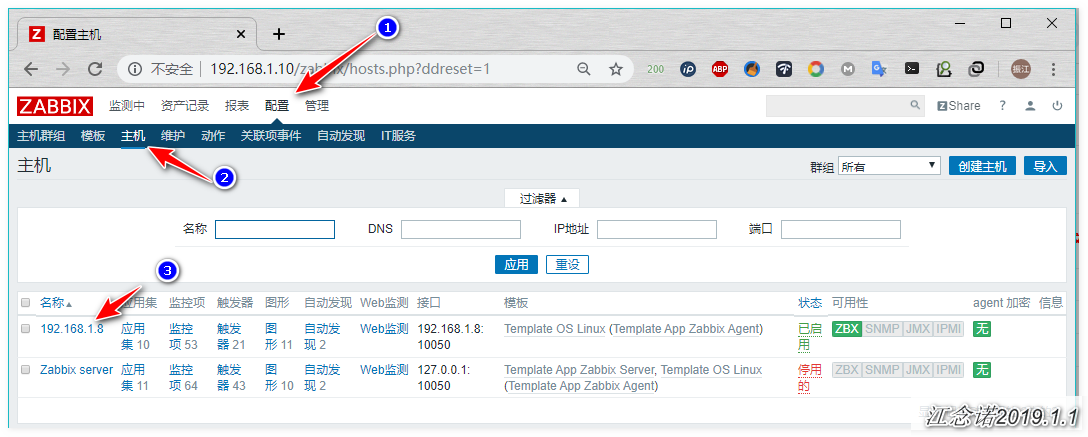
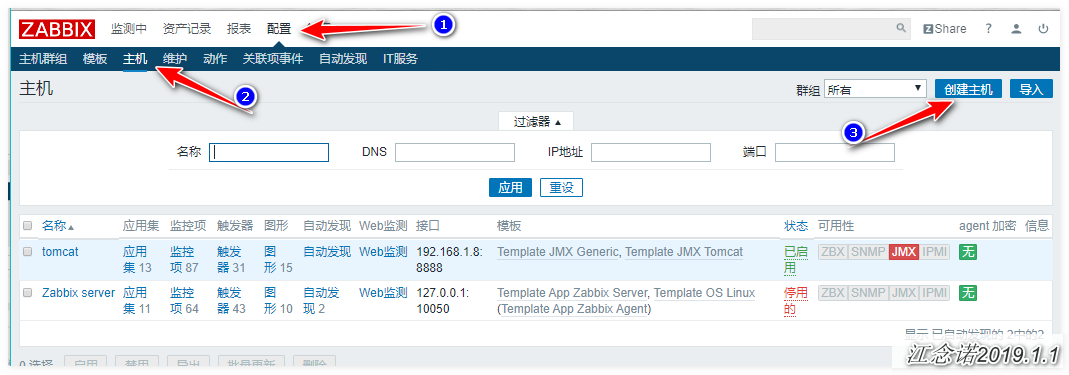
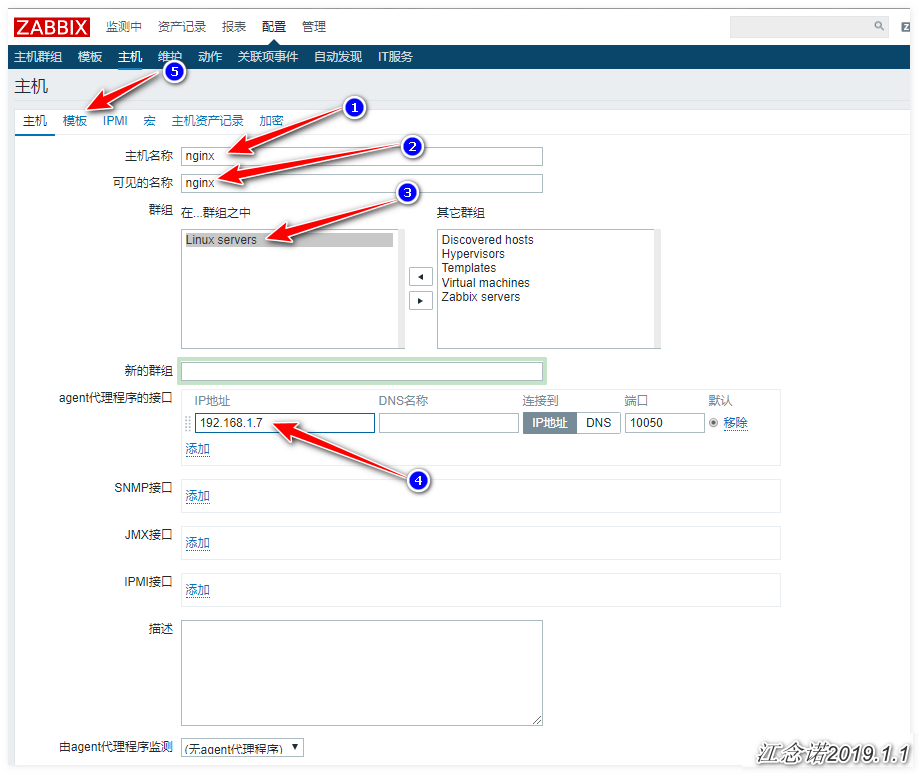
4) Add monitored host
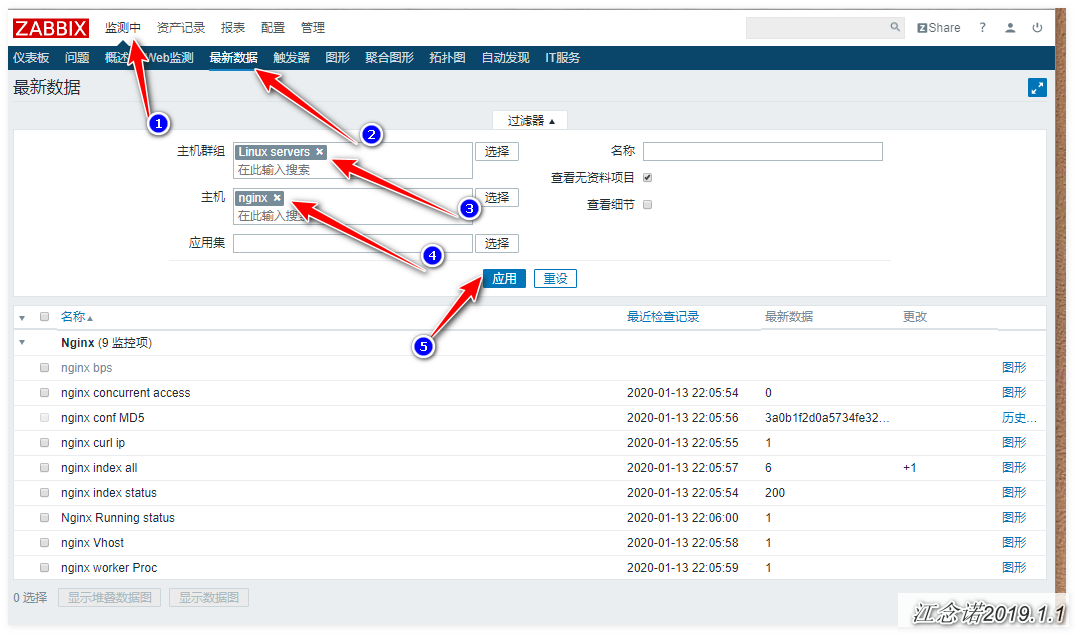
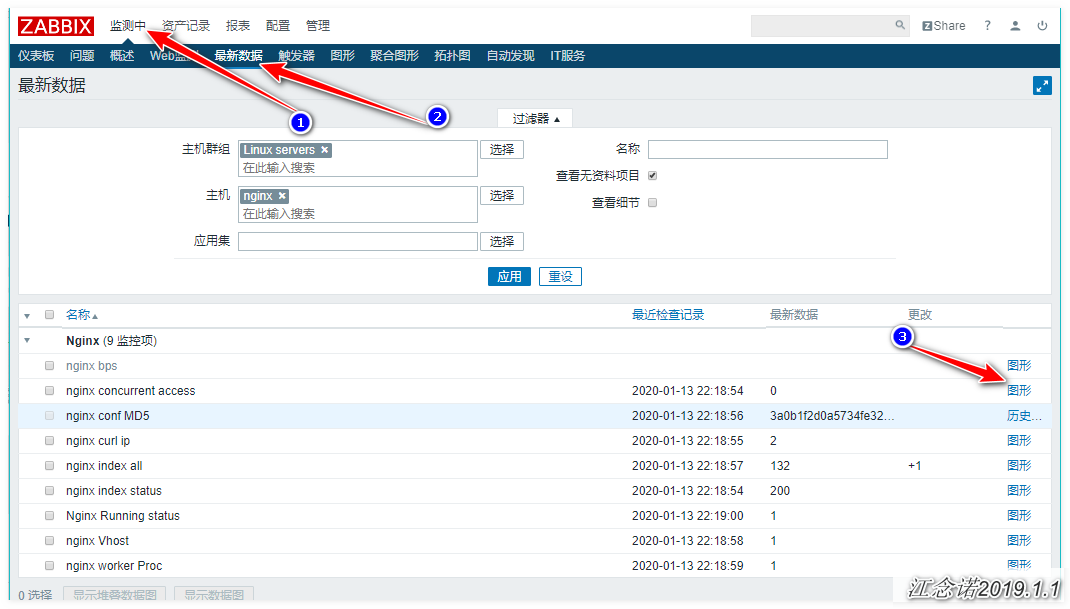
5) View data monitored by zabbix
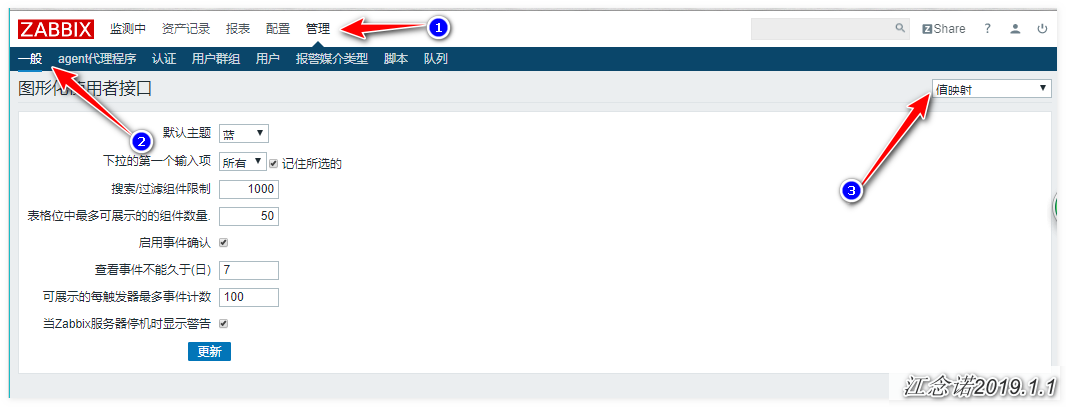
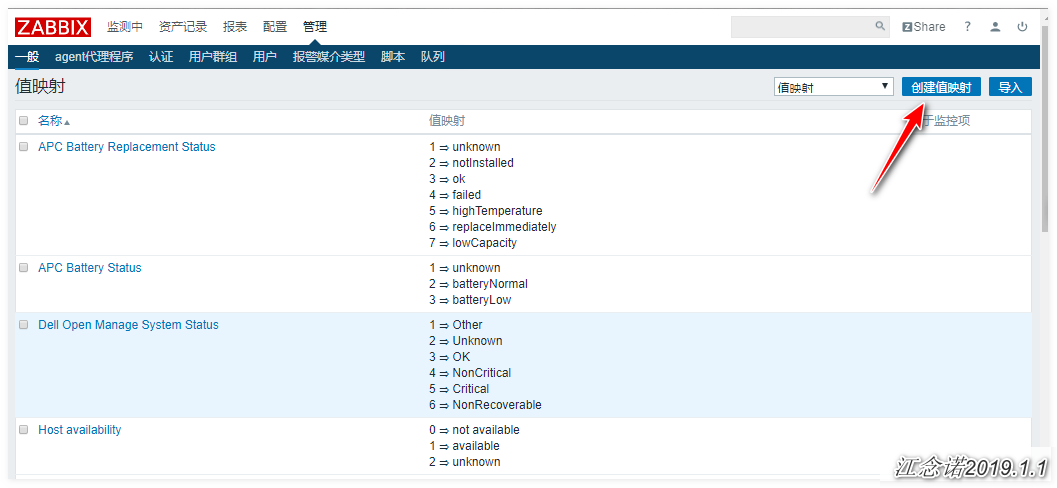
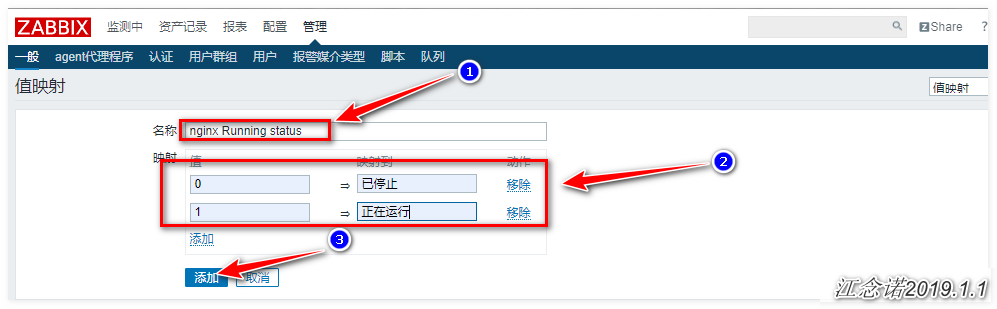
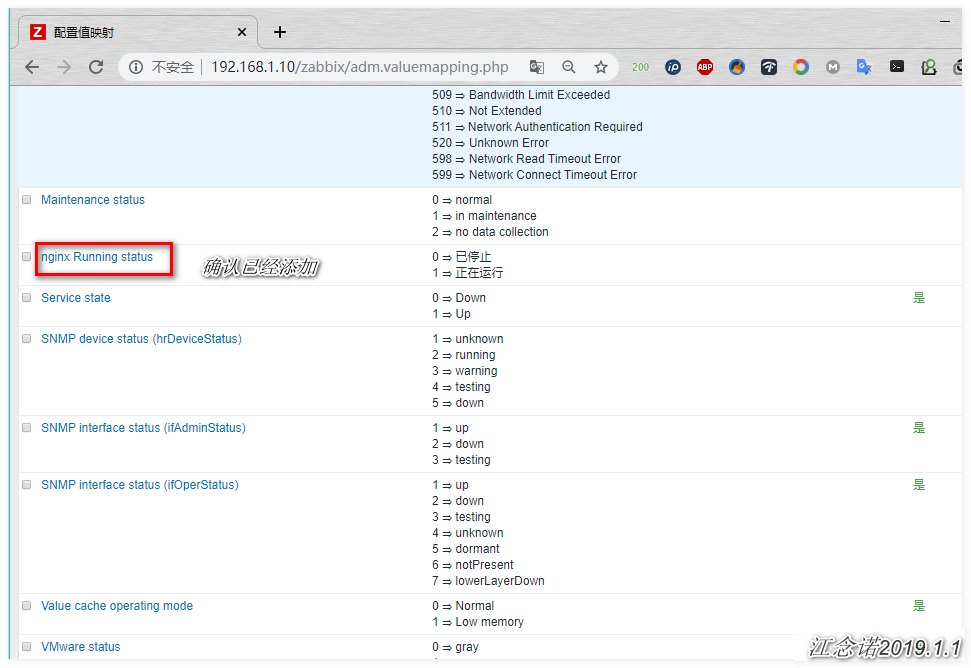
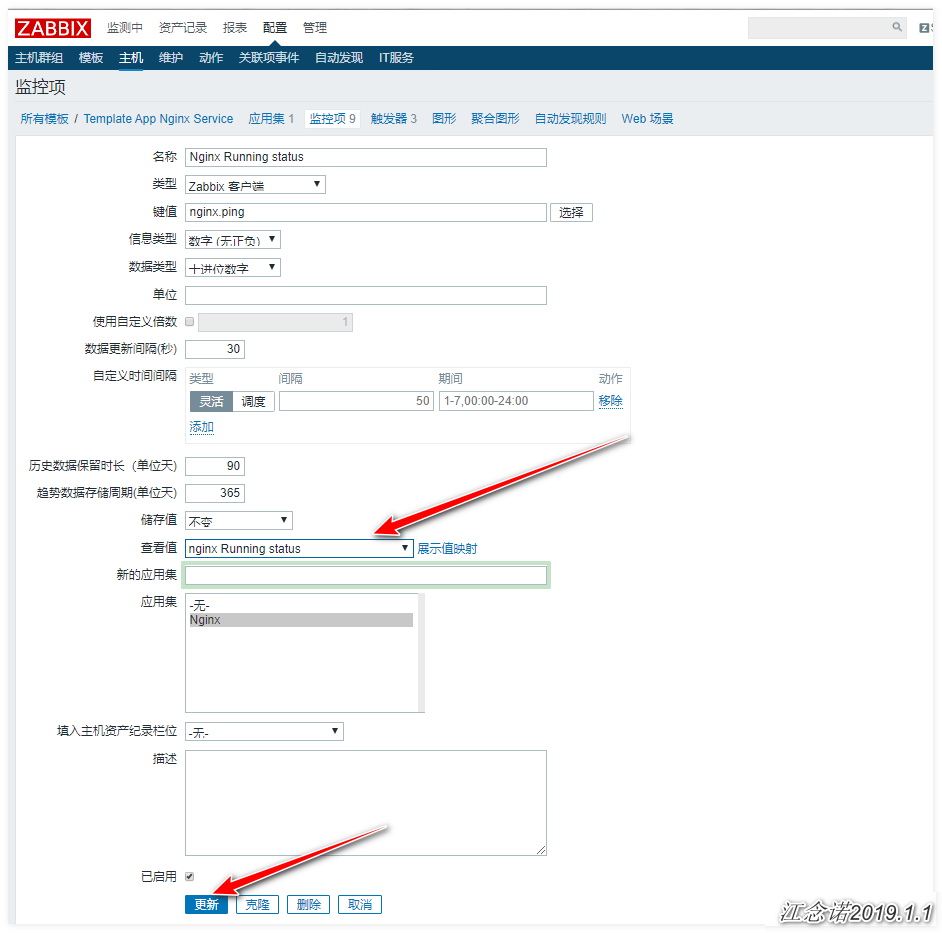
6) Add mapping to monitor nginx state
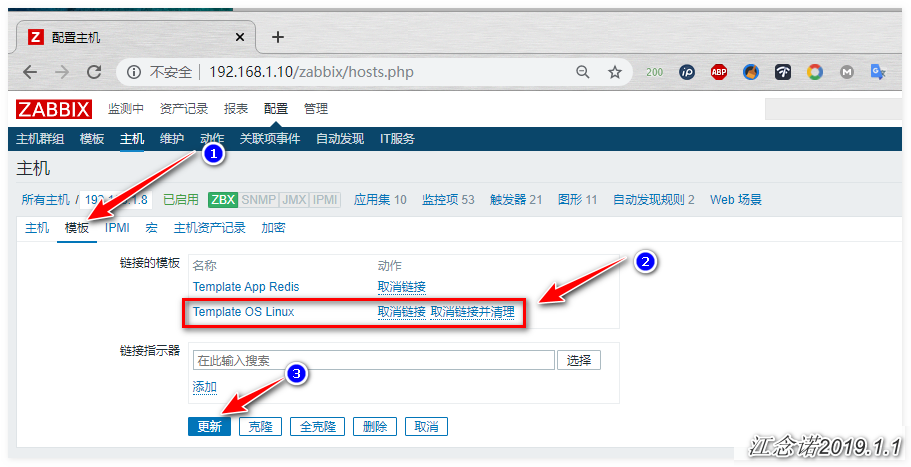
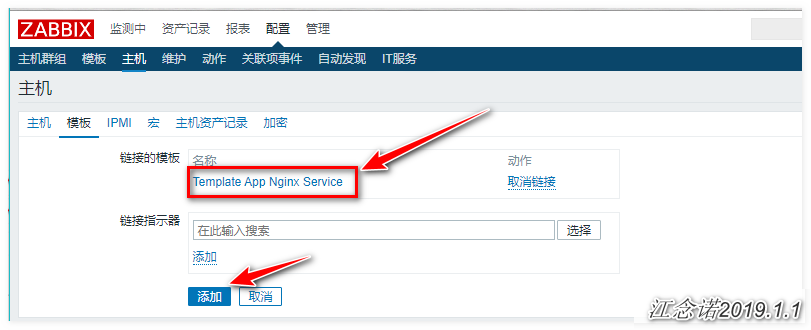
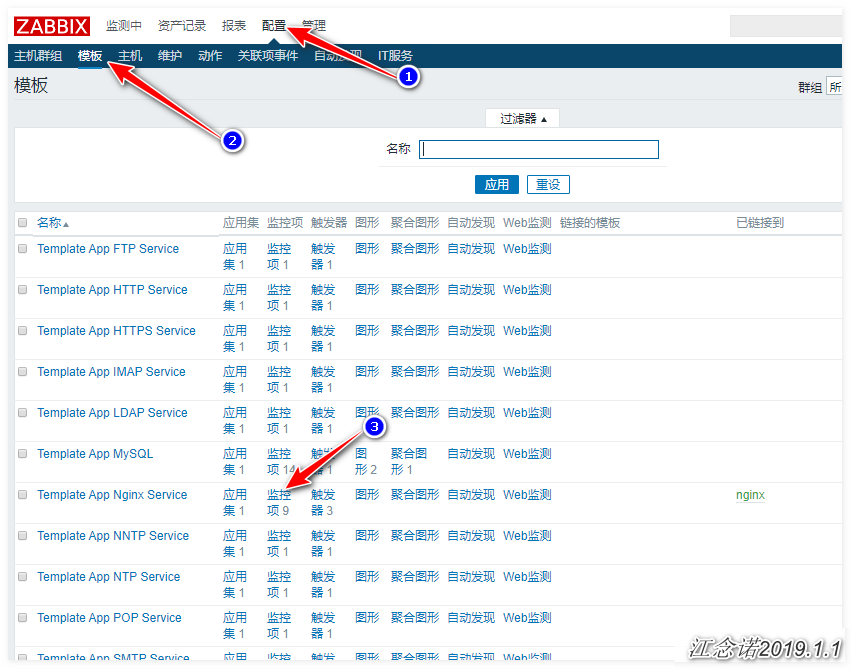
7) Associated to monitor item
[root@zabbix ~]# yum -y install httpd-tools
[root@zabbix ~]# ab -n 100 -c 100 http://192.168.1.7/index.html
//Simulated concurrent
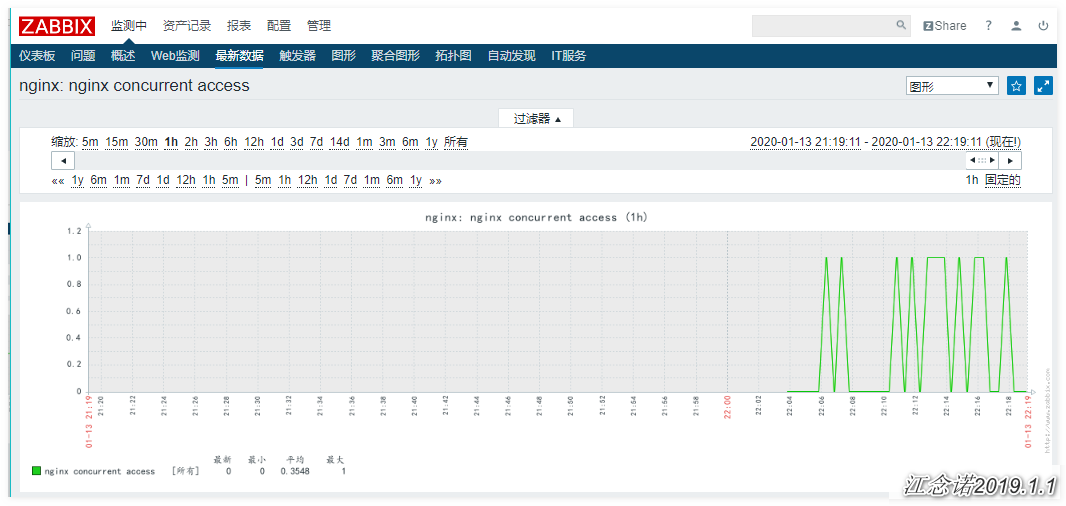
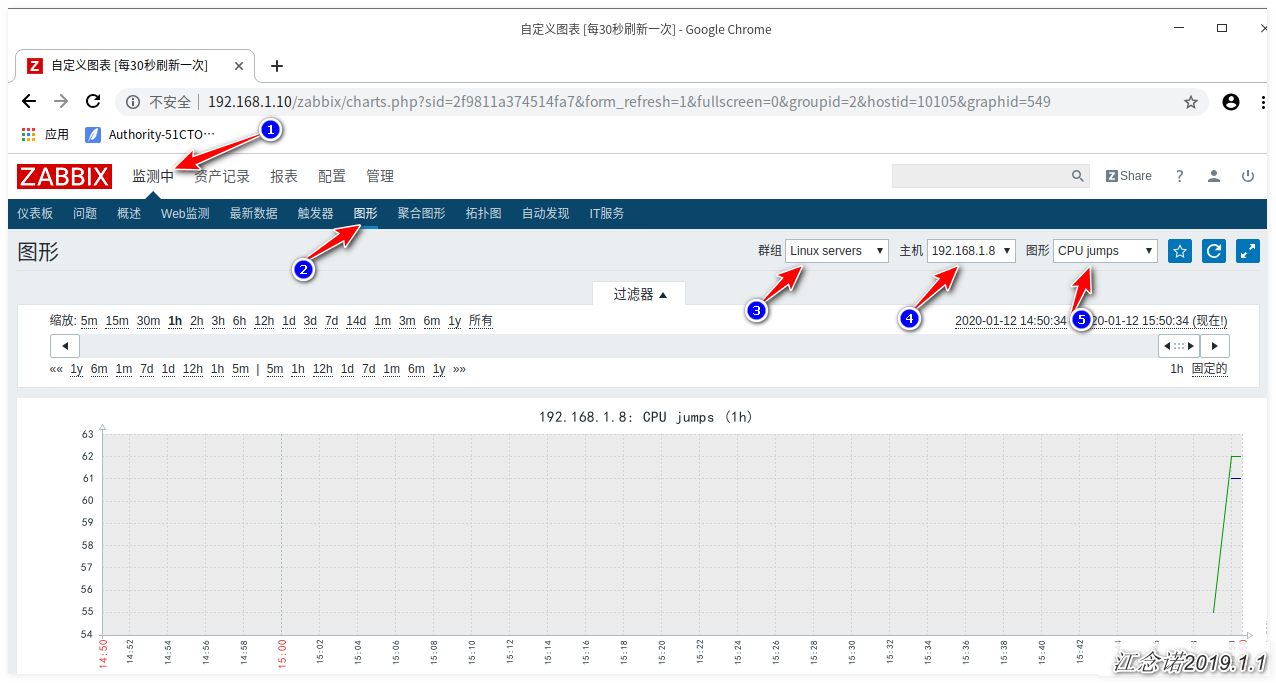
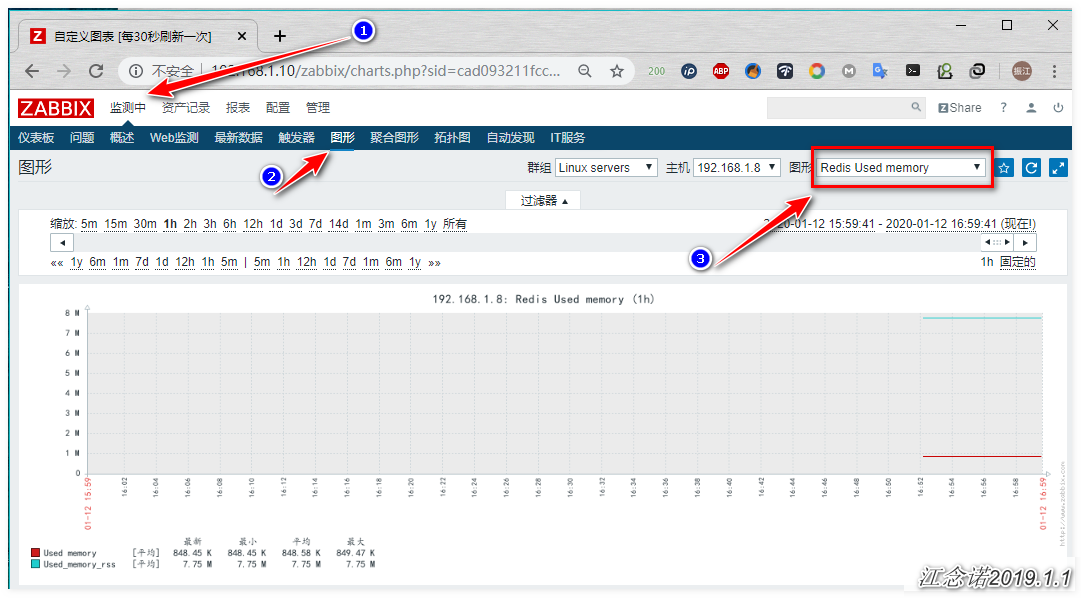
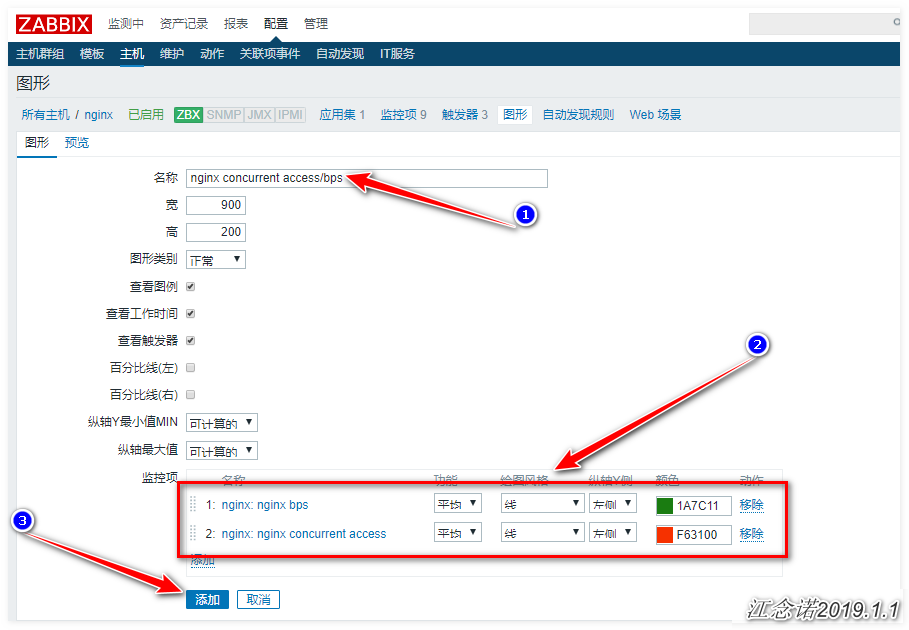
You can also customize the chart as follows: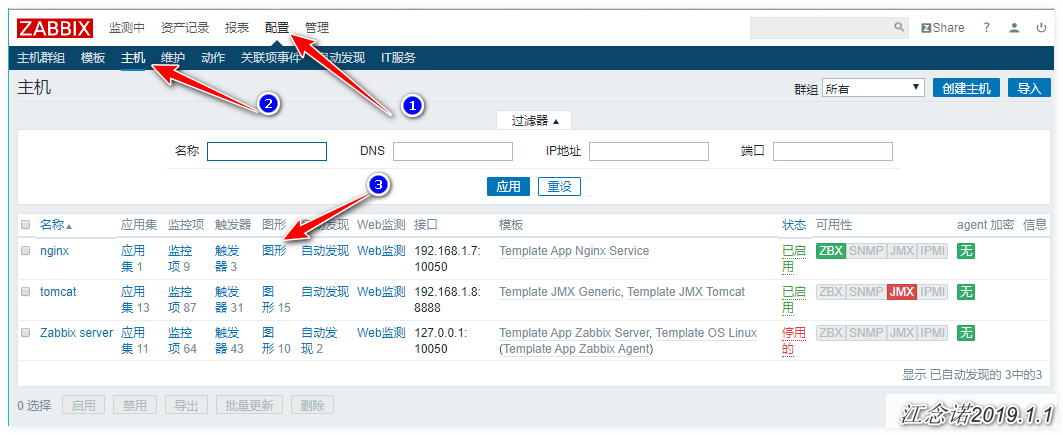

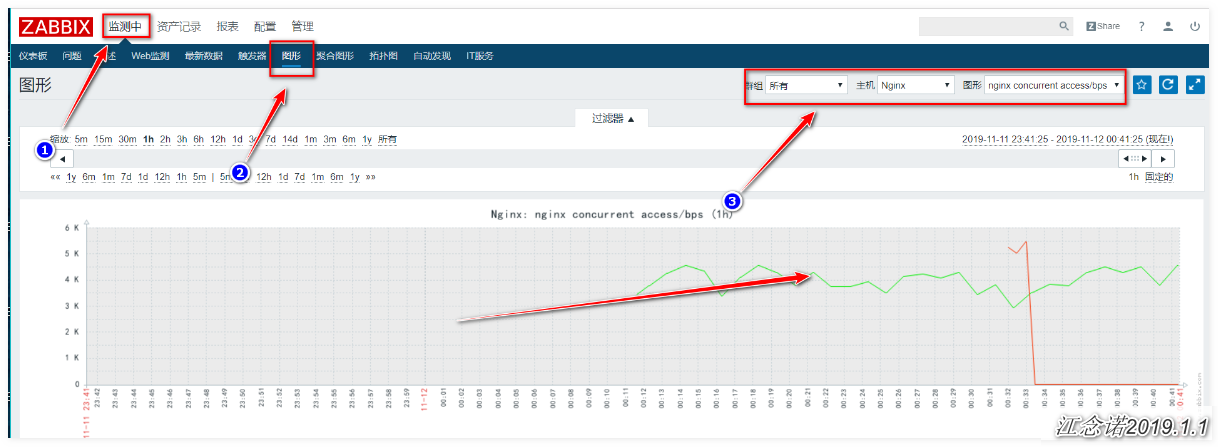
Monitoring nginx succeeded!
——————————————Thank you for reading——————————————————