1, Monitoring Linux TCP connection status
1.1 script for monitoring TCP connections
The script needs to be placed on the corresponding ZABBIX agent server
root@web1:~# vim /etc/zabbix/zabbix_agentd.conf.d/tcp_conn_plugin.sh
#!/bin/bash
tcp_conn_status(){
        TCP_STAT=$1
        ss -ant | awk 'NR>1 {++s[$1]} END {for(k in s) print k,s[k]}' > /tmp/tcp_conn.txt
        TCP_NUM=$(grep "$TCP_STAT" /tmp/tcp_conn.txt | cut -d ' ' -f2)
        if [ -z $TCP_NUM ];then
                TCP_NUM=0
                fi
                echo $TCP_NUM
}
main(){
        case $1 in
            tcp_status)
                tcp_conn_status $2;
                ;;
        esac
}
main $1 $2

#Add execution permission
root@web1:~# chmod a+x /etc/zabbix/zabbix_agentd.conf.d/tcp_conn_plugin.sh
1.2 adding user-defined monitoring items to ZABBIX agent
zabbix agent adds a user-defined monitoring item and calls the script to obtain the monitoring item data
root@web1:~# vim /etc/zabbix/zabbix_agentd.conf
#Add the following configuration
UserParameter=linux_status[*],/etc/zabbix/zabbix_agentd.conf.d/tcp_conn_plugin.sh "$1" "$2"

#Restart ZABBIX agent
root@web1:~# systemctl restart zabbix-agent.service
1.3 zabbix server test monitoring item data
root@zabbix-server:~# /apps/zabbix_server/bin/zabbix_get -s 10.10.100.105 -k "linux_status["tcp_status","LISTEN"]"
12
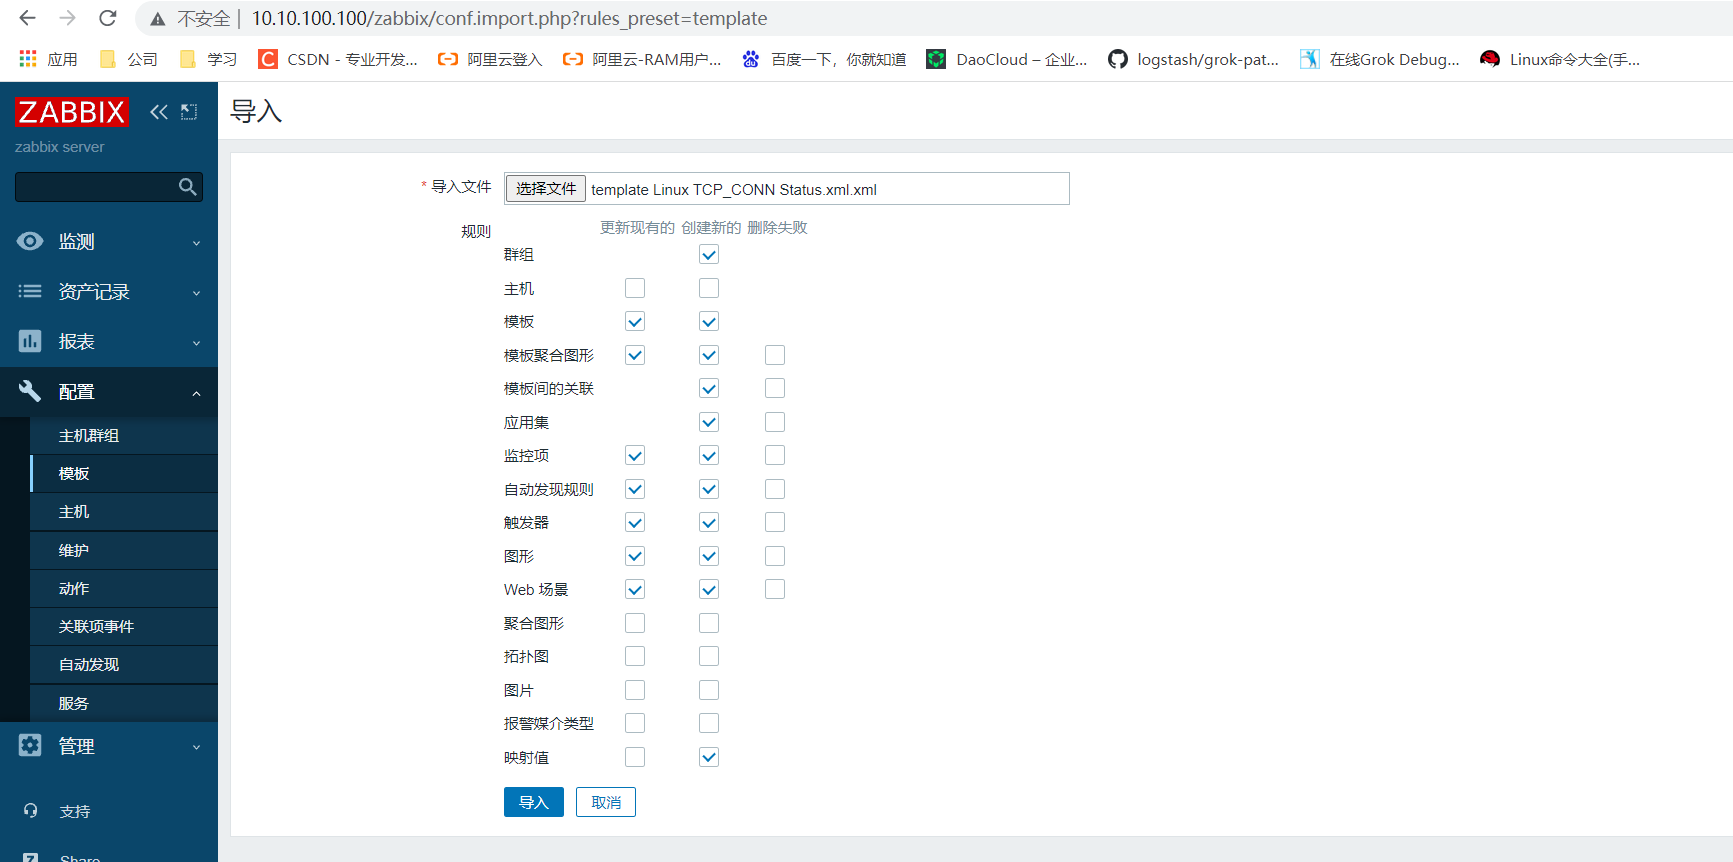
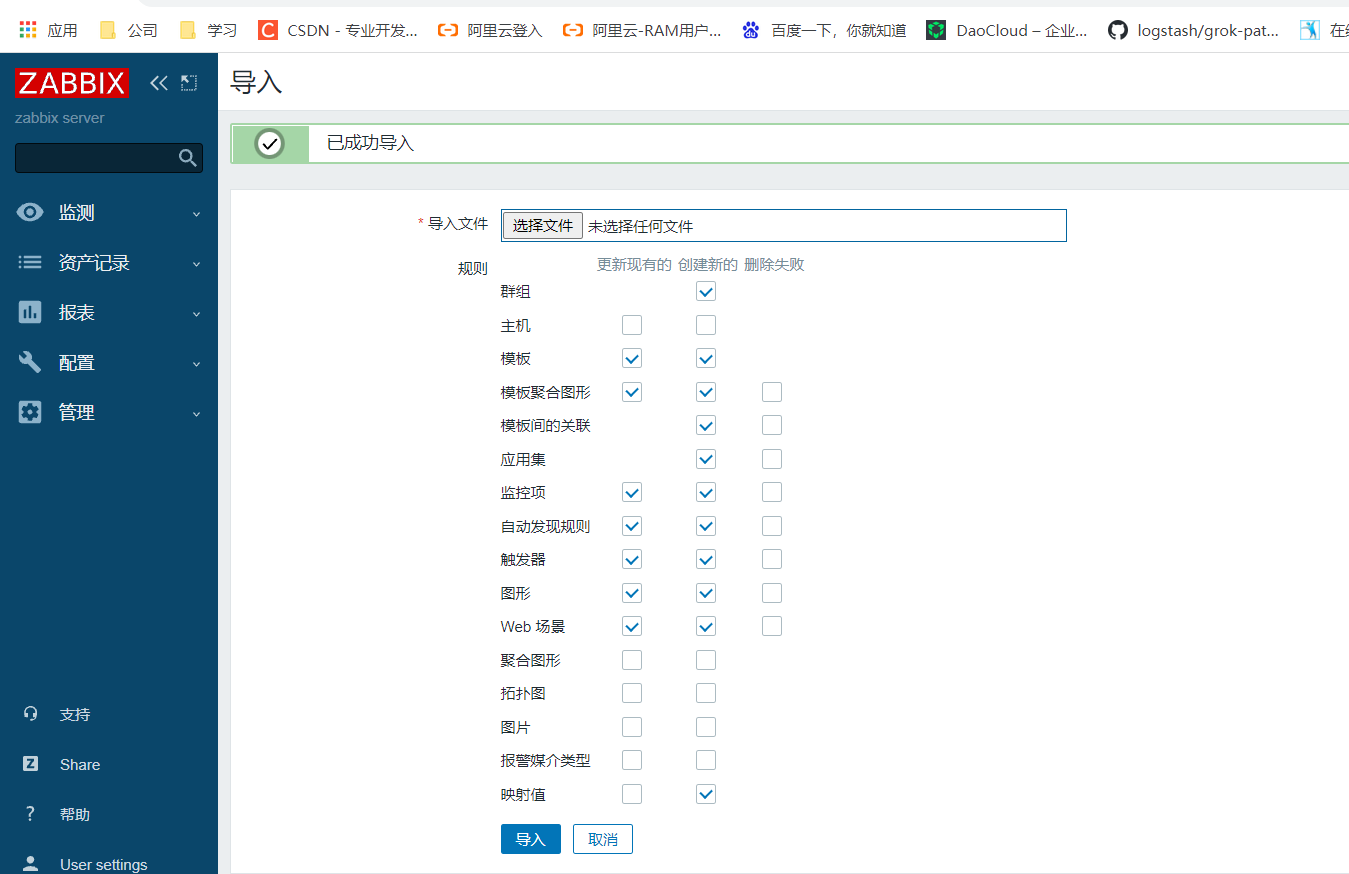
1.4 zabbix web import template
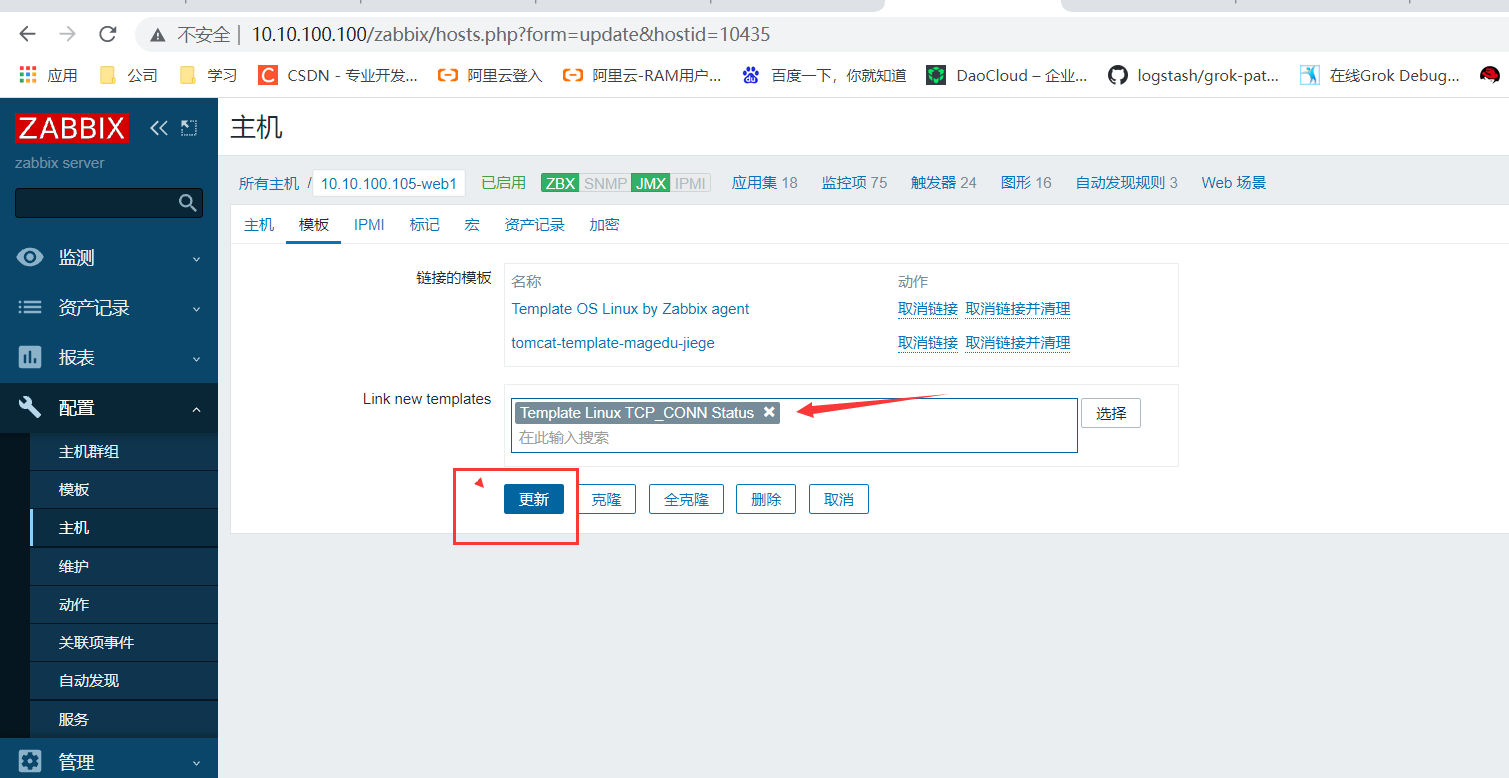
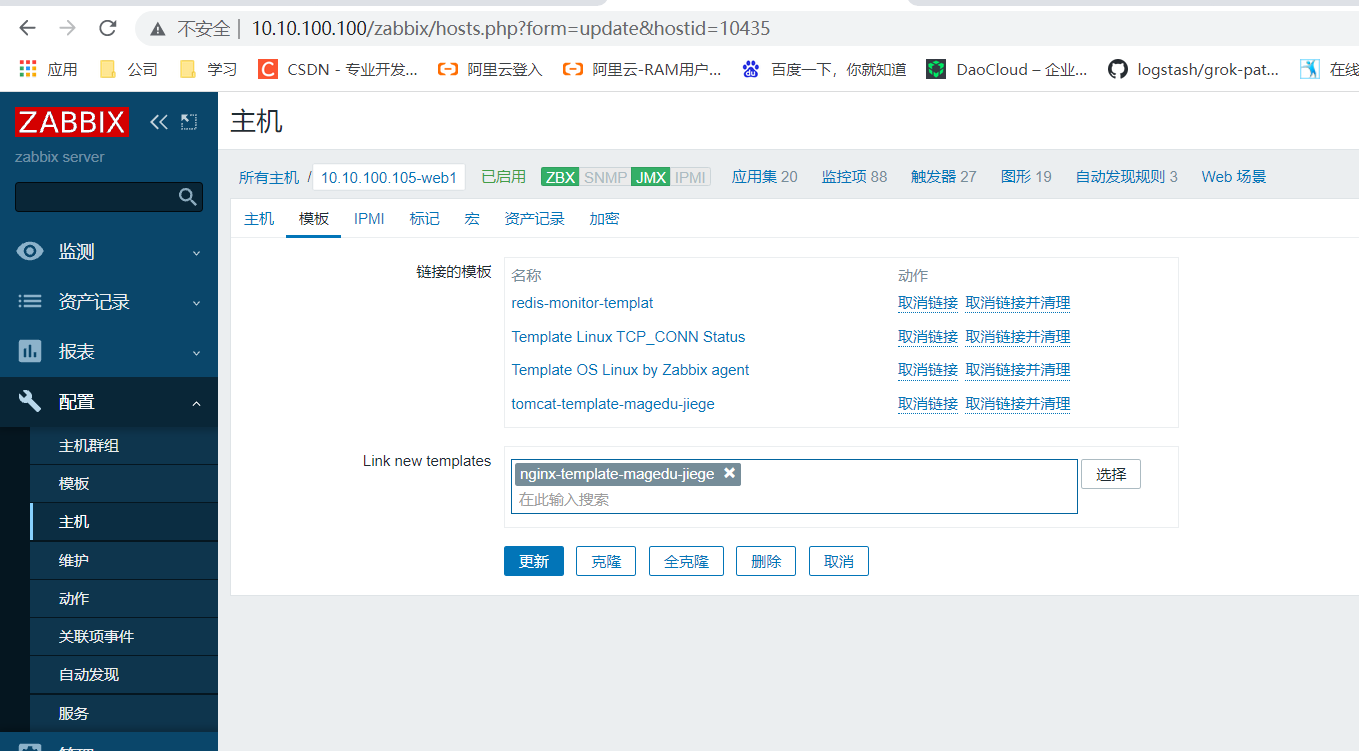
1.5 associating templates to hosts
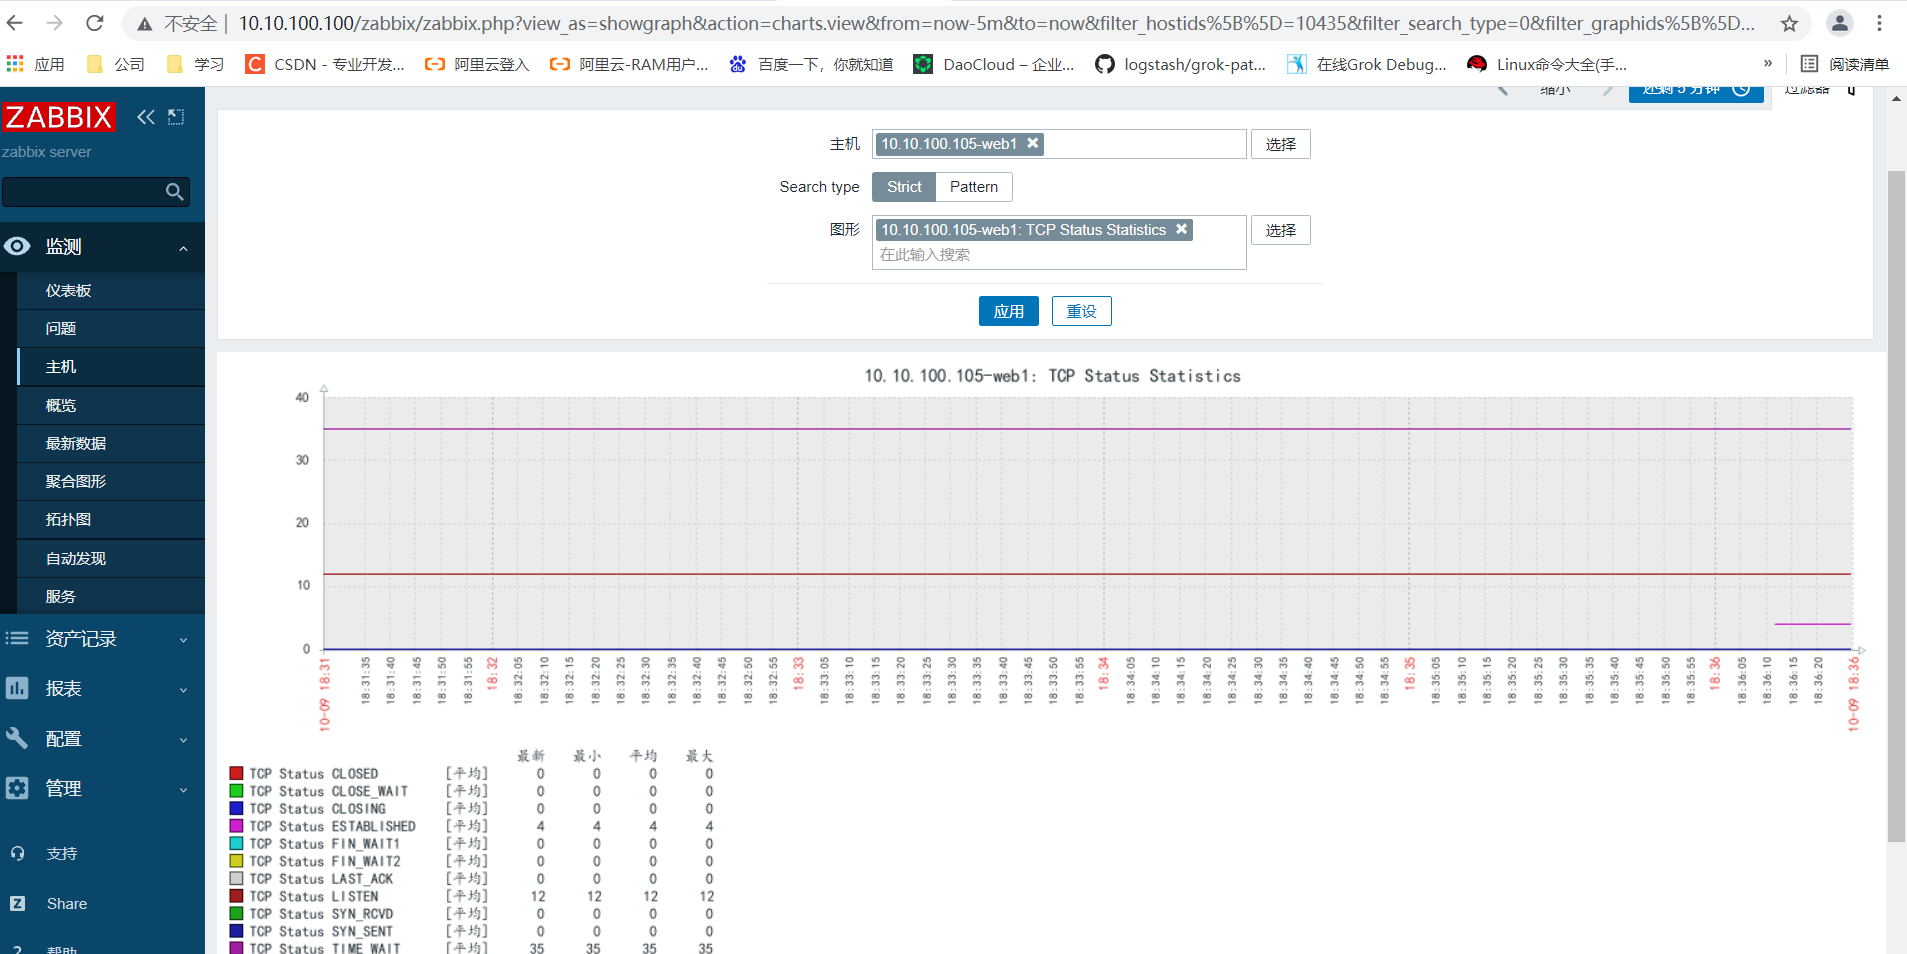
1.6 viewing monitoring data
2, Monitor Redis
2.1 installing redis
root@web1:~# apt install redis
root@web1:~# vim /etc/redis/redis.conf
root@web1:~# systemctl start redis
2.2 monitoring script
root@web1:~# vim /etc/zabbix/zabbix_agentd.conf.d/redis_monitor.sh
#!/bin/bash
redis_status(){
        R_PORT=$1
        R_COMMAND=$2
        (echo -en "INFO \r\n";sleep 1;) | ncat 127.0.0.1 "$R_PORT" > /tmp/redis_"$R_PORT".tmp
        REDIS_STAT_VALUE=$(grep ""$R_COMMAND":" /tmp/redis_"$R_PORT".tmp | cut -d ':' -f2)
        echo $REDIS_STAT_VALUE
}
help(){
        echo "${0} + redis_status + PORT + COMMAND"
}
main(){
        case $1 in
            redis_status)
                redis_status $2 $3
                ;;
            *)
                help
                ;;
        esac
}
main $1 $2 $3

root@web1:~# chmod a+x /etc/zabbix/zabbix_agentd.conf.d/redis_monitor.sh

#The ncat command used by the installation script is required
root@web1:~# apt install nmap
2.3 adding user-defined monitoring items to ZABBIX agent
root@web1:~# vim /etc/zabbix/zabbix_agentd.conf
UserParameter=redis_status[*],/etc/zabbix/zabbix_agentd.conf.d/redis_monitor.sh "$1" "$2" "$3"

root@web1:~# systemctl restart zabbix-agent.service
2.4 zabbix server test monitoring item data
root@zabbix-server:~# /apps/zabbix_server/bin/zabbix_get -s 10.10.100.105 -k "redis_status["redis_status","6379","used_memory"]"
841272
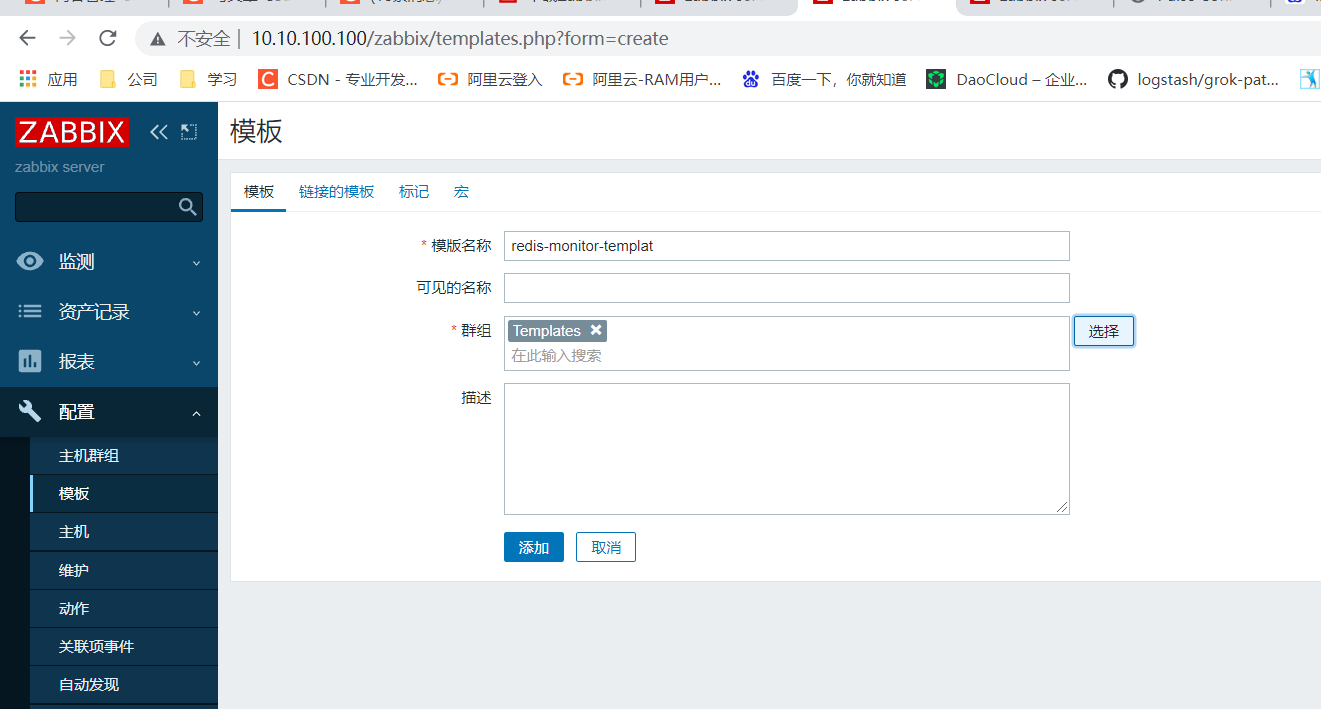
2.5 zabbix web production template
2.5.1 create template
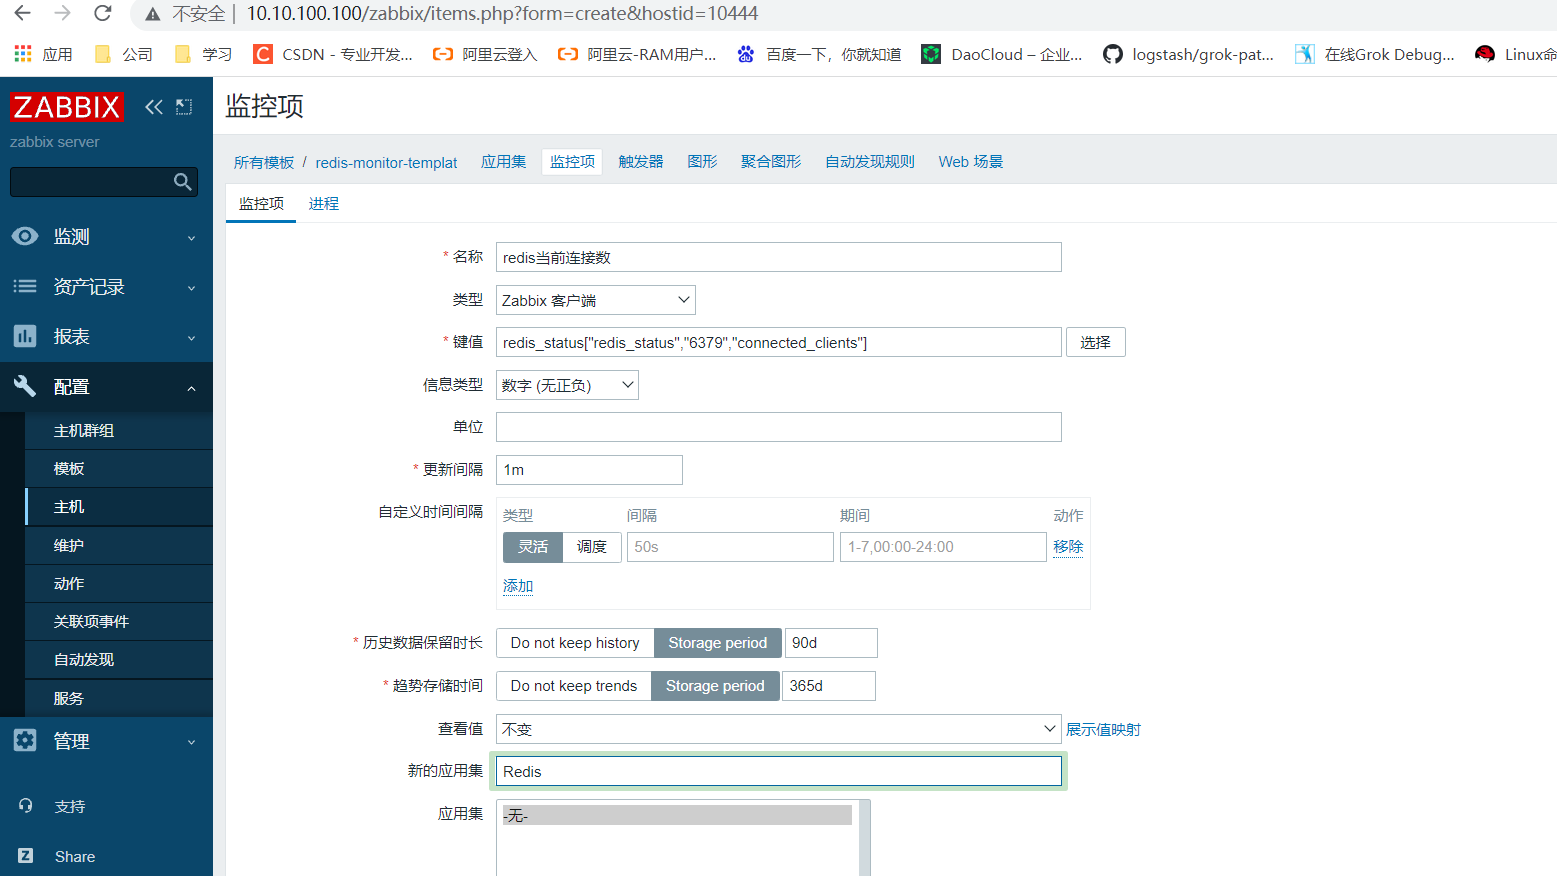
2.5.2 create monitoring item
2.5.2.1 current connections monitoring items
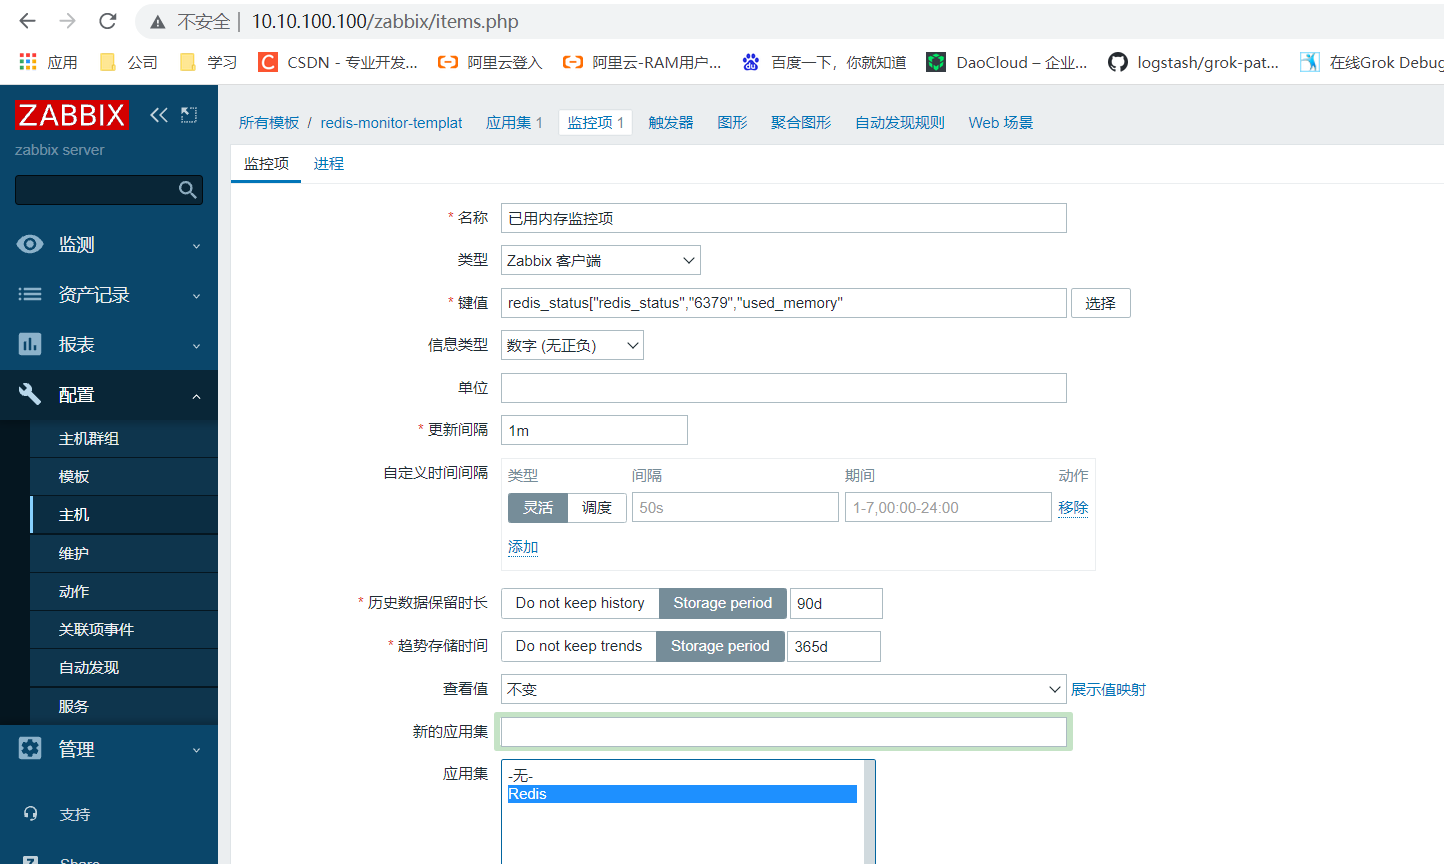
2.5.2.2 used memory monitoring items
2.5.3 create trigger
Add a trigger to the newly created redis template
2.5.3.1 current connections trigger
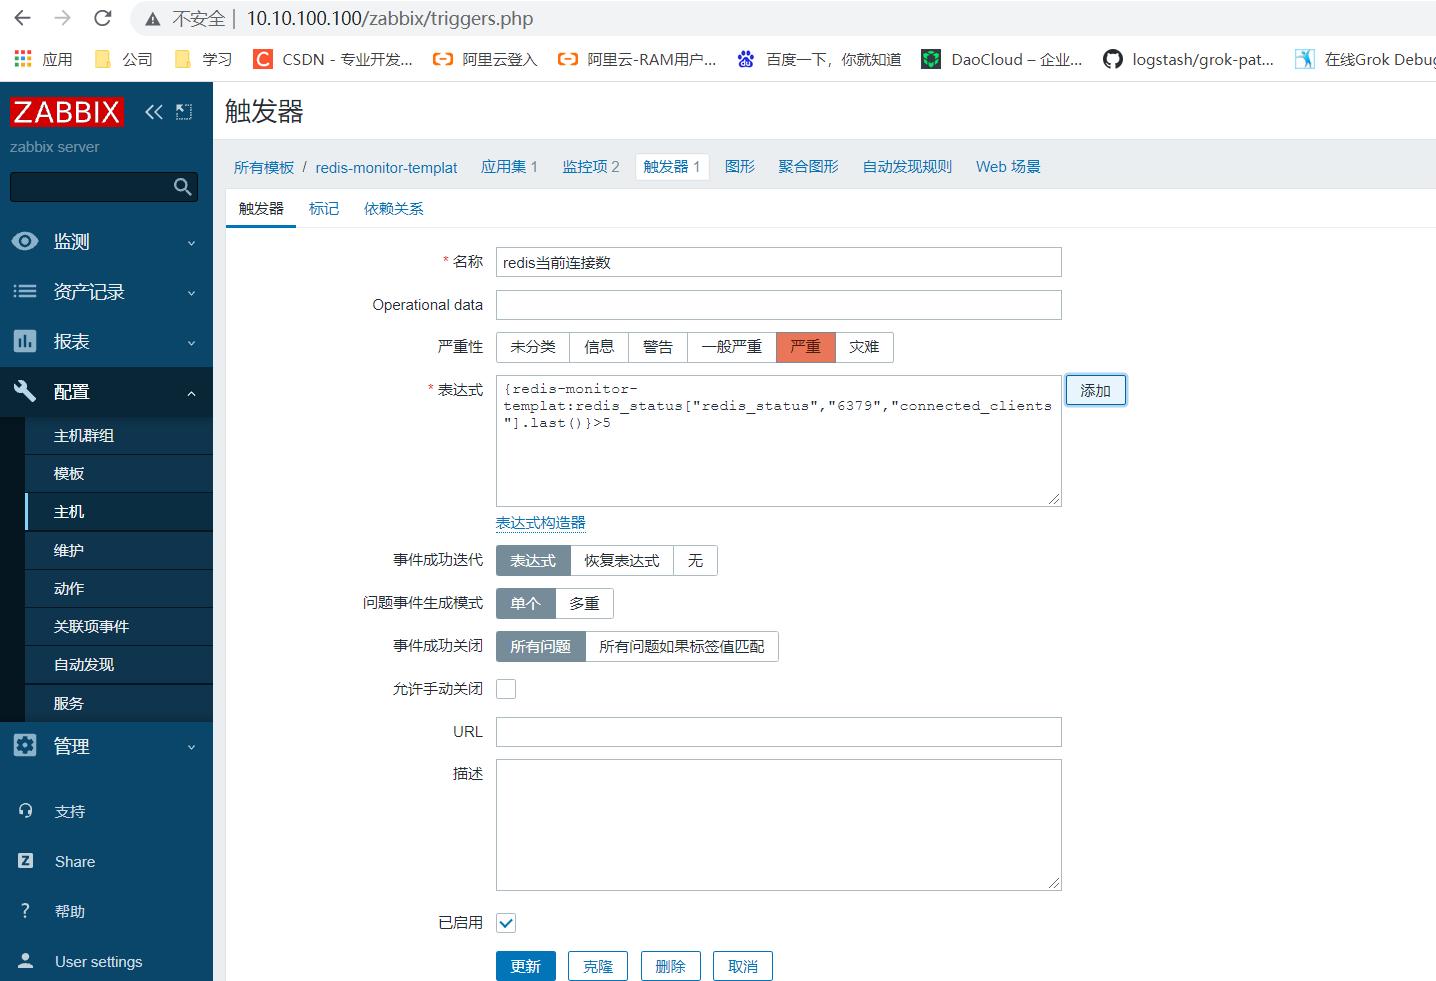
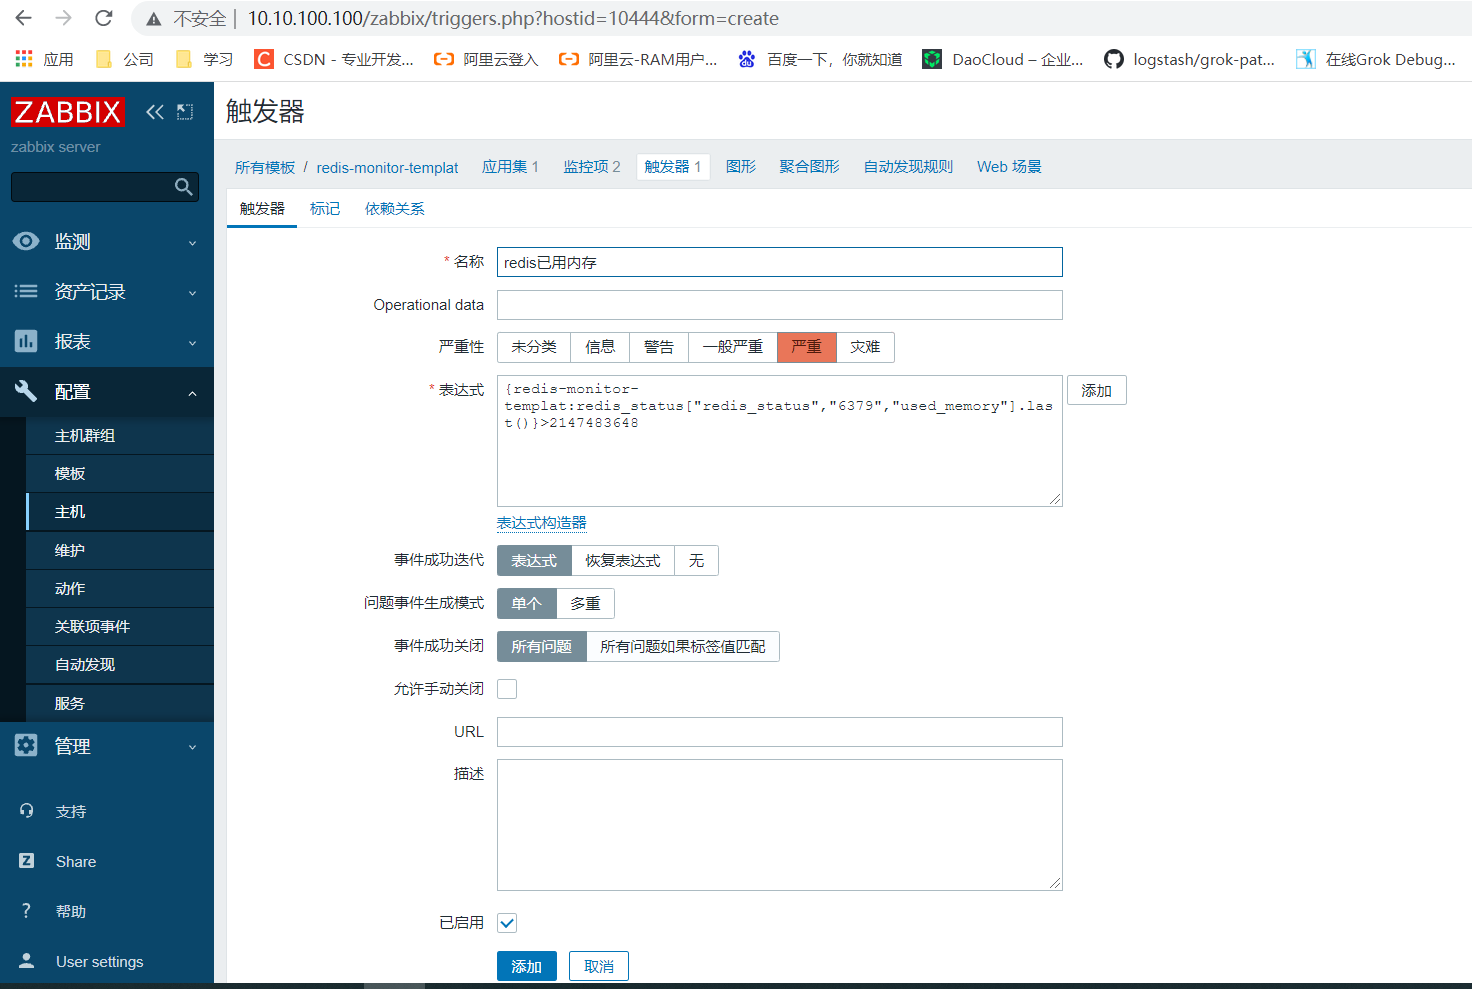
2.5.3.2 used memory trigger
The used memory unit needs to be converted from G to bytes. For example, it is triggered when the memory is used up to 2G. The conversion method is as follows:
210241024*1024
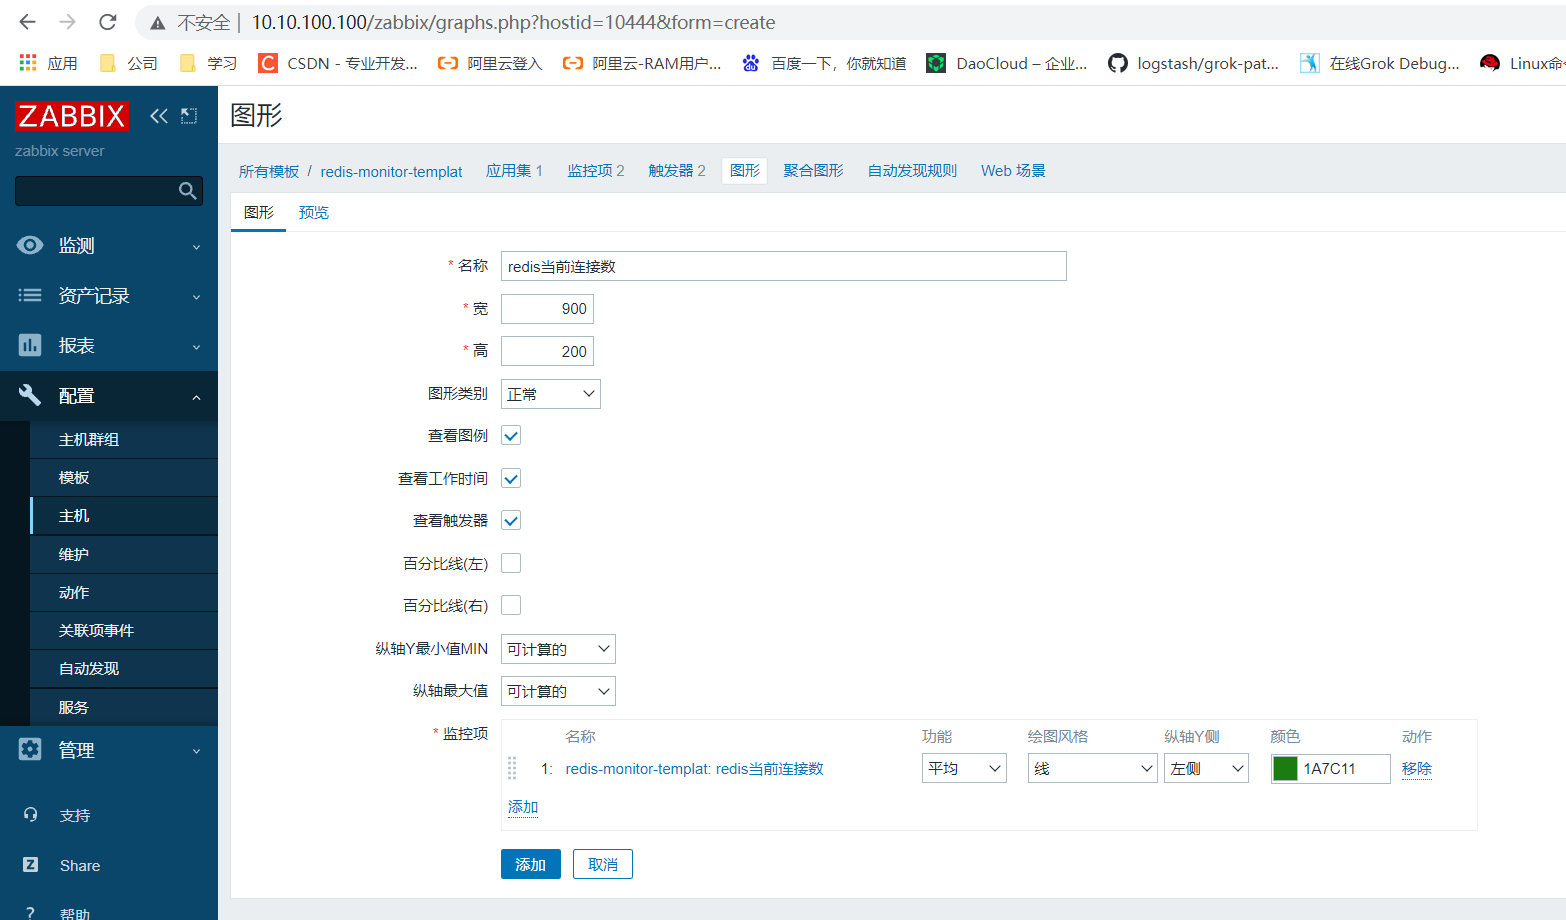
2.5.4 creating images
2.5.4.1 redis current connections image
2.5.4.2 redis used memory image
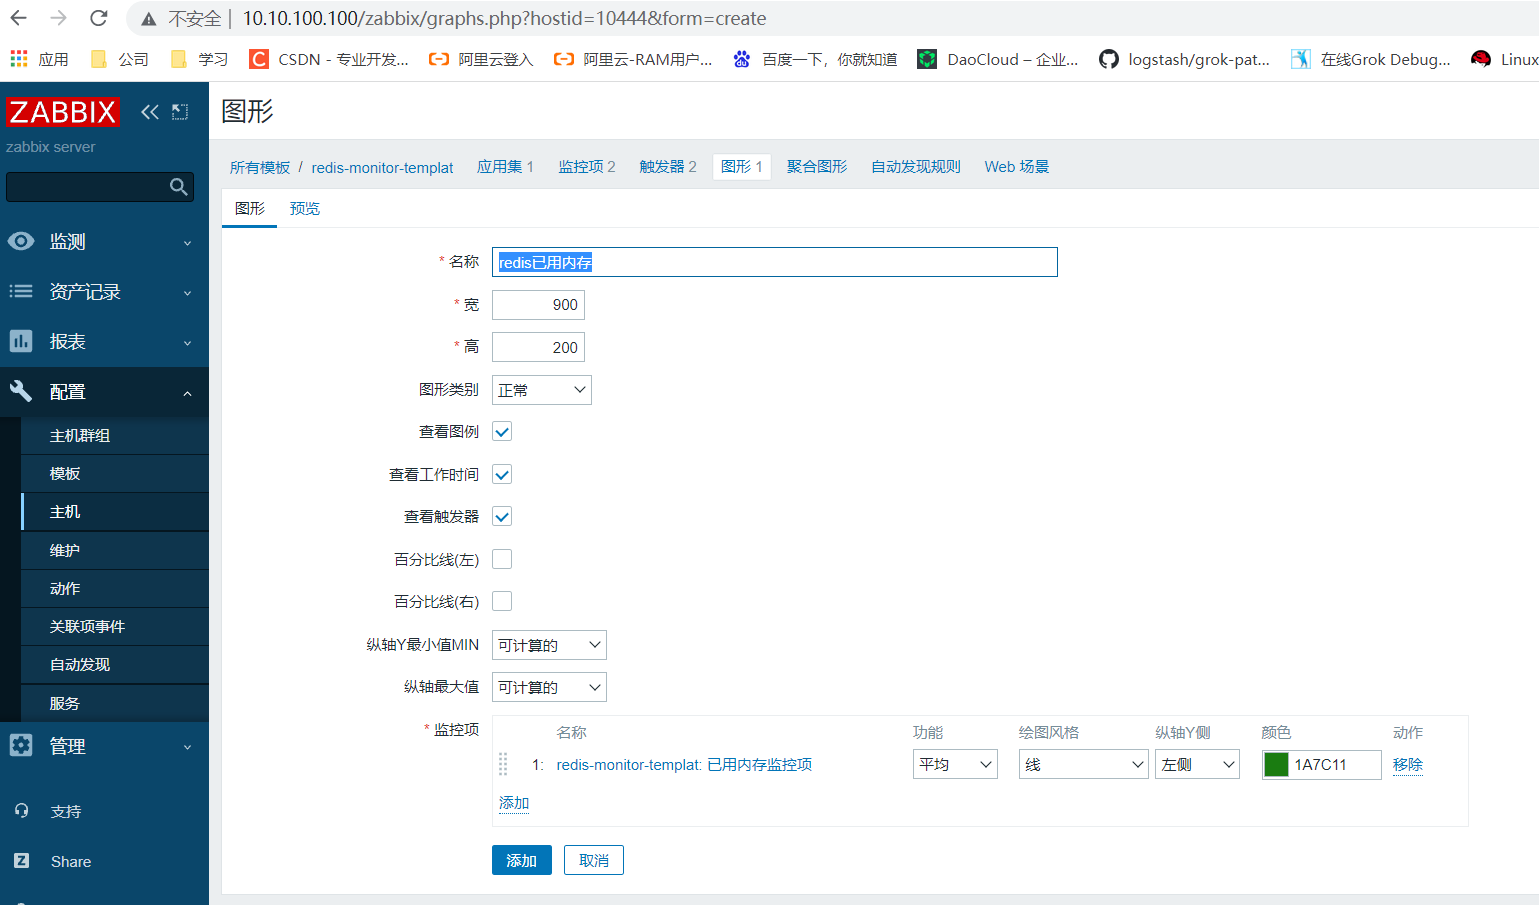
2.5.4.3 verifying viewing images
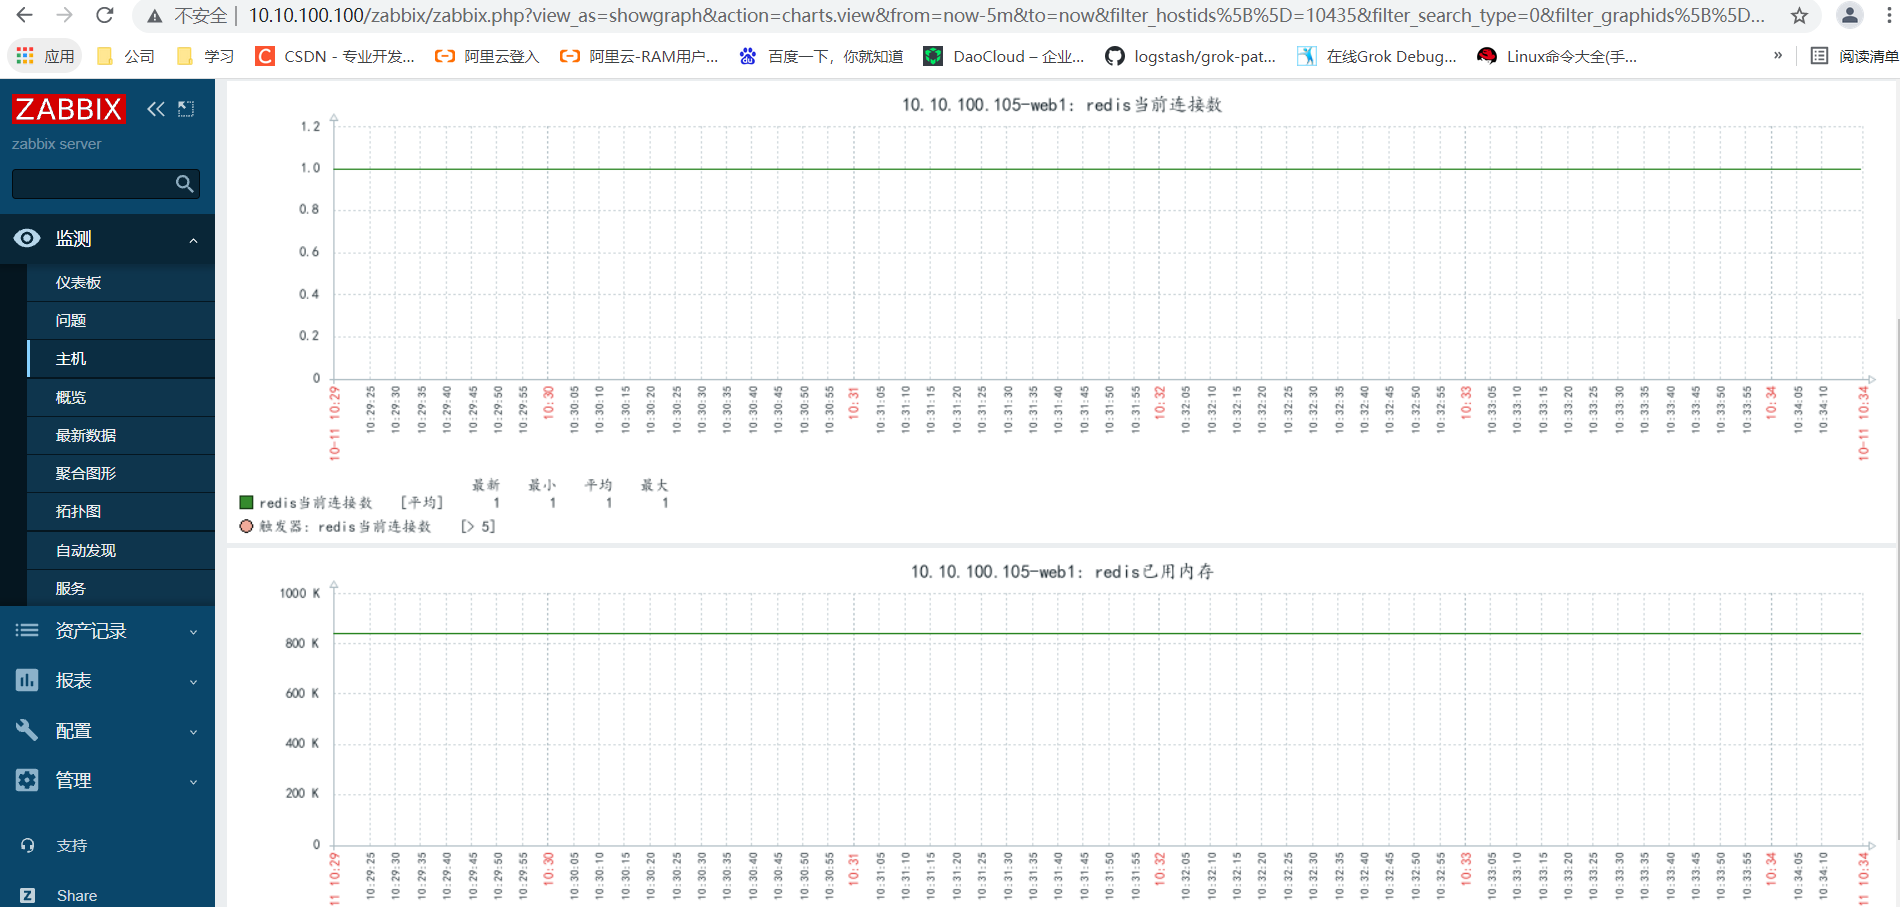
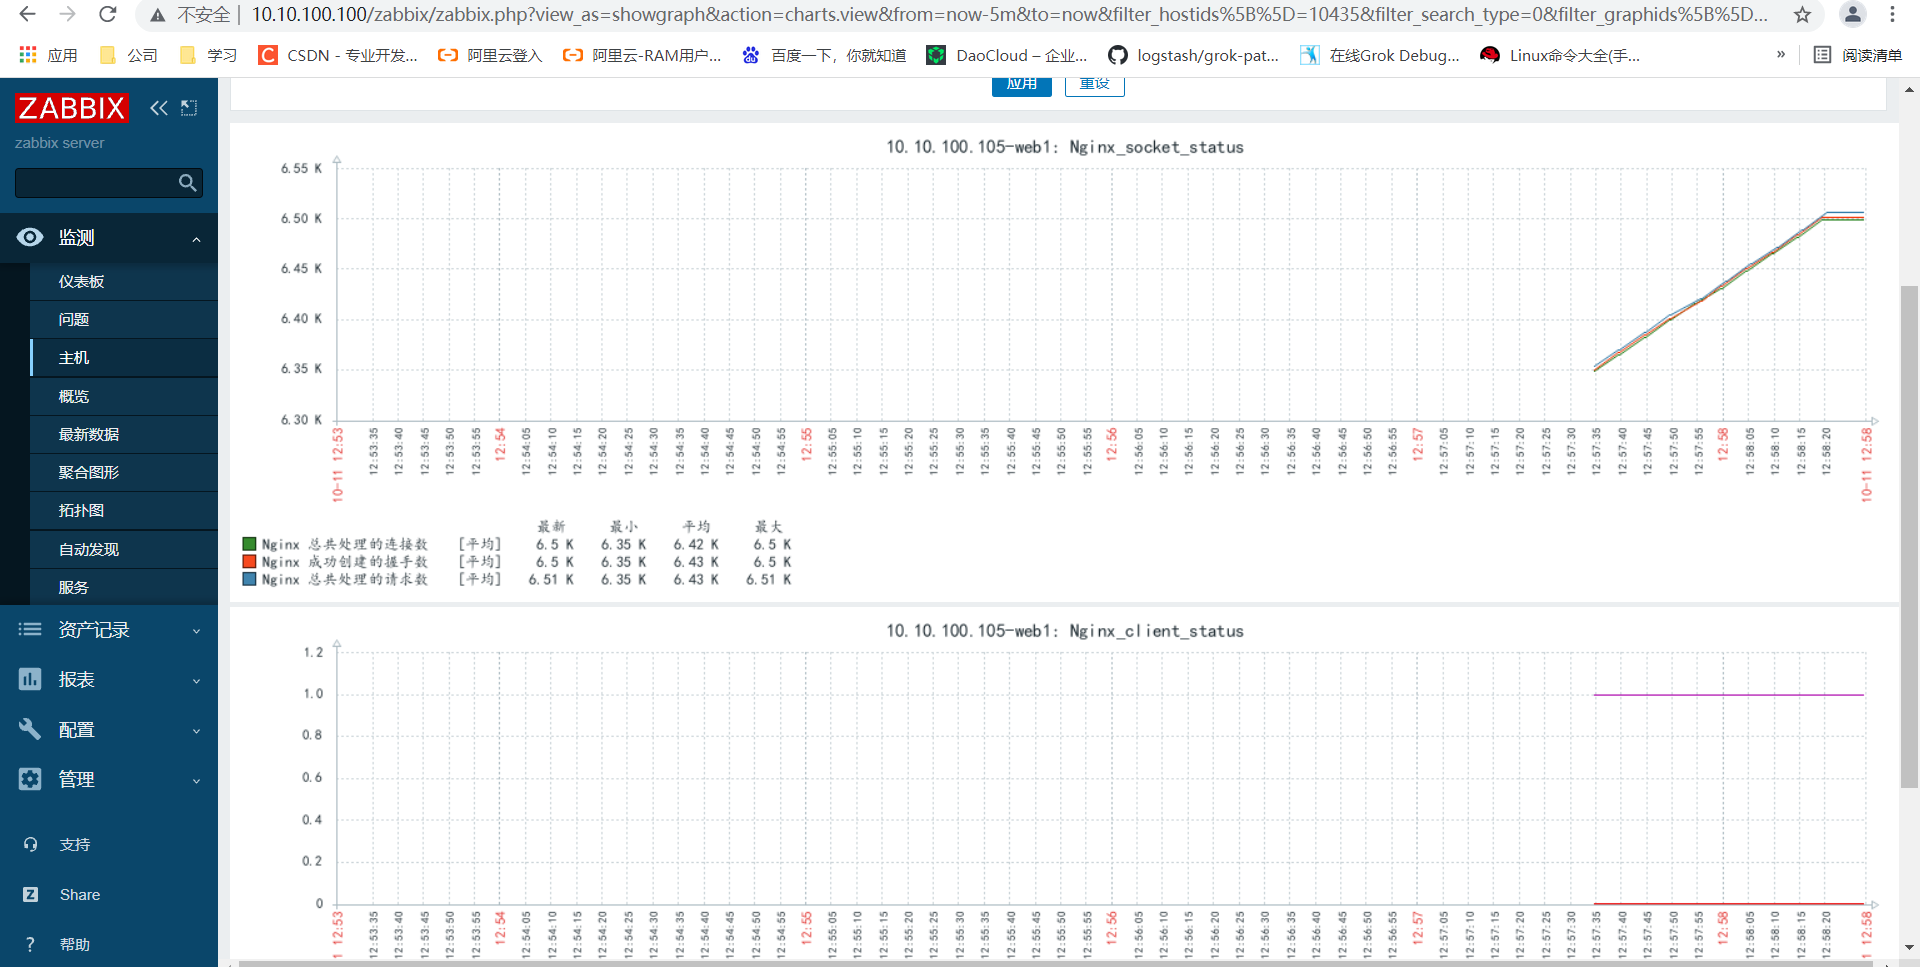
3, Monitor nginx
Monitor the active connection and current status of nginx
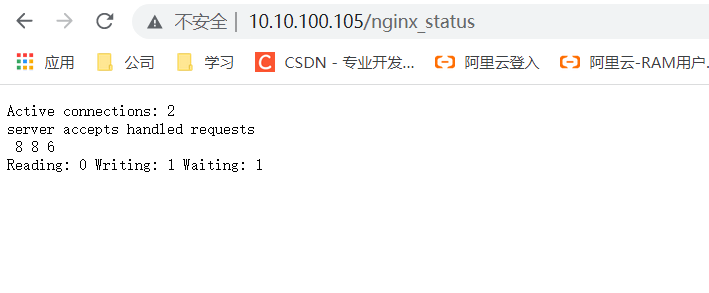
3.1 nginx configuration status page
#Add the following configuration to the nginx configuration file
        location /nginx_status {
                stub_status;
                allow 10.10.100.0/24;
                allow 127.0.0.1;
                deny all;
        }
Access verification
3.2 monitoring script
root@web1:/etc# vim /etc/zabbix/zabbix_agentd.conf.d/nginx_status.sh
#!/bin/bash
nginx_status_fun(){
        NGINX_PORT=$1
        NGINX_COMMAND=$2
        nginx_active(){
                /usr/bin/curl "http://127.0.0.1:"$NGINX_PORT"/nginx_status/" 2>/dev/null| grep 'Active' | awk '{print $NF}'
        }
        nginx_reading(){
                /usr/bin/curl "http://127.0.0.1:"$NGINX_PORT"/nginx_status/" 2>/dev/null| grep 'Reading' | awk '{print $2}'
        }
        nginx_writing(){
                /usr/bin/curl "http://127.0.0.1:"$NGINX_PORT"/nginx_status/" 2>/dev/null| grep 'Writing' | awk '{print $4}'
        }
        nginx_waiting(){
                /usr/bin/curl "http://127.0.0.1:"$NGINX_PORT"/nginx_status/" 2>/dev/null| grep 'Waiting' | awk '{print $6}'
        }
        nginx_accepts(){
                /usr/bin/curl "http://127.0.0.1:"$NGINX_PORT"/nginx_status/" 2>/dev/null| awk NR==3 | awk '{print $1}'
        }
        nginx_handled(){
                /usr/bin/curl "http://127.0.0.1:"$NGINX_PORT"/nginx_status/" 2>/dev/null| awk NR==3 | awk '{print $2}'
        }
        nginx_requests(){
                /usr/bin/curl "http://127.0.0.1:"$NGINX_PORT"/nginx_status/" 2>/dev/null| awk NR==3 | awk '{print $3}'
        }
        case $NGINX_COMMAND in
                active)
                    nginx_active;
                    ;;
                reading)
                    nginx_reading;
                    ;;
                writing)
                    nginx_writing;
                    ;;
                waiting)
                    nginx_waiting;
                    ;;
                accepts)
                    nginx_accepts;
                    ;;
                handled)
                    nginx_handled;
                    ;;
                requests)
                    nginx_requests;
                    ;;
        esac
}

main(){
        case $1 in
                nginx_status)
                    nginx_status_fun $2 $3;
                    ;;
                *)
                    echo $"Usage: $0 {nginx_status key}"
        esac
}
main $1 $2 $3
3.3 ZABBIX agent adding user-defined monitoring items
root@web1:/etc# vim /etc/zabbix/zabbix_agentd.conf
UserParameter=nginx.status[*],/etc/zabbix/zabbix_agentd.conf.d/nginx_status.sh "$1" "$2" "$3"

#Restart ZABBIX agent
root@web1:/etc# systemctl restart zabbix-agent.service
Verification test on ZABBIX server
root@zabbix-server:~# /apps/zabbix_server/bin/zabbix_get -s 10.10.100.105 -k "nginx_status["nginx_status",80,"active"]"
1
3.4 import Nginx monitoring template
3.4 Association template
3.5 verification of monitoring data
4, Email notification
Send an alarm email to the operation and maintenance engineer through the corporate email and the email of the third-party service provider
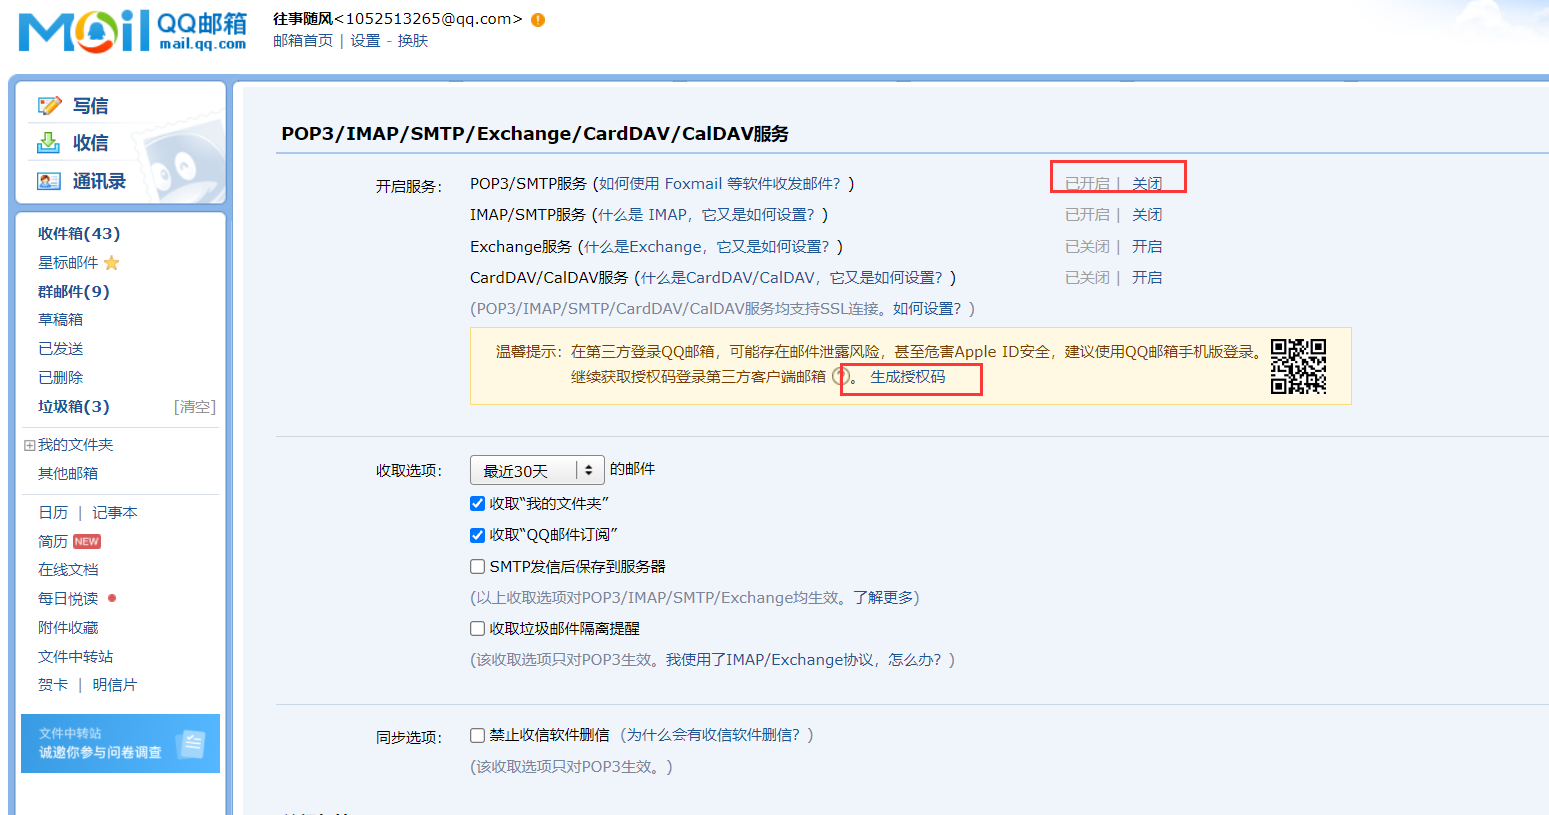
4.1 enable SMTP for mailbox
If it is a QQ mailbox, SMTP needs to be opened separately. For other mailboxes, please contact the service provider
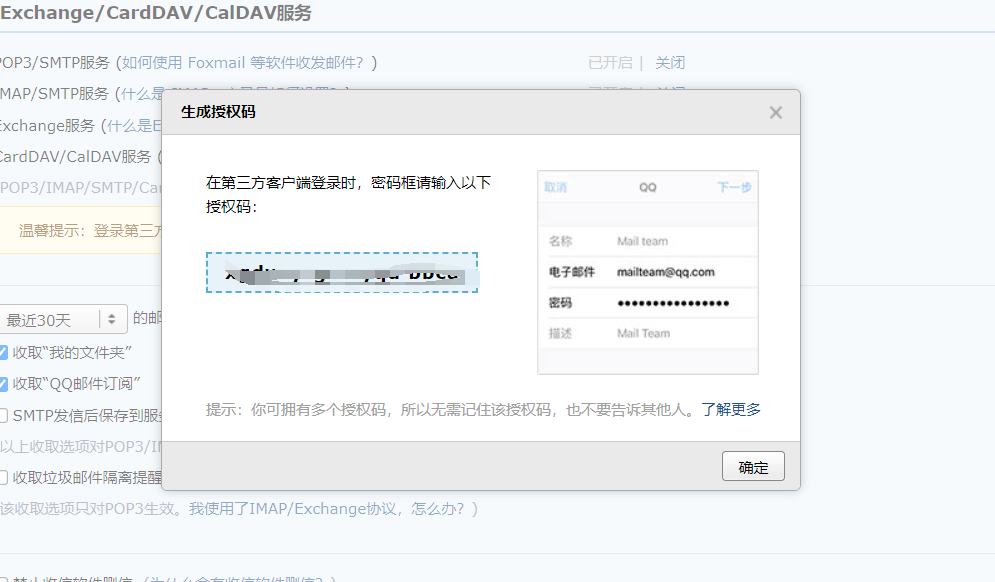
Save the authorization code returned after the page is generated, and this authorization code will be used for login verification later
4.2 Zabbix Web create alarm media type
The alarm media type is a channel to send message notification to the operation and maintenance engineer, that is, how can the event be notified to the operation and maintenance engineer in some ways after the trigger of zabbix triggers an event? Then the media type plays such a role. After the media type is created, you need to add the corresponding recipient configuration in each account. For example, for the mail type media type, you need to add an email to the zabbix account. If it is a wechat type media type, you need to set a wechat in the zabbix account. The same comes, For the media type of SMS, you have to set the mobile phone number for zabbix account to receive the alarm message content.
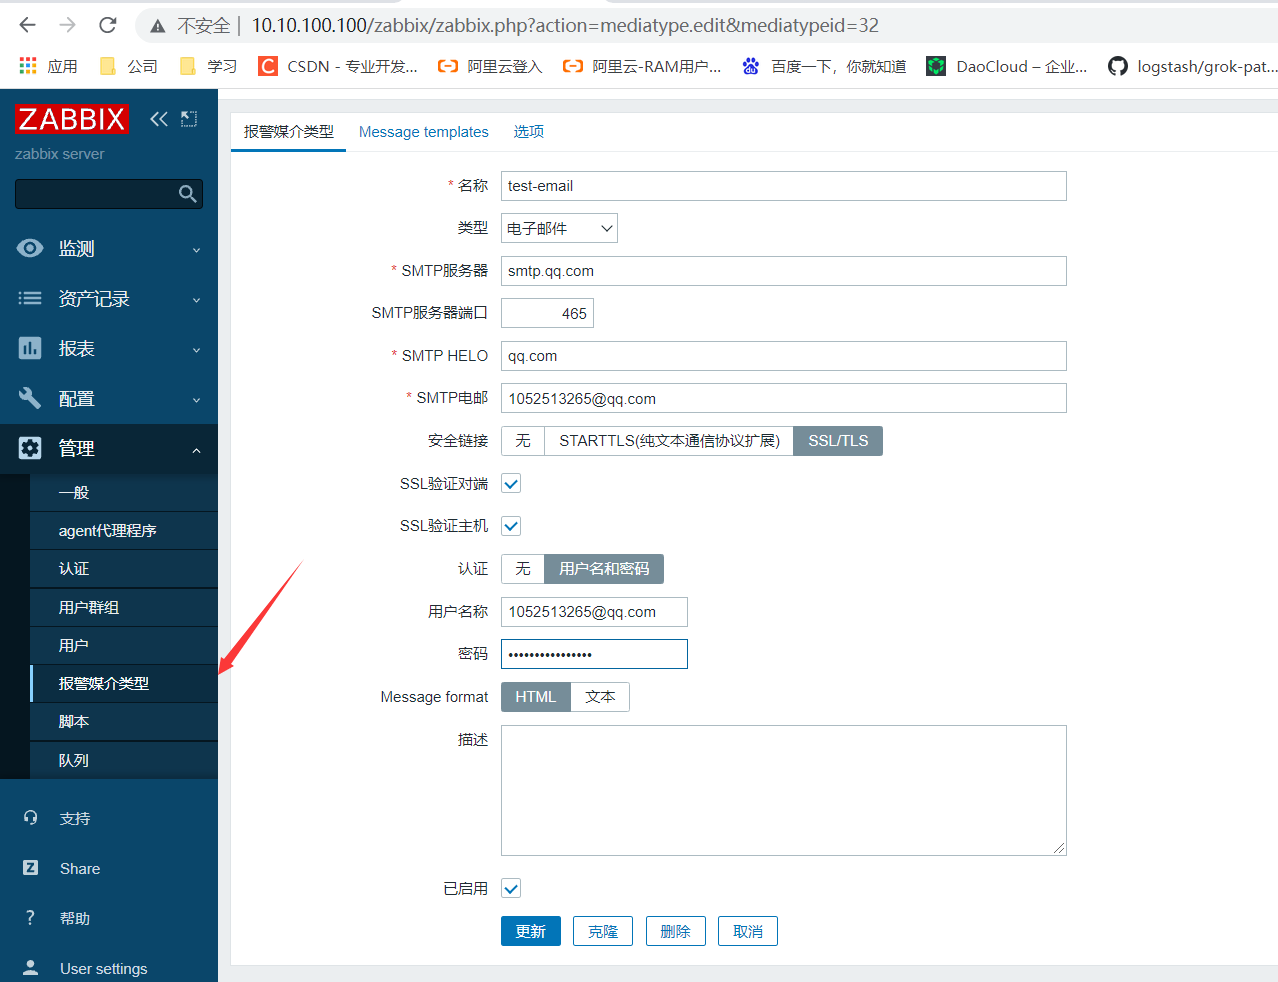
The password uses the authorization code just saved
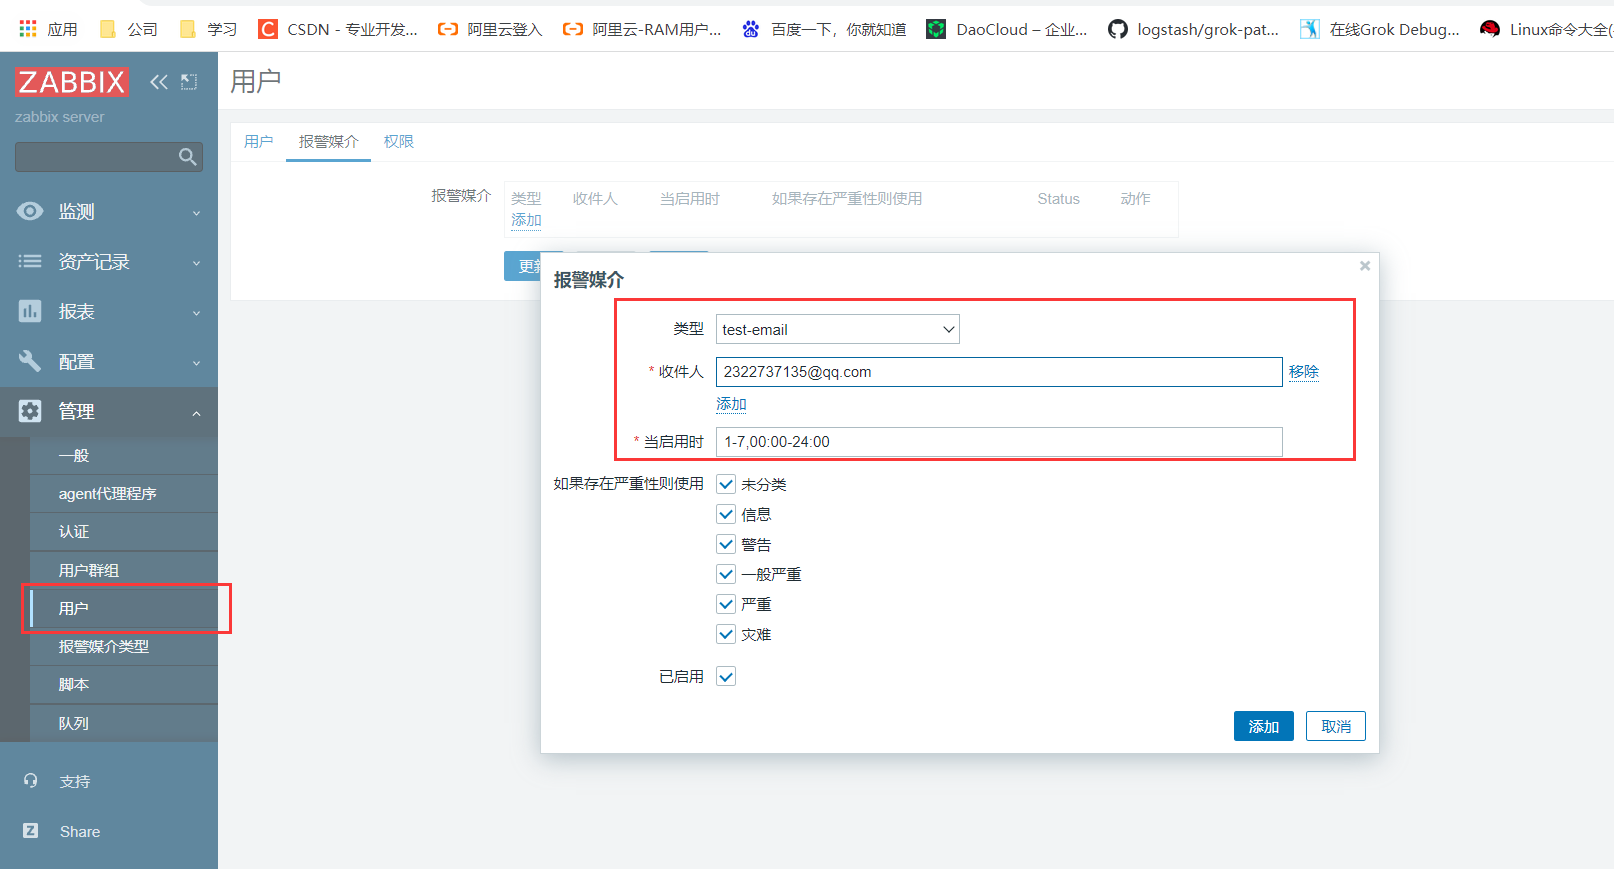
4.3 add alarm media to users
User interface select user add
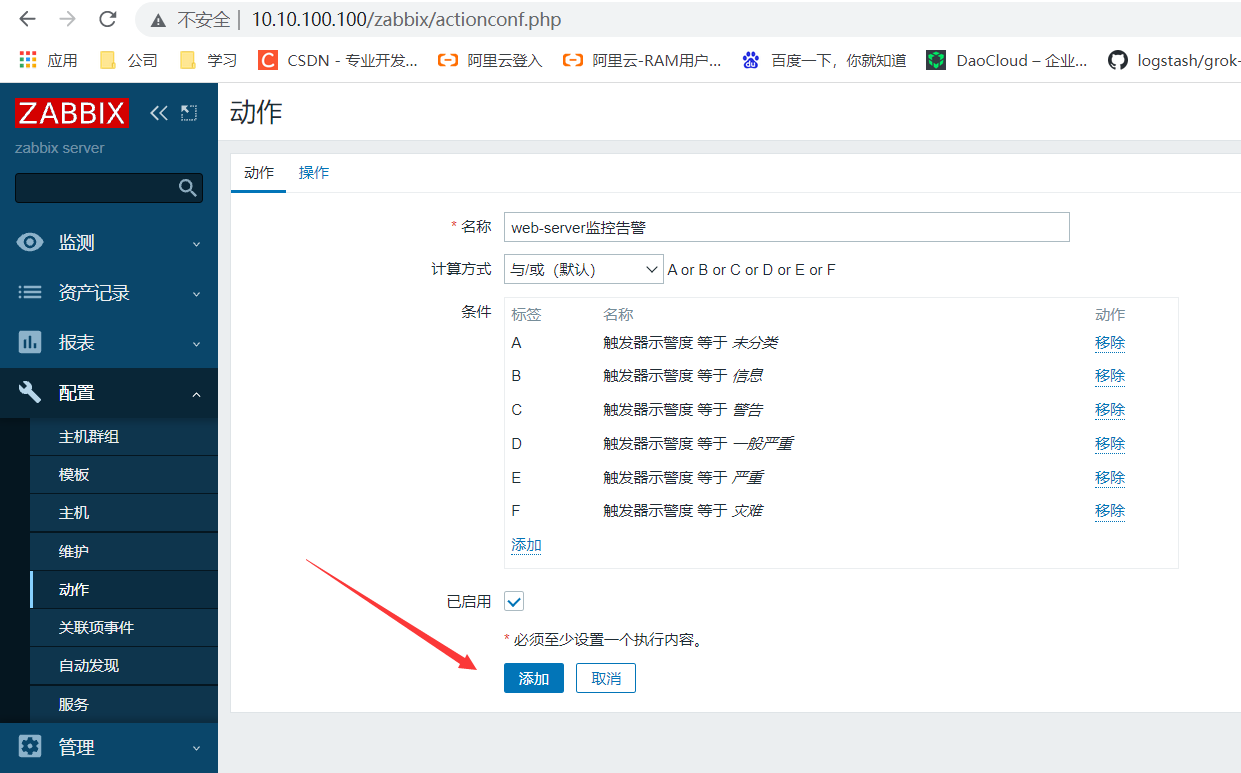
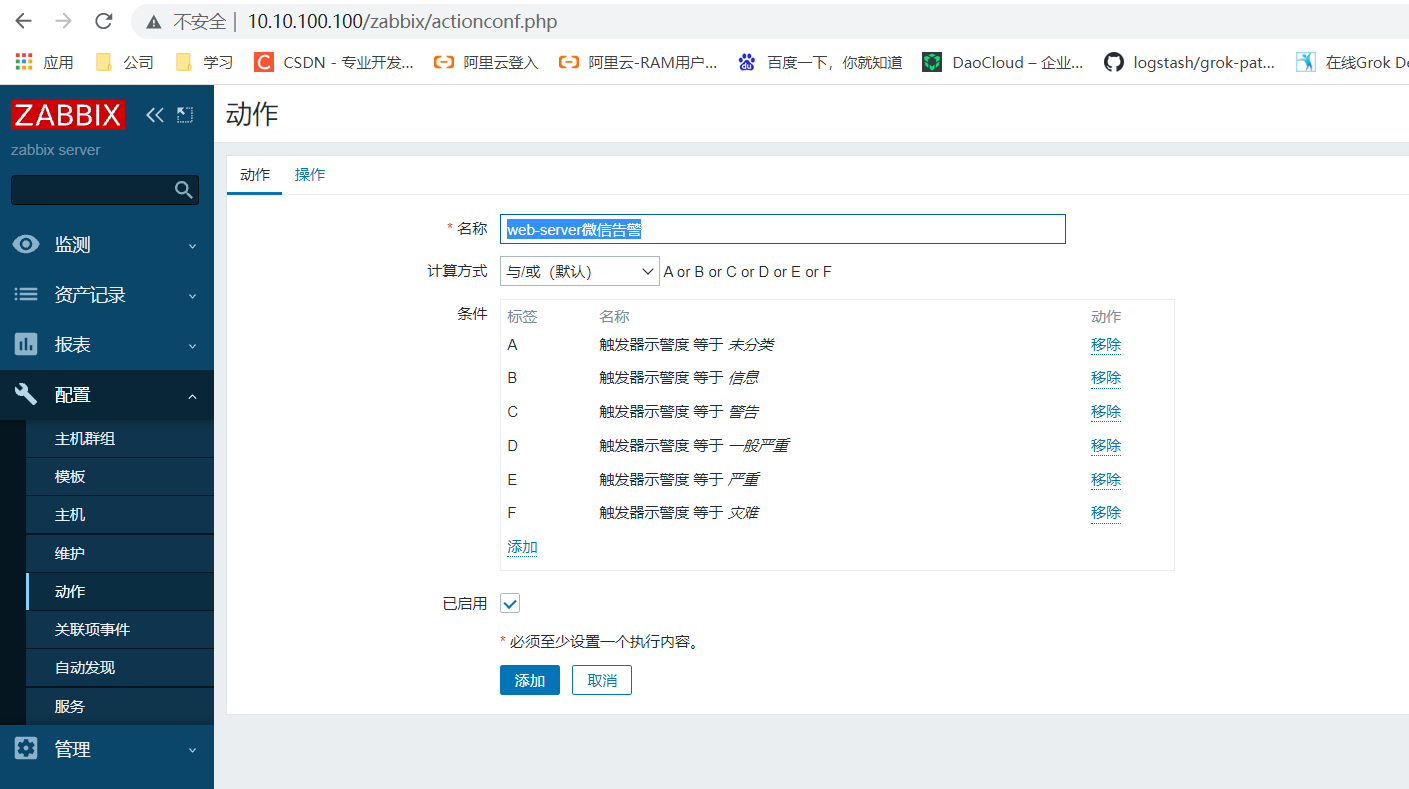
4.4 create action
Action is a specific processing operation for the event generated after the zabbix trigger is triggered. It can be to execute the command remotely or send a notice to the specified administrator for fault processing. The sending command is the alarm media type created in the previous step.
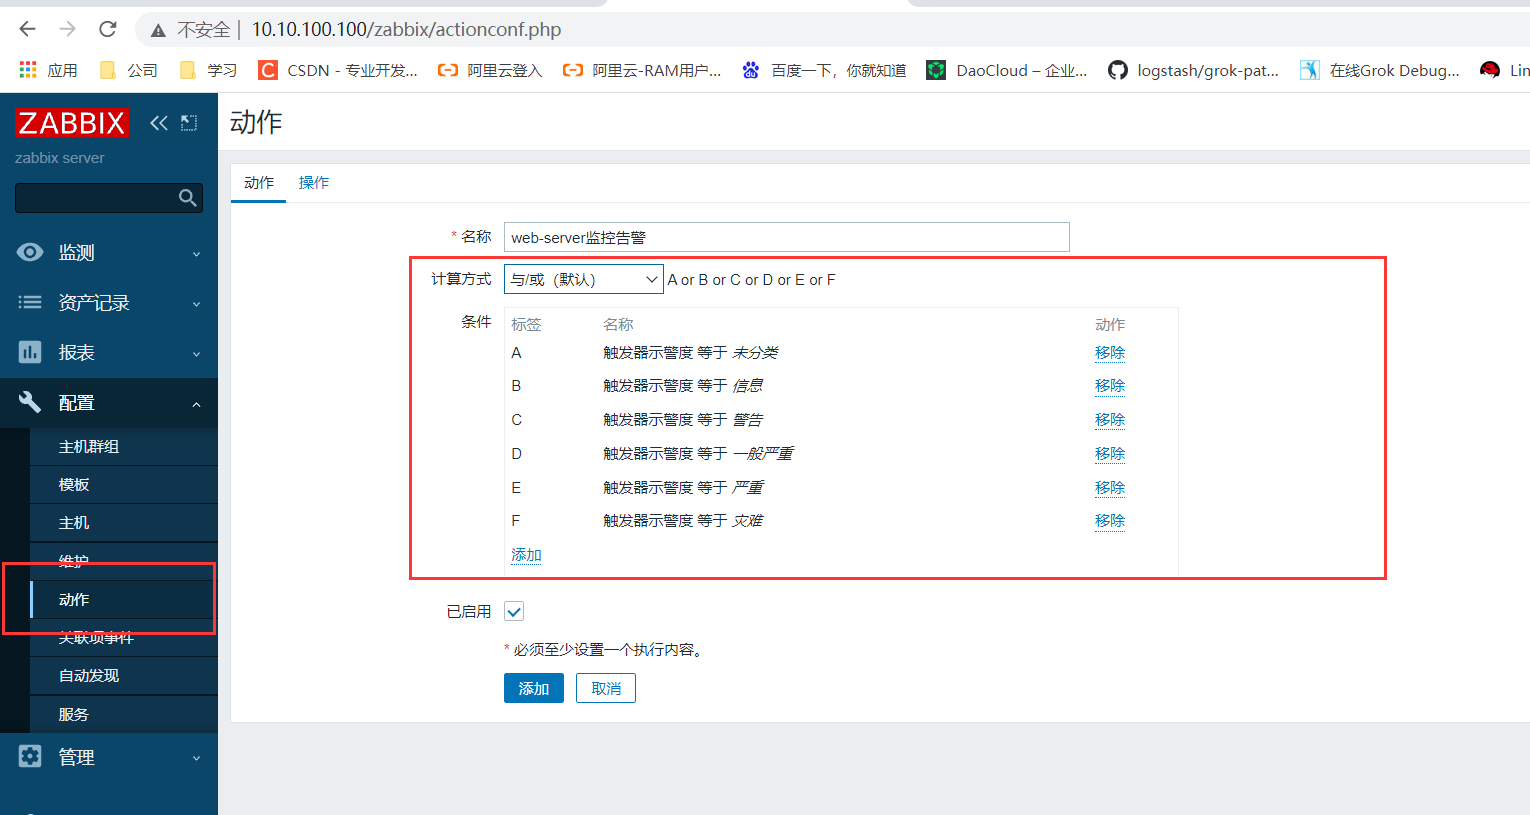
4.5 configuration action information
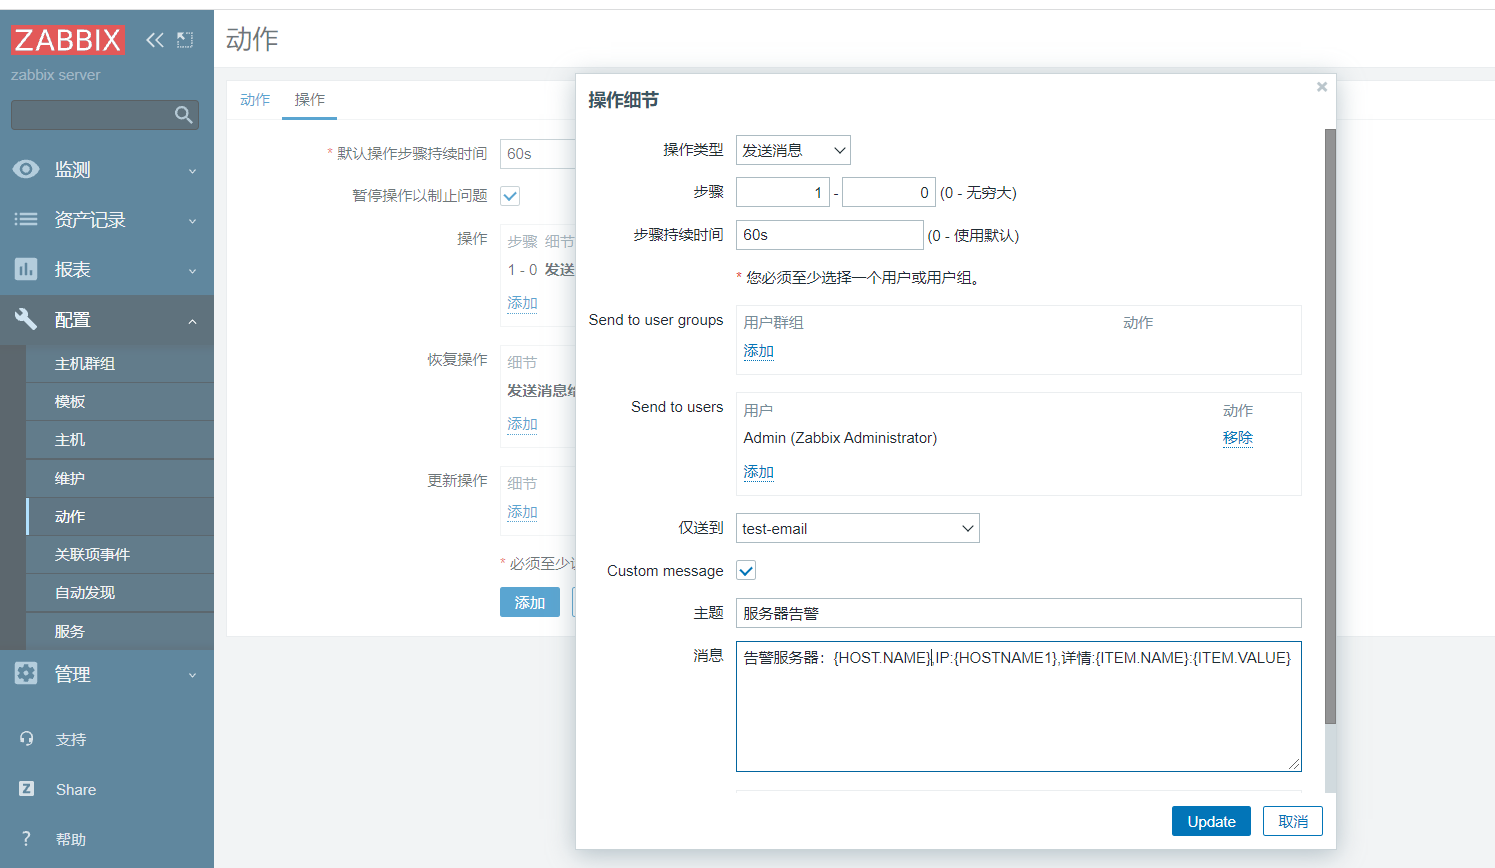
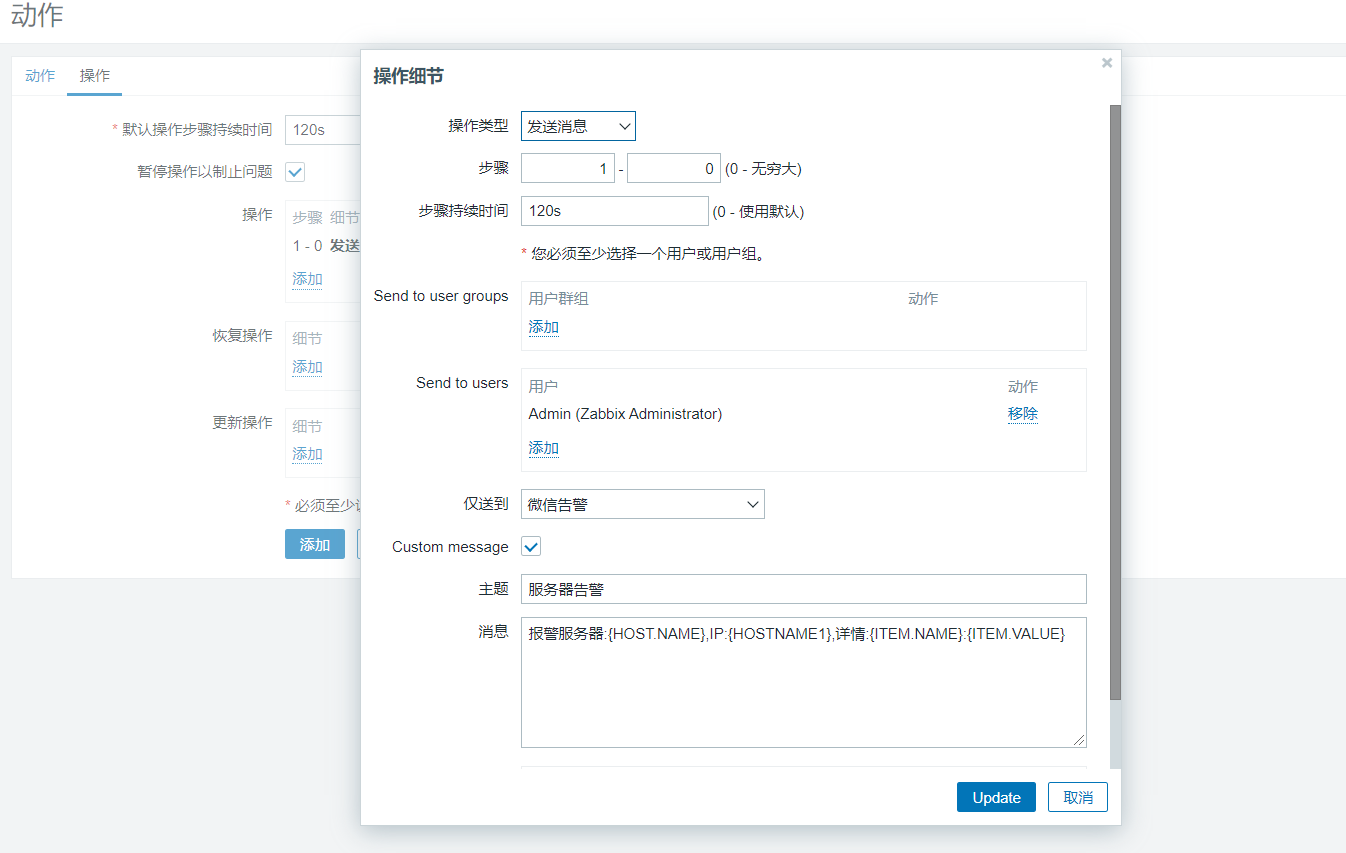
4.5.1 alarm operation
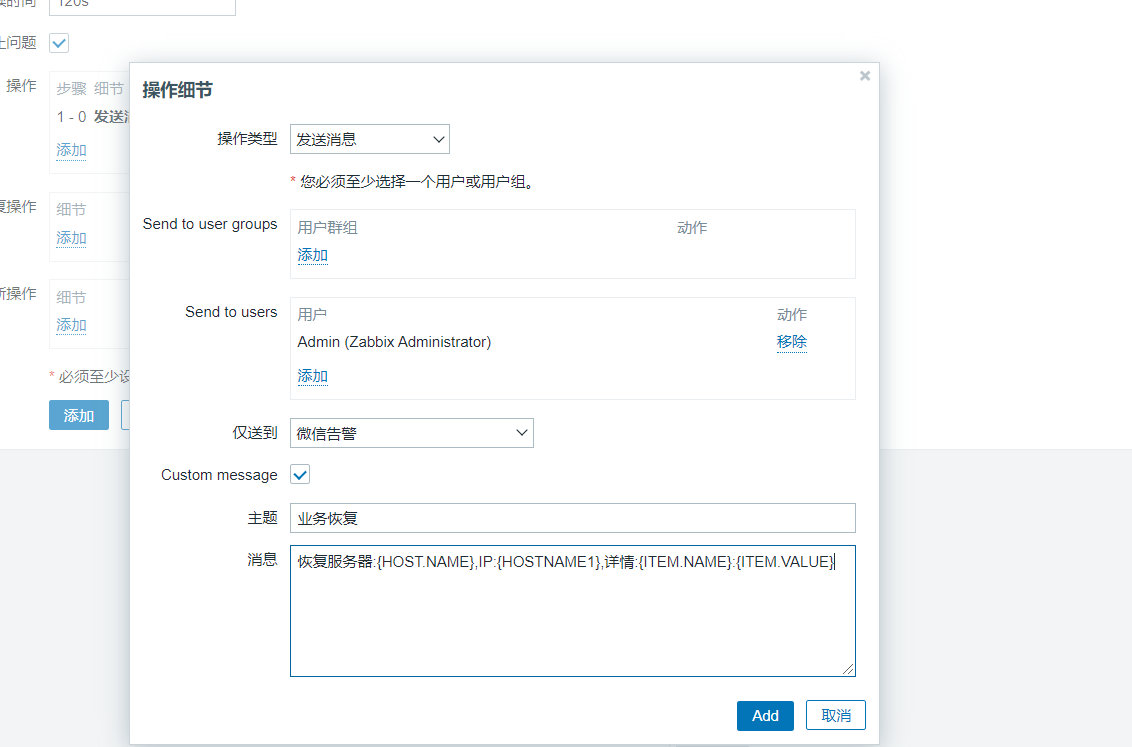
4.5.2 recovery operation
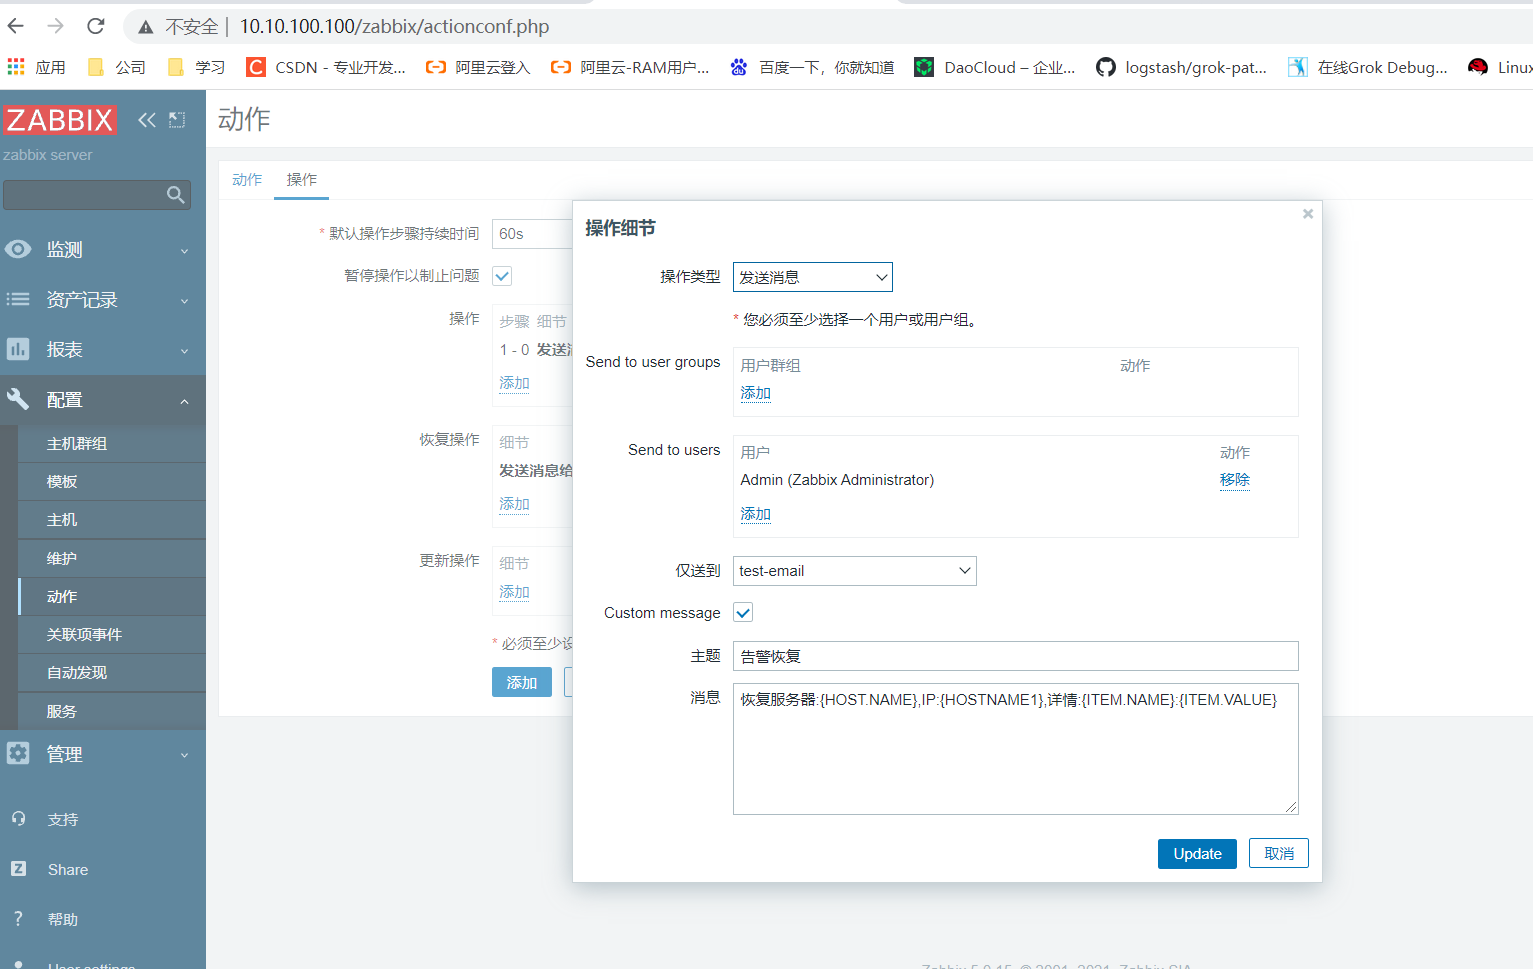
Click Add to save the action
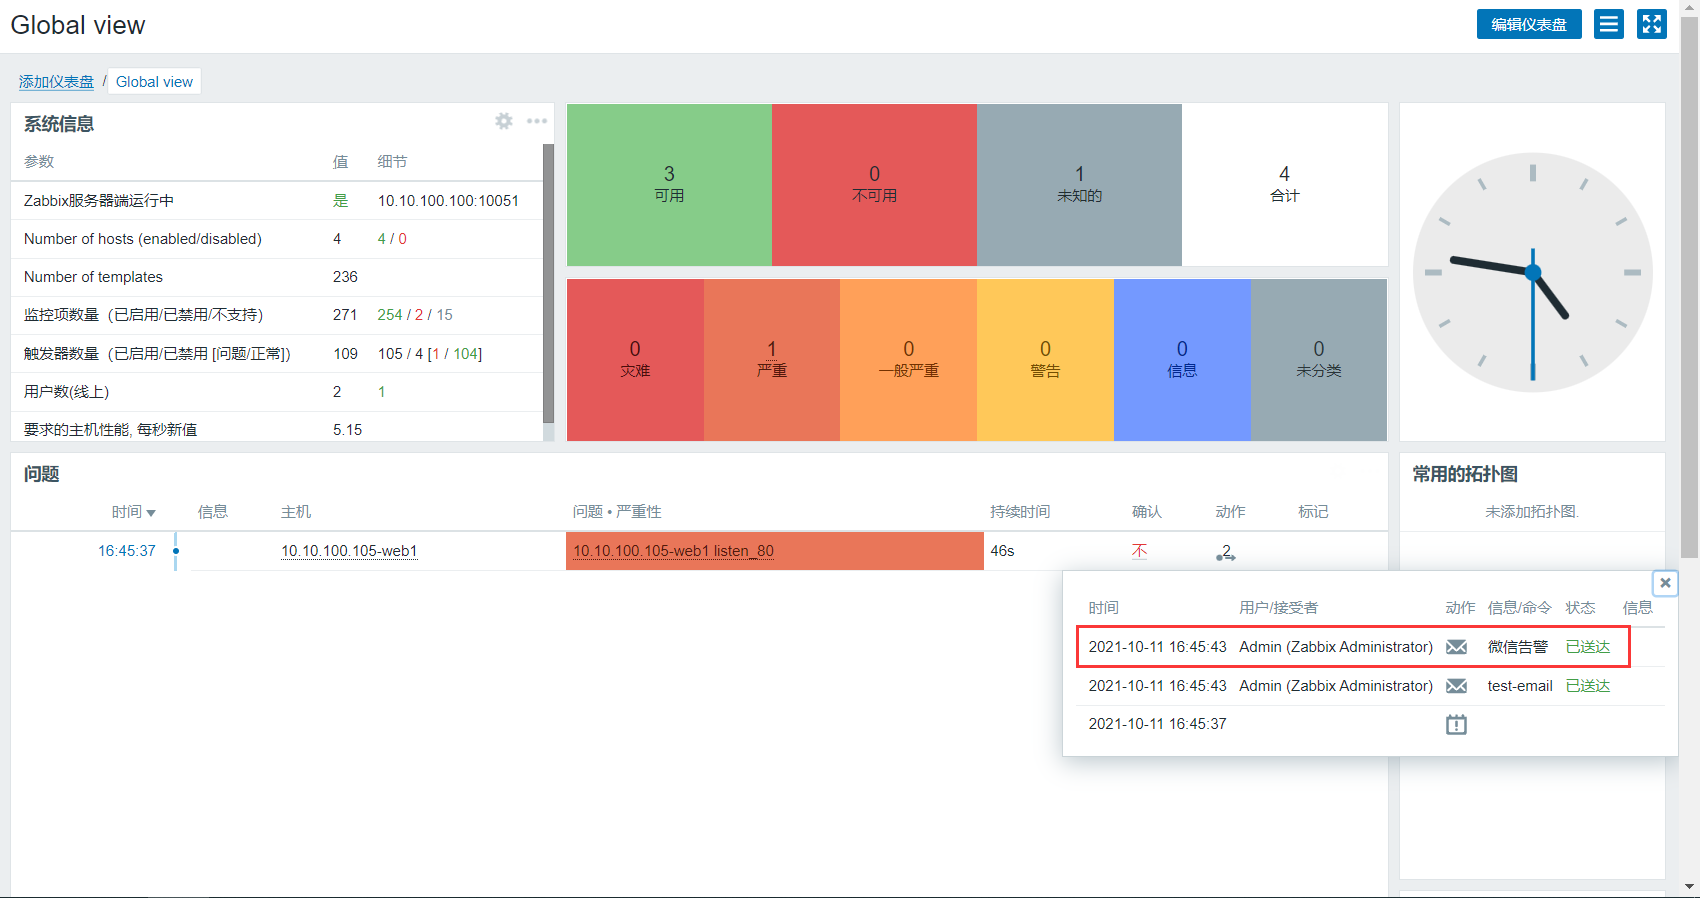
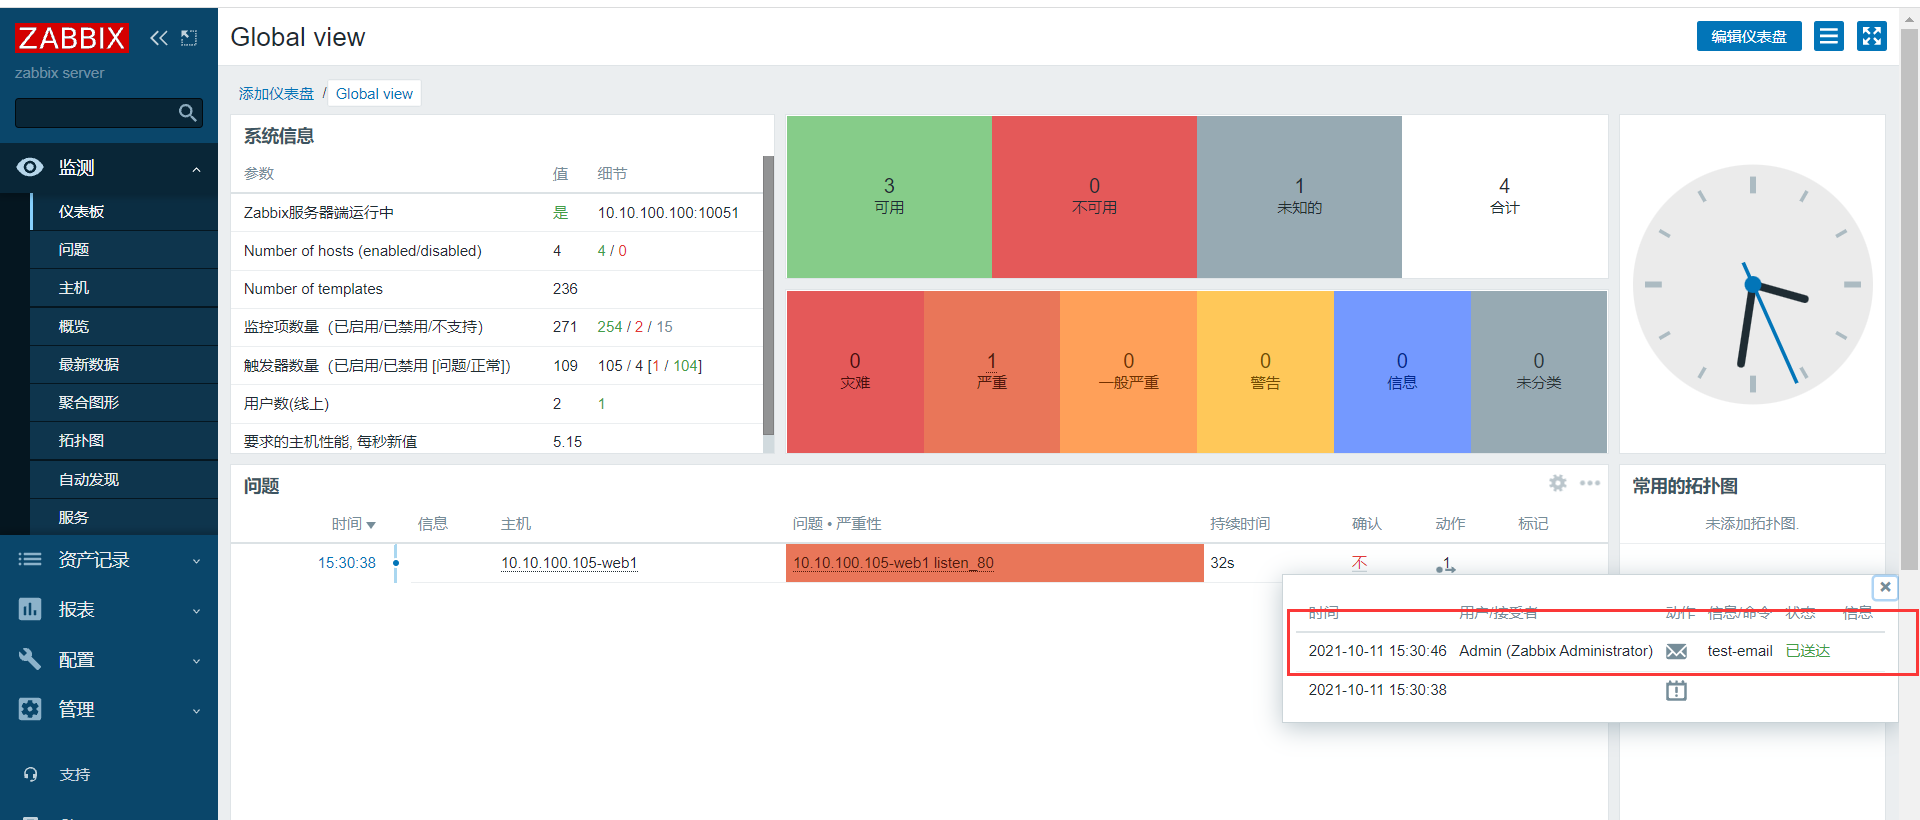
4.6 verification action
Manually stop a monitored service to verify whether the alarm notification sent by zabbix can be received
Here, the nginx service verification on web1 is removed manually
root@web1:~# systemctl stop nginx
The ZABBIX web interface shows that the mail has been sent
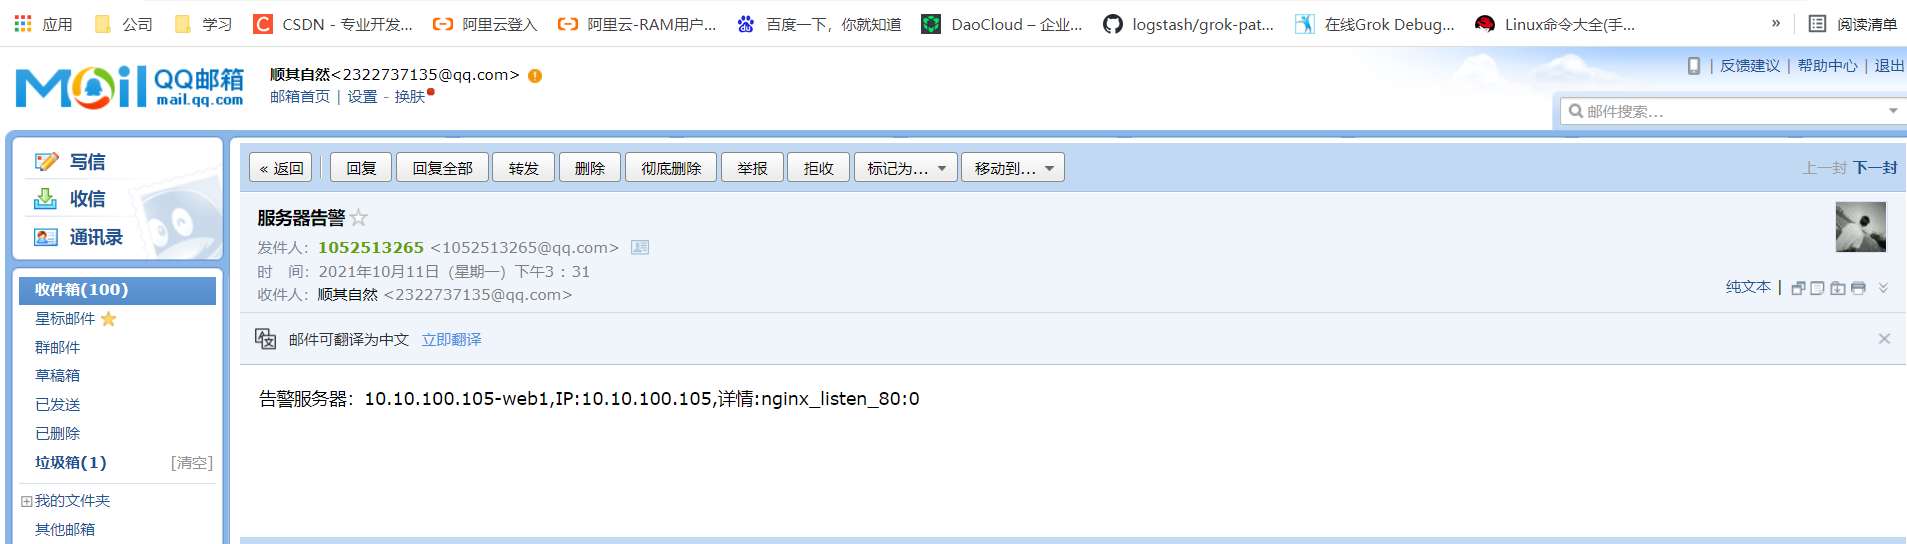
Log in to the mailbox and you can see that the mail has been received
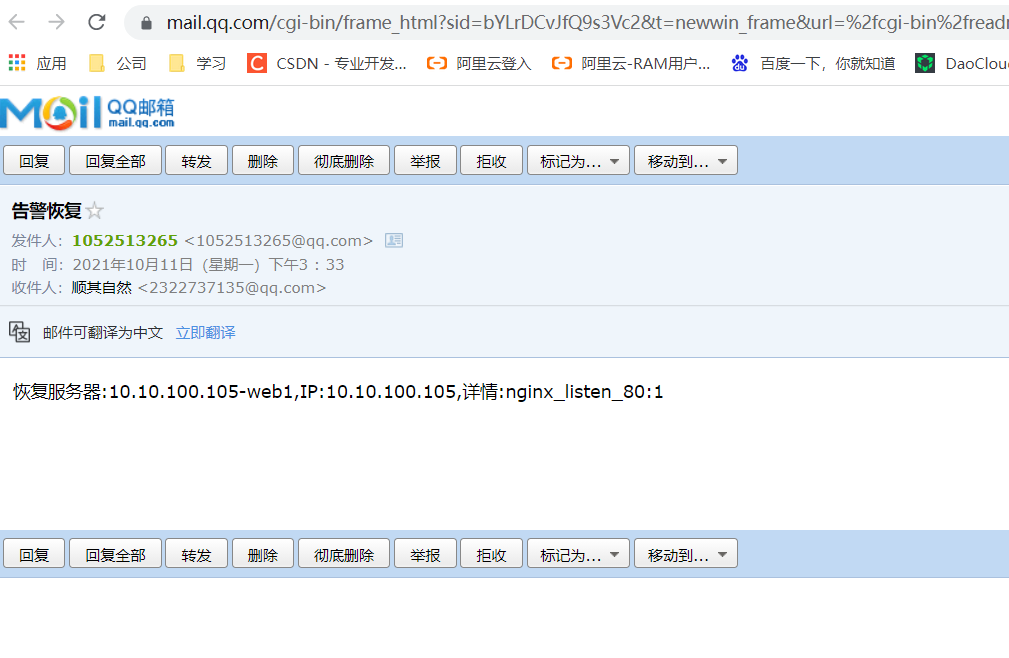
Start recovery notification under nginx test
root@web1:~# systemctl start nginx
After nginx recovers, the recovery notice is received
5, Wechat notification
5.1 enterprise wechat registration and configuration
https://work.weixin.qq.com/
Open the enterprise wechat official website to register an account and use your mobile phone number to register.
5.2 login to PC version
After registering the account, scan the code to log in to the PC version web interface and create an application
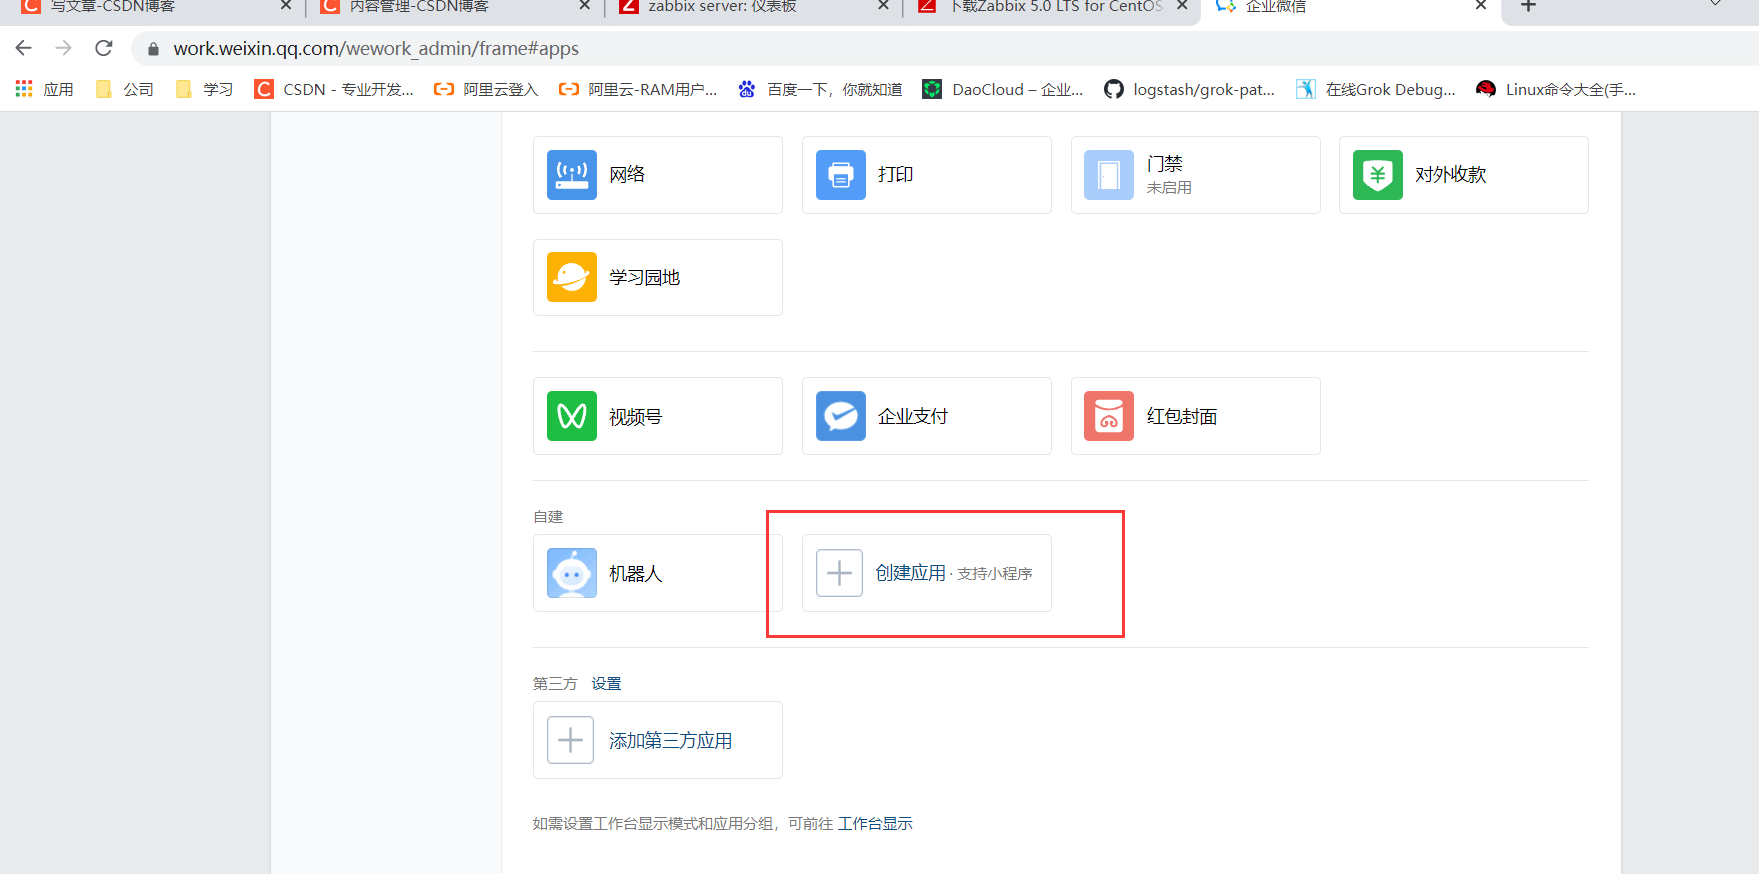
5.2.1 creating applications
**Click application management and select Create application**
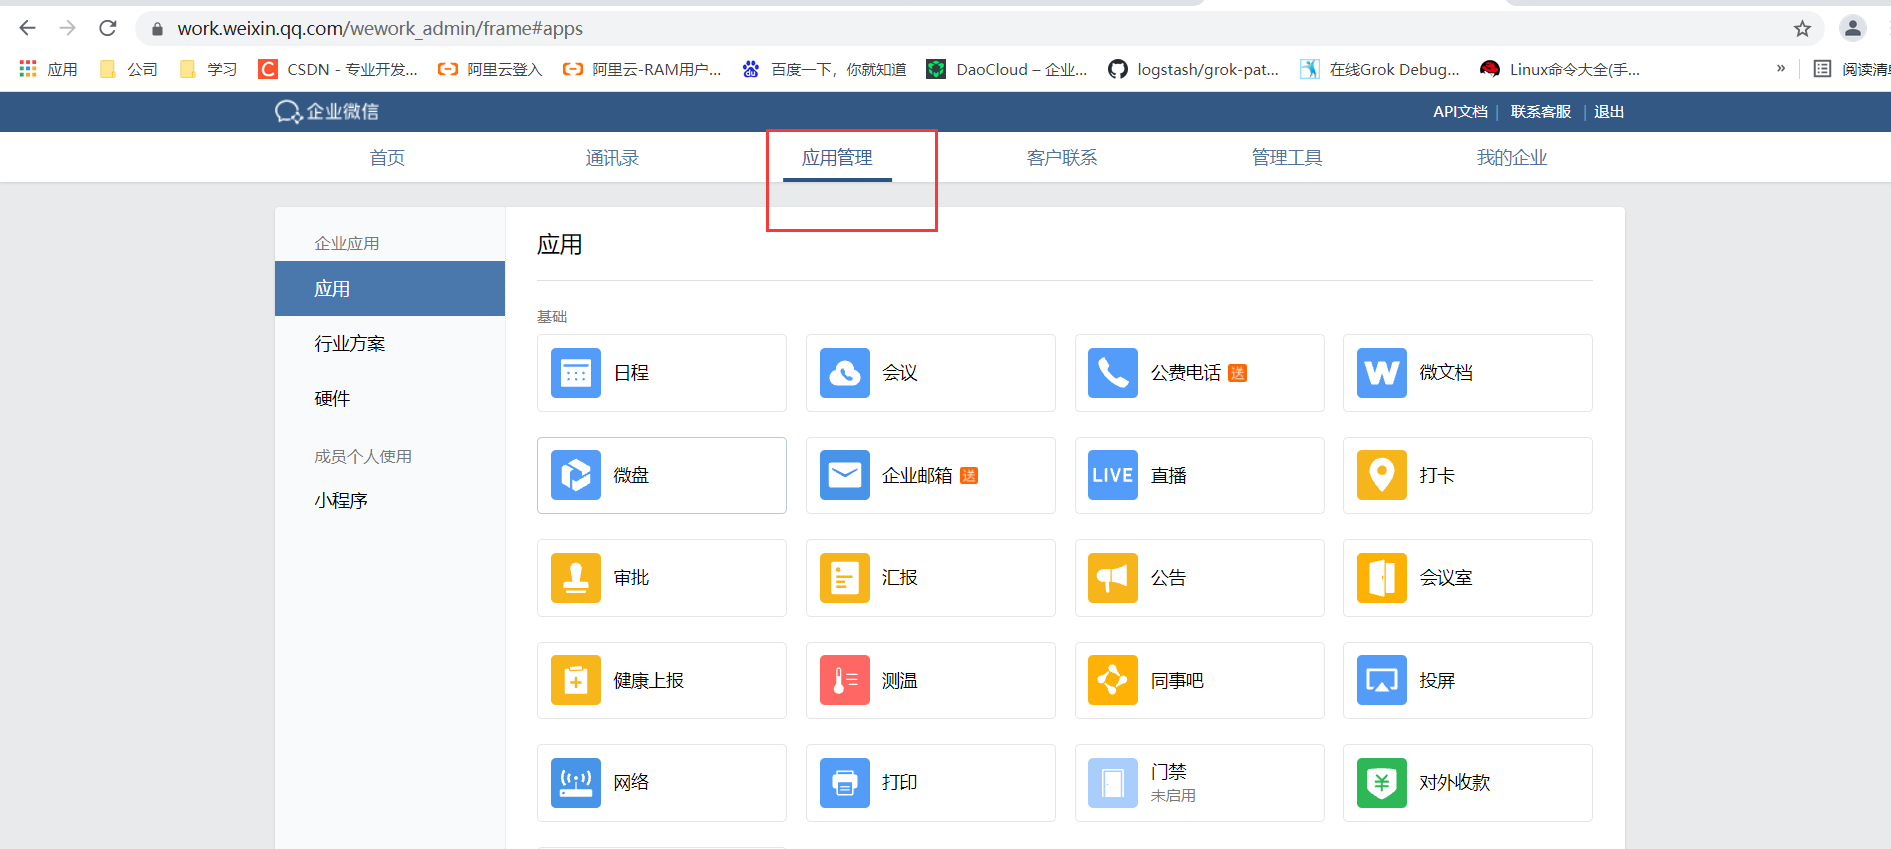
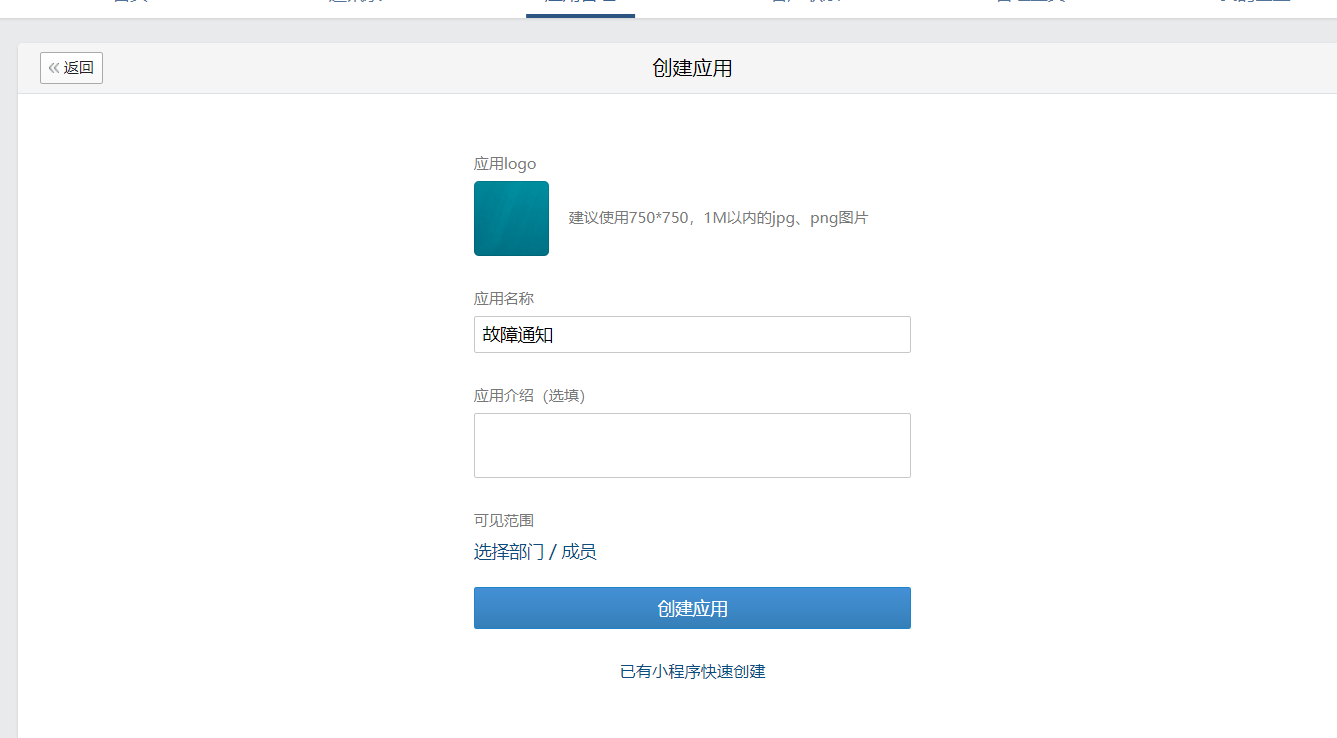
Fill in information
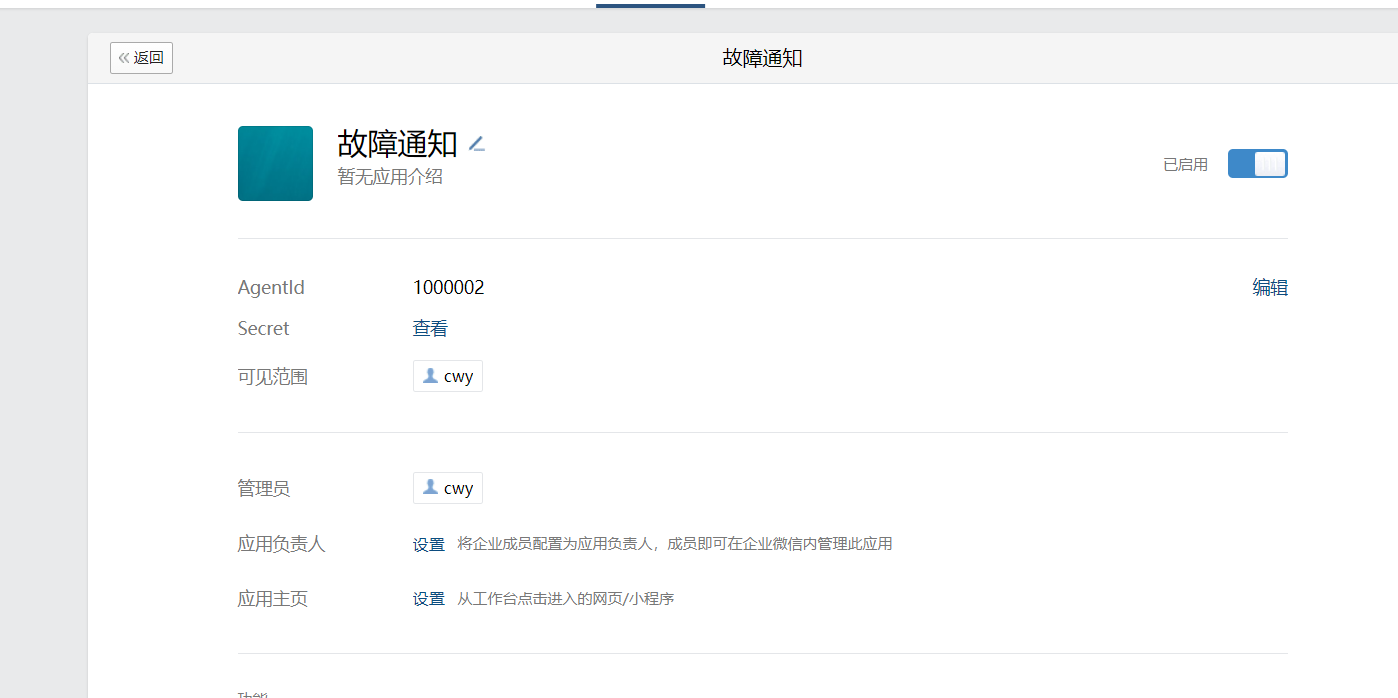
Creation complete
AgentID and Secret will be called when sending wechat alarm information
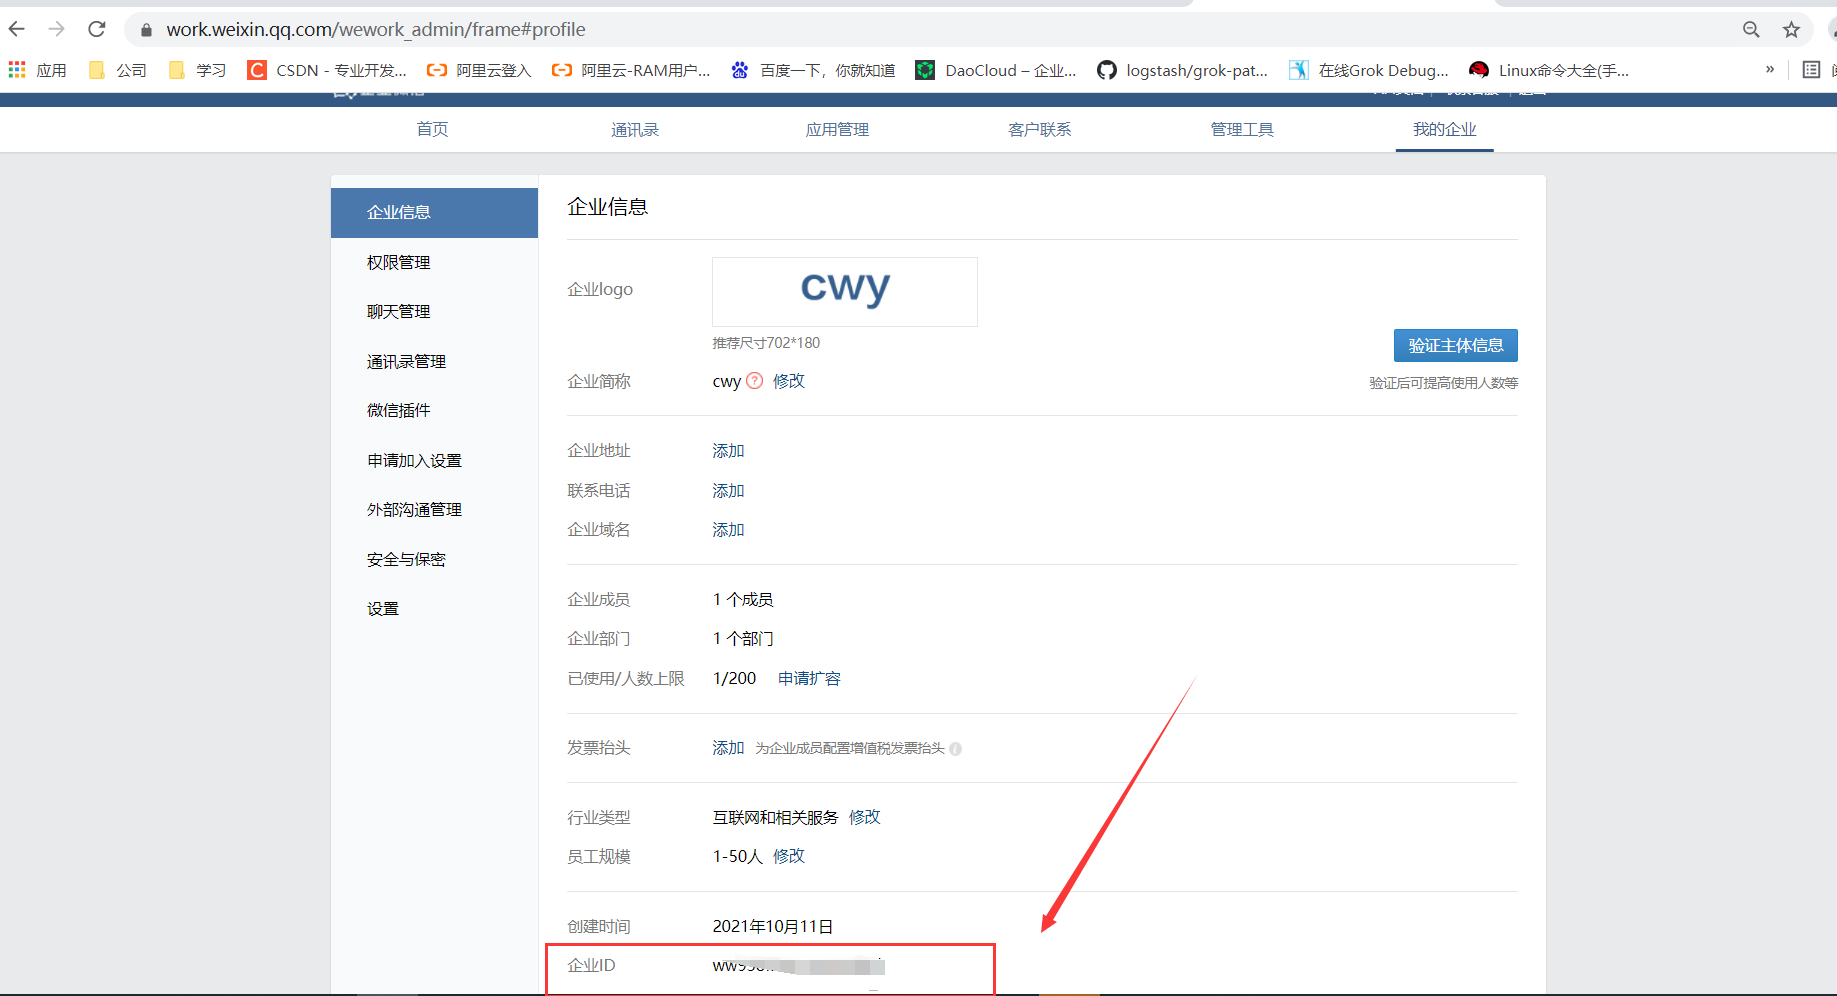
5.2.2 viewing enterprise information
The enterprise ID will be called when sending wechat alarm information
5.3 zabbix server configuration
zabbix server implements wechat notification based on python calling script, and the requests module needs to be installed:
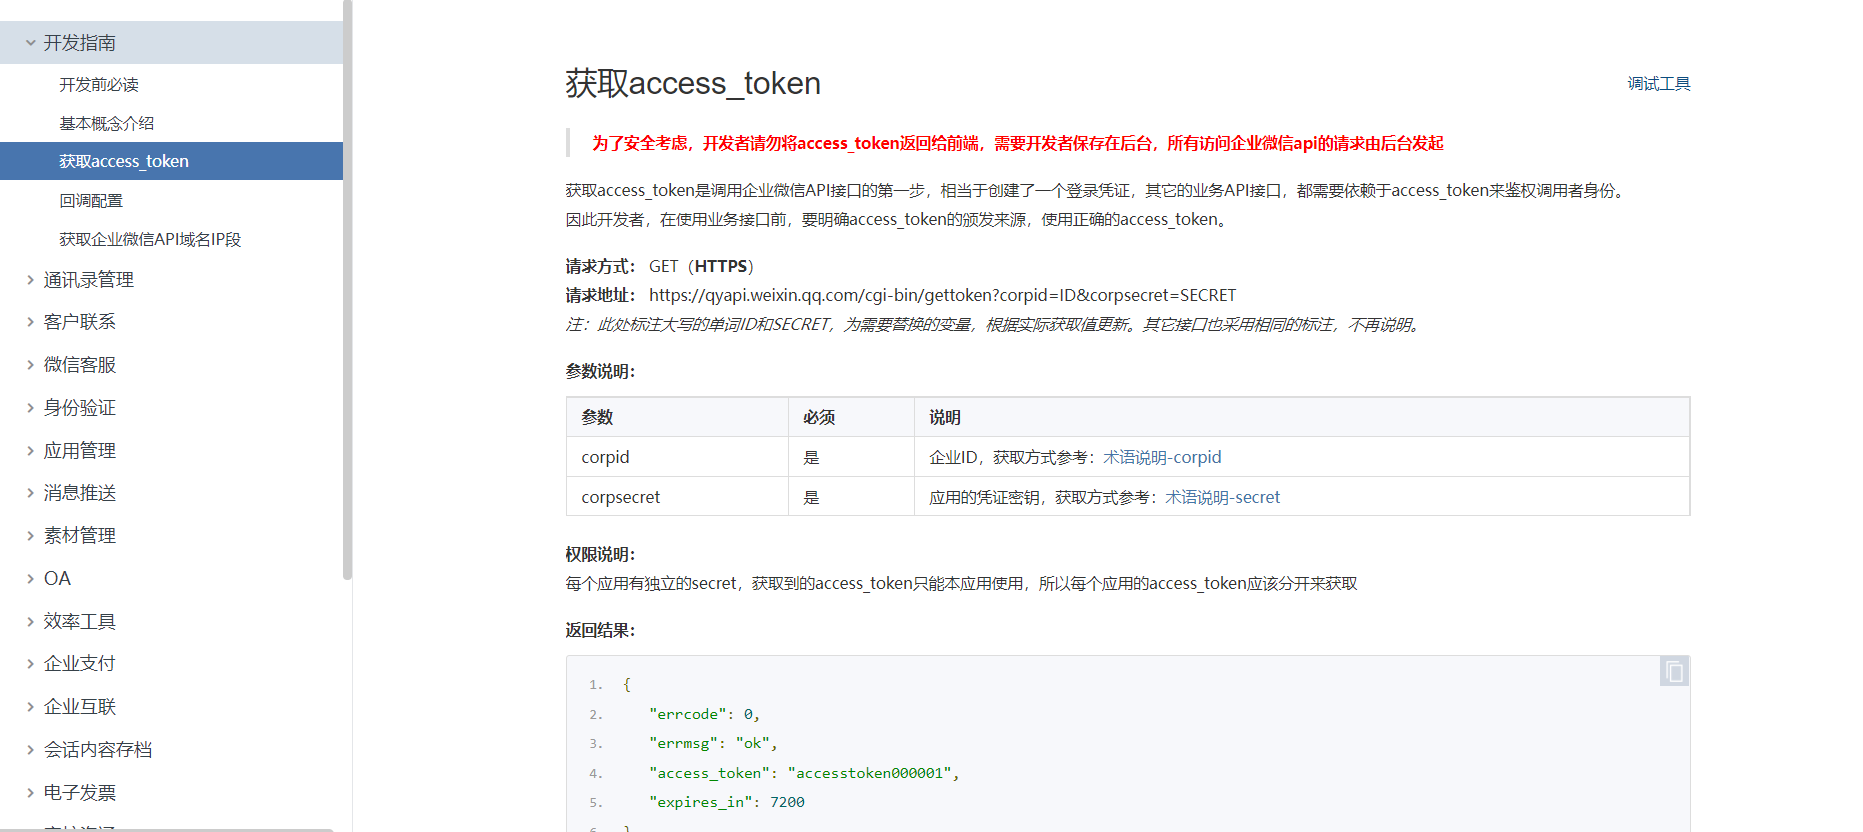
#Official course
https://work.weixin.qq.com/api/doc#90000/90003/90487
Get the token first. The token is obtained through Corpid (enterprise ID) and corpsecret (application Secret), and then send the message through the API. According to the official document, the sent message is actually a post request. The request method is as follows:
Request method: POST (HTTPS)
Request address: https://qyapi.weixin.qq.com/cgi-bin/message/send?access_token=ACCESS_TOKEN
The post parameter is access_token and message body.
Server API call: https://work.weixin.qq.com/api/doc#90000/90135/90664
5.3.1 writing python script
Install the basic module on zabbix server and write the python script. The python script automatically sends notification messages by calling the API of enterprise wechat. The specific contents are as follows:
root@zabbix-server:~# apt install python-pip
root@zabbix-server:~# pip install requests

root@zabbix-server:~# vim /apps/zabbix_server/share/zabbix/alertscripts/wx.py
#!/usr/bin/python3.6
#coding:utf-8
import requests
import sys
import os
import json
import logging
logging.basicConfig(level = logging.DEBUG, format = '%(asctime)s, %(filename)s, %(levelname)s, %(message)s',
        datefmt = '%a, %d %b %Y %H:%M:%S',
        filename = os.path.join('/tmp','weixin.log'),
        filemode = 'a')

corpid='enterprise ID'
appsecret="Secret key"
agentid="AgentID"
token_url='https://qyapi.weixin.qq.com/cgi-bin/gettoken?corpid=' + corpid + '&corpsecret=' + appsecret
req=requests.get(token_url)
accesstoken=req.json()['access_token']

msgsend_url='https://qyapi.weixin.qq.com/cgi-bin/message/send?access_token=' + accesstoken
touser=sys.argv[1]
subject=sys.argv[2]
message=sys.argv[2] + "\n\n" +sys.argv[3]

params={
        "touser": touser,
        "msgtype": "text",
        "agentid": agentid,
        "text": {
            "content": message
            },
        "safe":0
        }
req=requests.post(msgsend_url, data=json.dumps(params))
logging.info('sendto:' + touser + ';;subject:' + subject + ';;message:' + message)
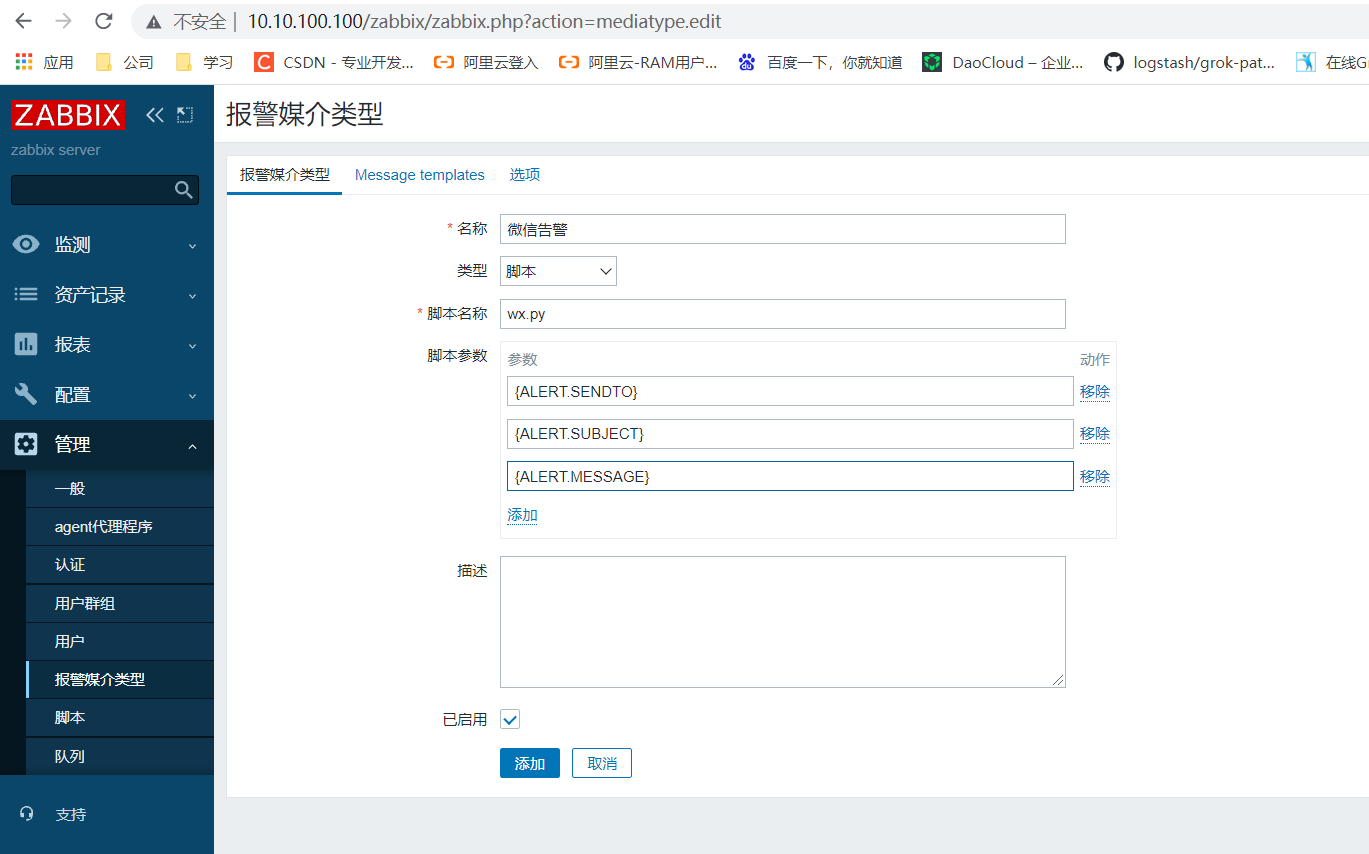
5.3.2 add wechat alarm media type
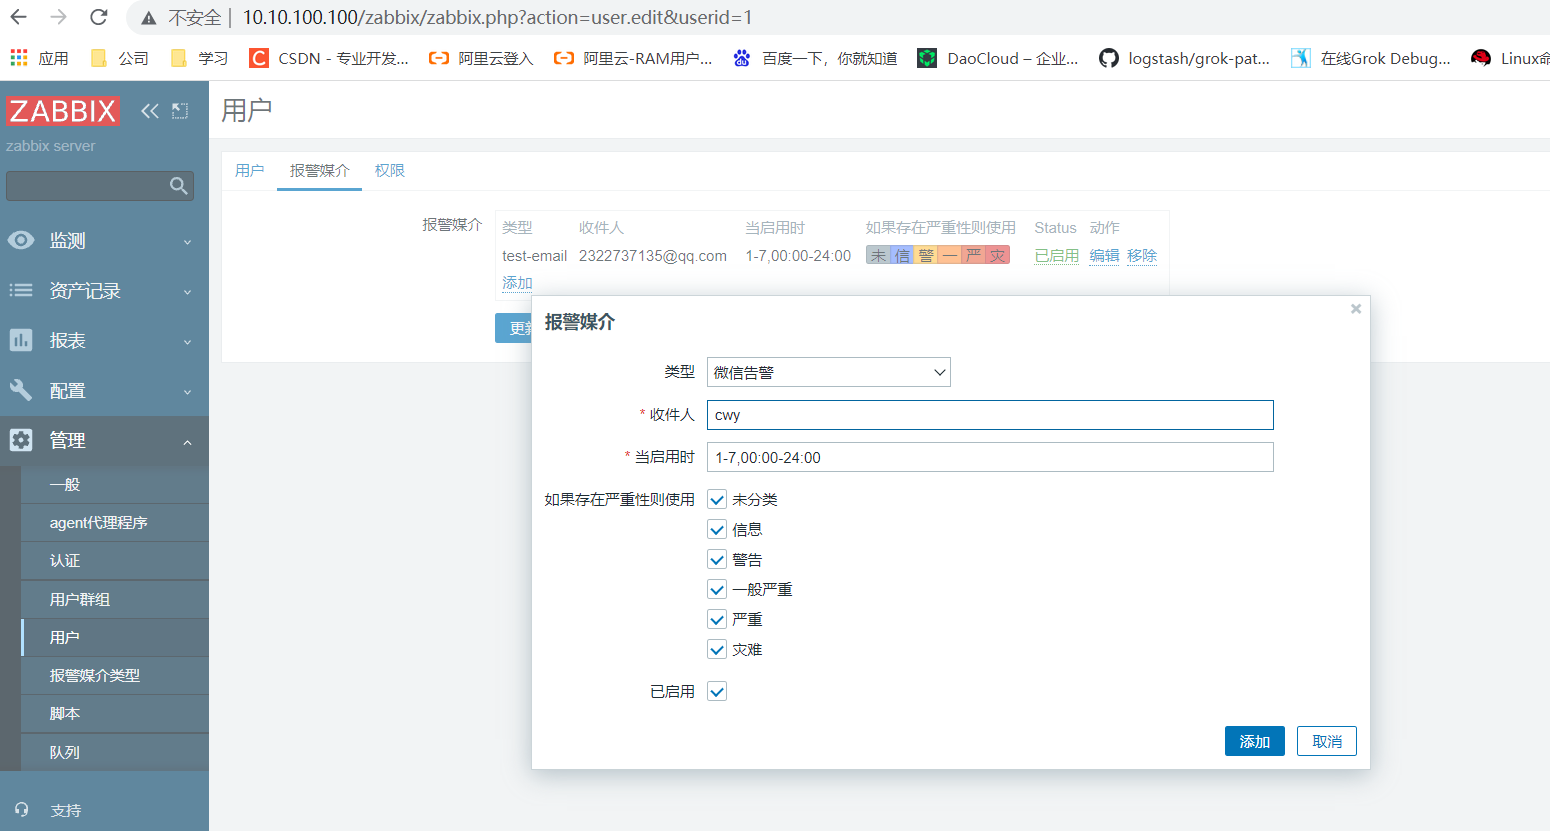
5.3.3 add contact alarm media
5.3.4 add wechat alarm action
5.3.5 configuration failure operation
5.3.6 configuration recovery operation
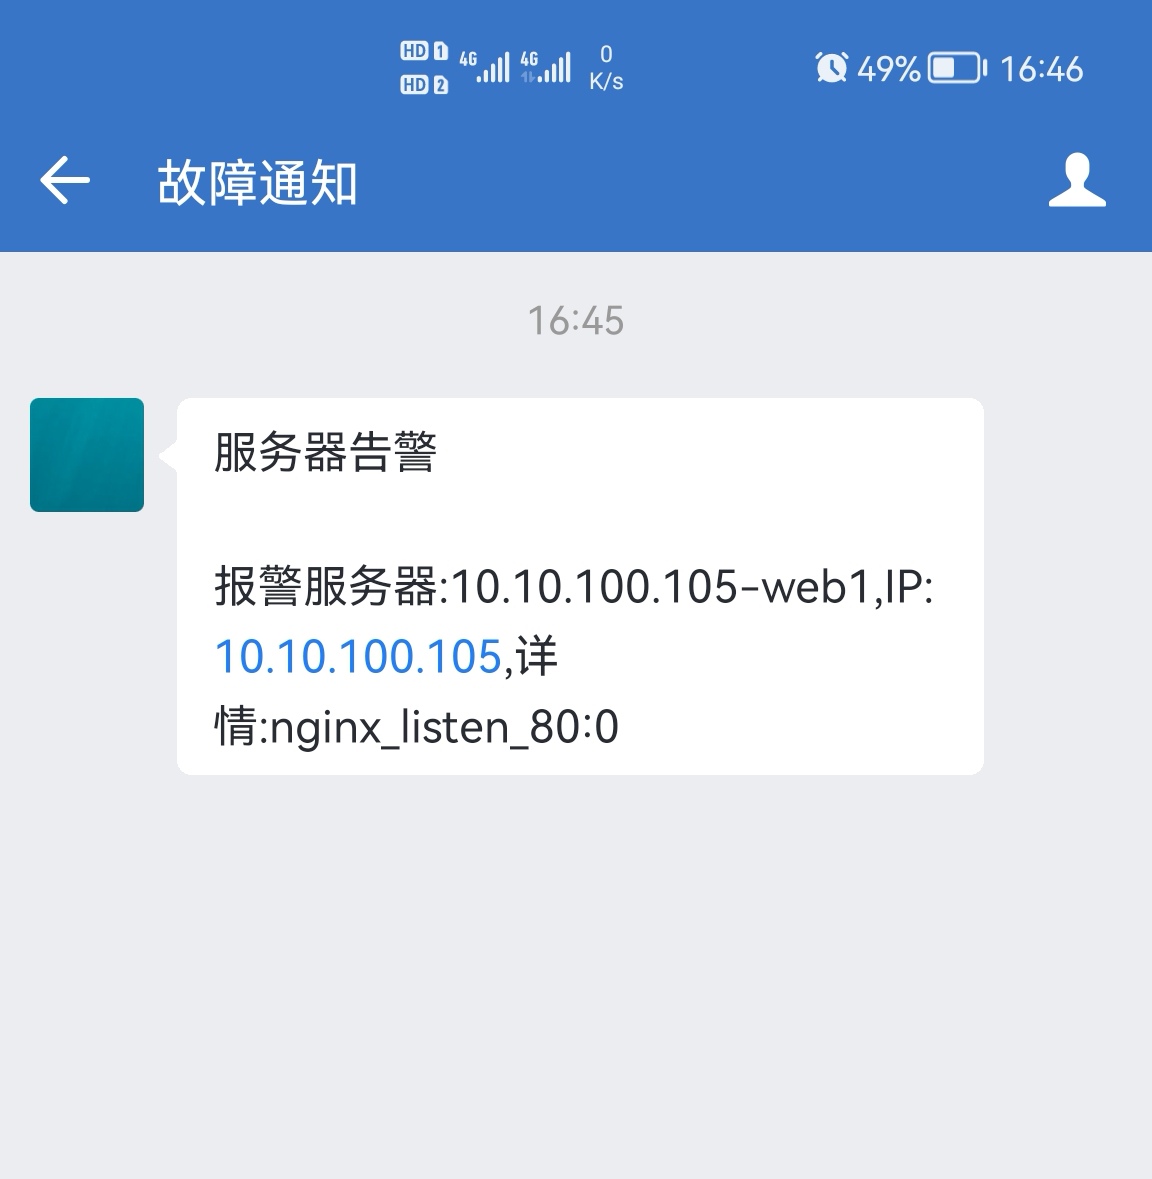
5.4 test wechat alarm
root@web1:~# systemctl stop nginx