Article directory
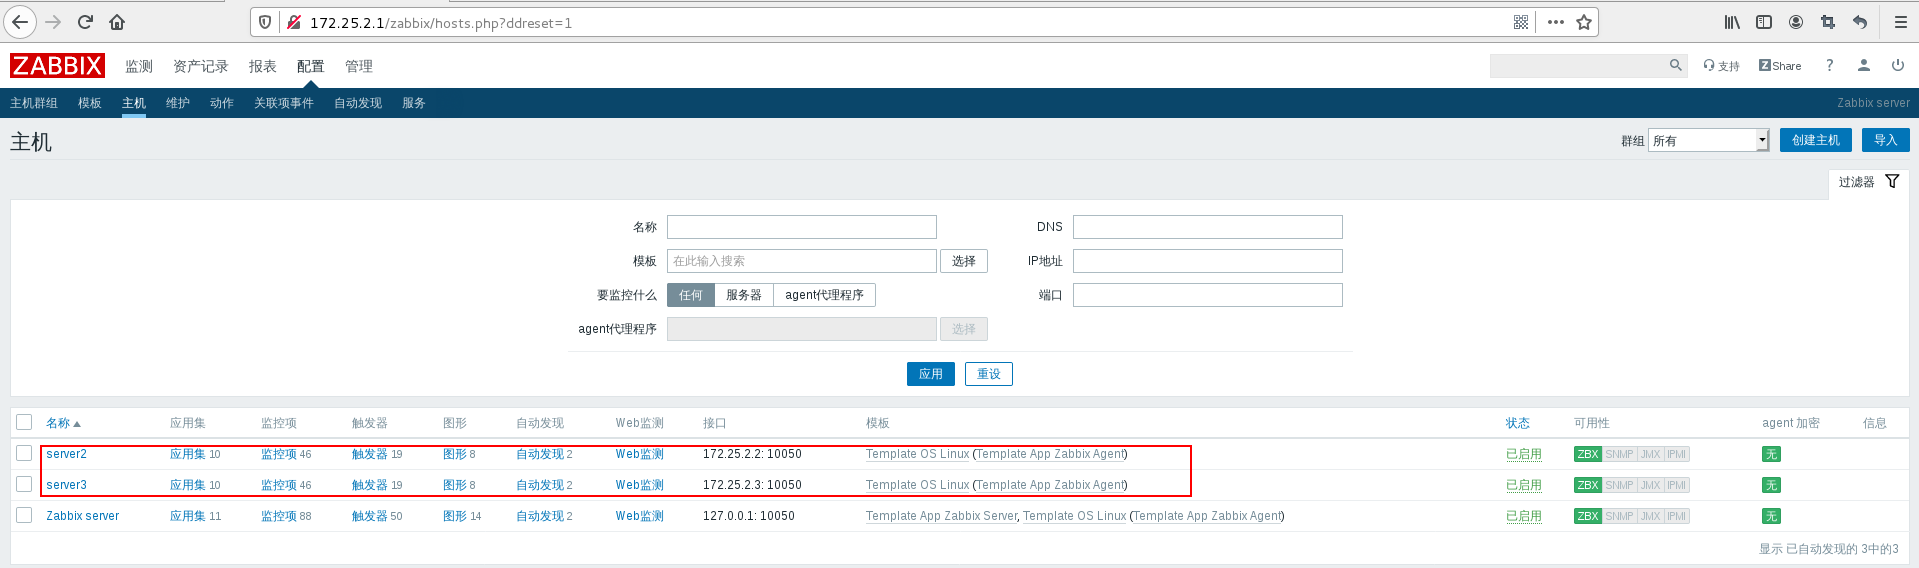
This experiment is based on the previous one, and has monitored server2 and server3
1, zabbix monitoring httpd service
httpd is the monitoring module of zabbix
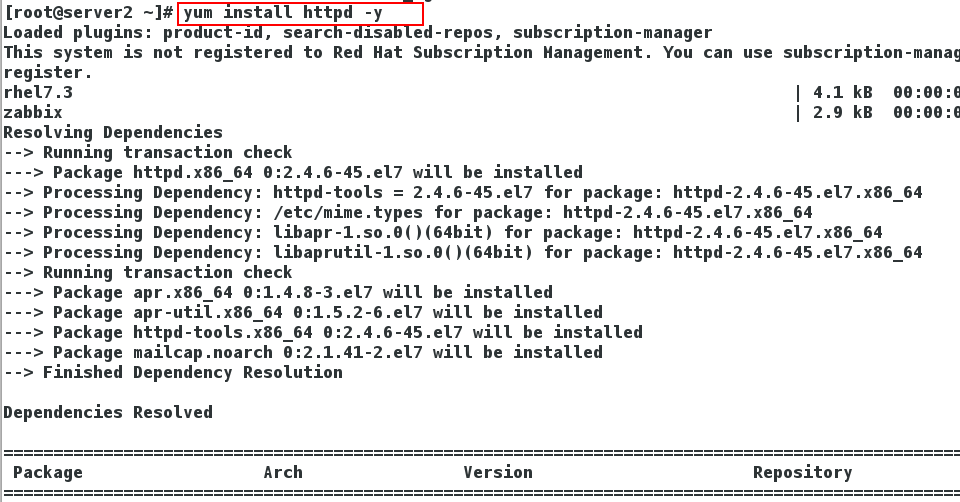
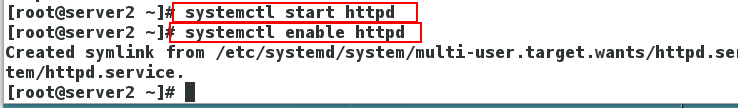
1. Install apache on server2 and start the service
[root@server2 zabbix]# yum install httpd -y
[root@server2 zabbix]# systemctl start httpd
[root@server2 zabbix]# systemctl enable httpd
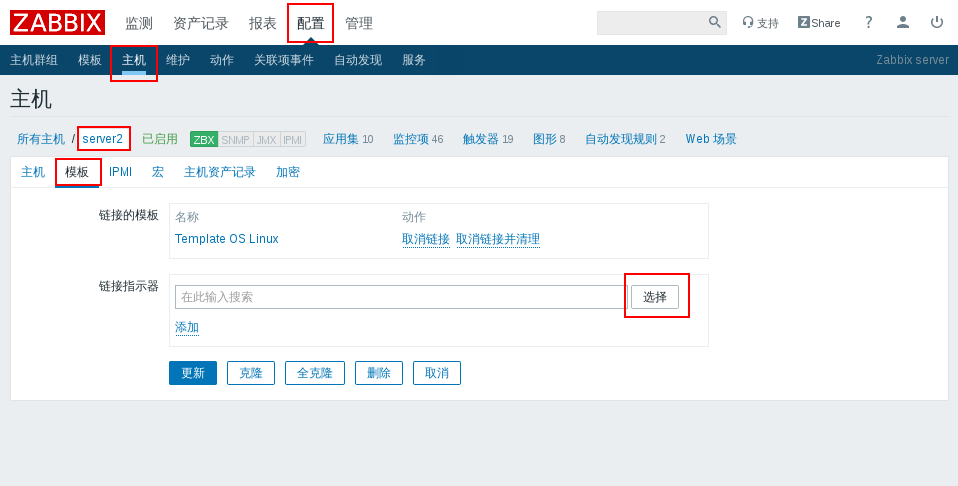
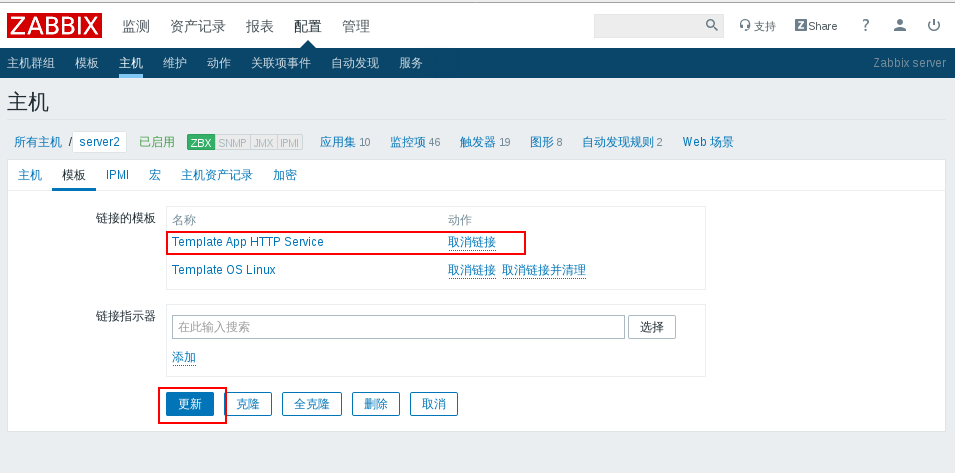
2. Then set it on the web interface:
Configuration - > host - > server2 - > template - > Select - > template app HTTP Service - > Add - > Update
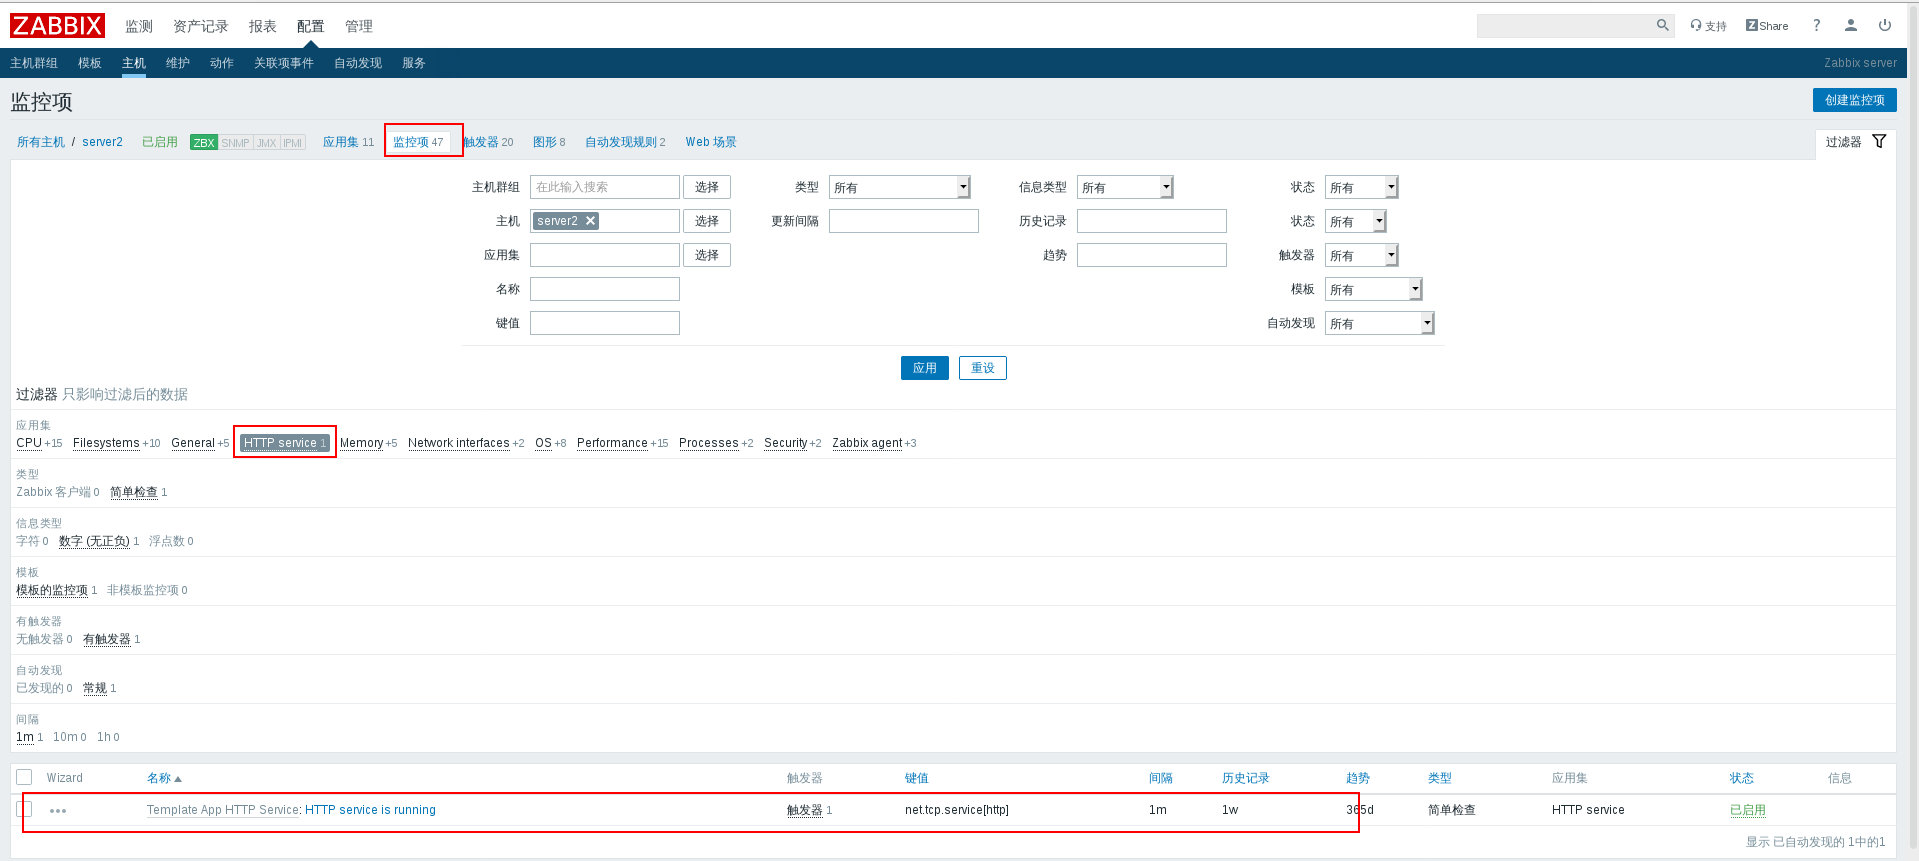
 Click the monitoring item of server2 to see that the http service is running
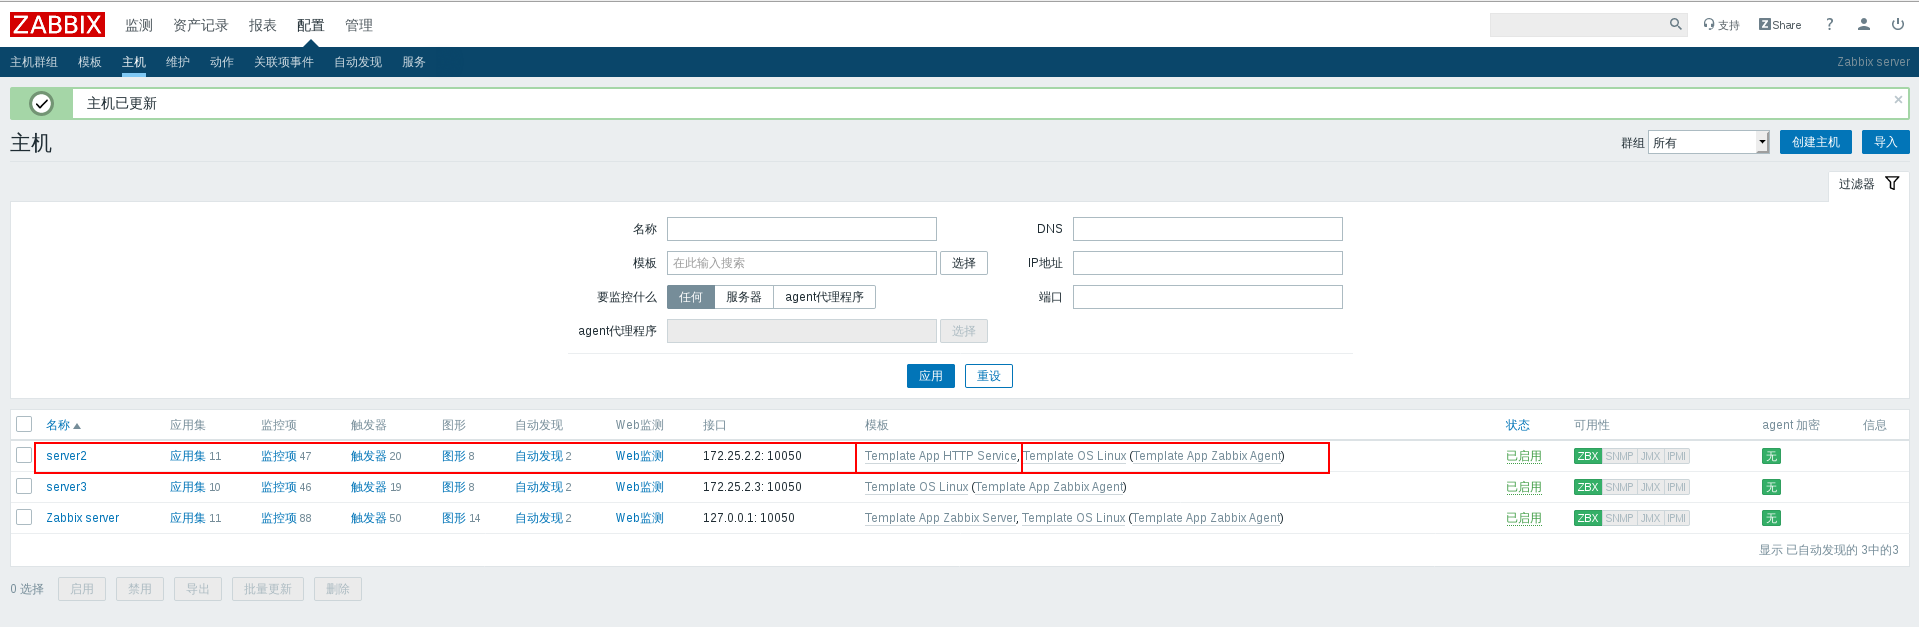
It can be seen that the trigger of server2 host has one more trigger of httpd service, which is the trigger of port. zabbix detects httpd service through port
2, zabbix monitoring nginx
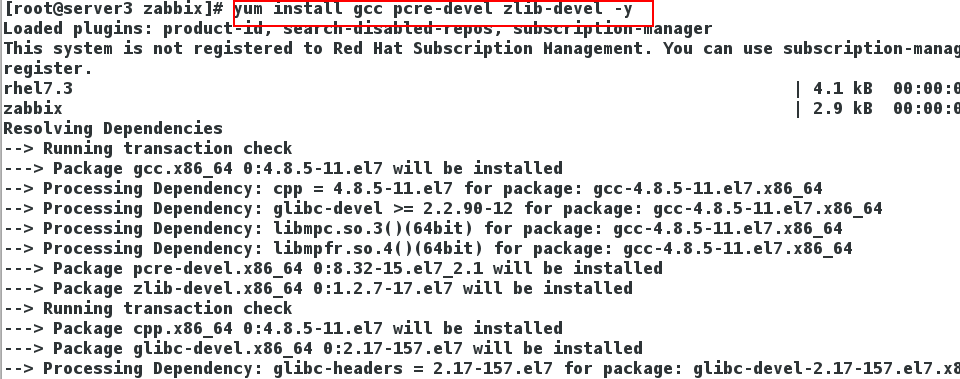
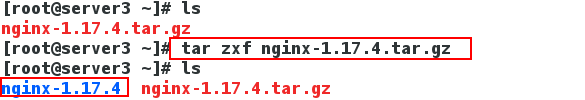
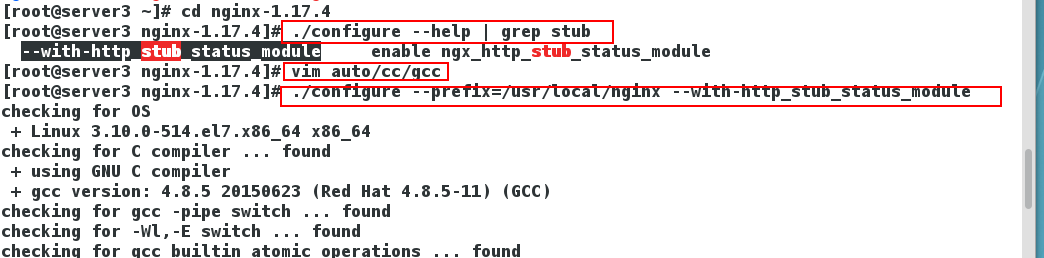
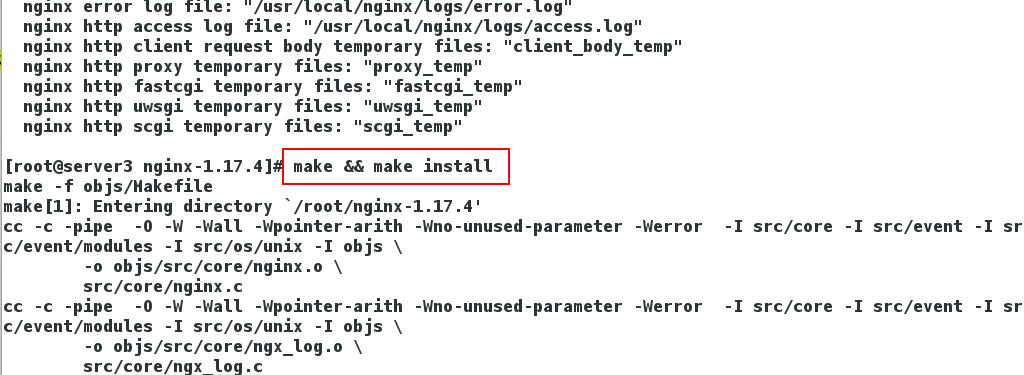
1. Install nginx service on the monitoring host server3, download the installation package and extract it, install the dependency software, compile and install it, and comment out the debug log.
root@server3 ~]# yum install gcc pcre-devel zlib-devel -y
[root@server3 ~]# tar zxf nginx-1.17.4.tar.gz
[root@server3 ~]# cd nginx-1.17.4
[root@server3 nginx-1.17.4]# ./configure --help | grep stub
  --with-http_stub_status_module     enable ngx_http_stub_status_module
[root@server3 nginx-1.17.4]# vim auto/cc/gcc
[root@server3 nginx-1.17.4]# ./configure --prefix=/usr/local/nginx --with-http_stub_status_module
[root@server3 nginx-1.17.4]# make && make install
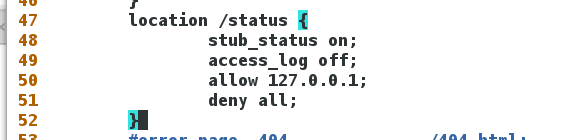
2. Modify the nginx configuration file, add a module to the nginx configuration file for view detection of web page status, and start the nginx service
[root@server3 nginx]# vim /usr/local/nginx/conf/nginx.conf
 48         location /status {
 49                 stub_status on;    #Turn on the module
 50                 access_log off;    #Turn off logging
 51                 allow 127.0.0.1;   #White list Local access only
 52                 deny all;
 53         }

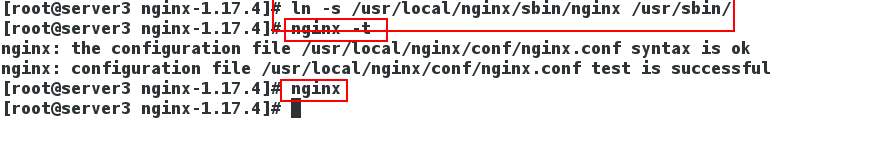
[root@server3 nginx-1.17.4]# ln -s /usr/local/nginx/sbin/nginx /usr/sbin/
[root@server3 nginx-1.17.4]# nginx -t
[root@server3 nginx-1.17.4]# nginx
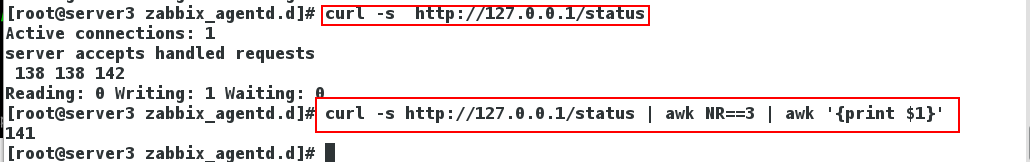
3. Test whether nginx service is deployed successfully in server 3 native curl 127.0.0.1/status
| Active connections | Number of active connections |
|---|---|
| accepts | Number of requests received (not necessarily answered) |
| handled | Determine the number of requests to establish a three-way handshake |
| requests | Number of requests processed |

curl -s http://localhost/status | grep Active | awk '{print $3}'

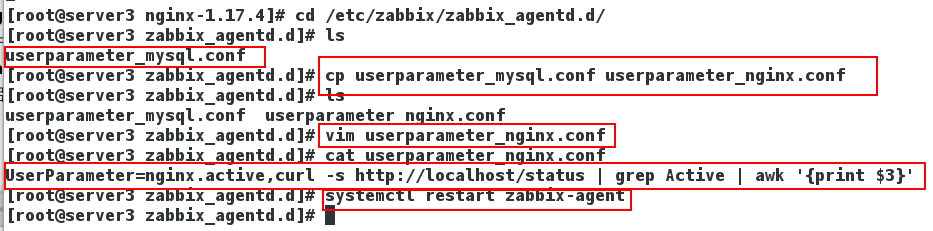
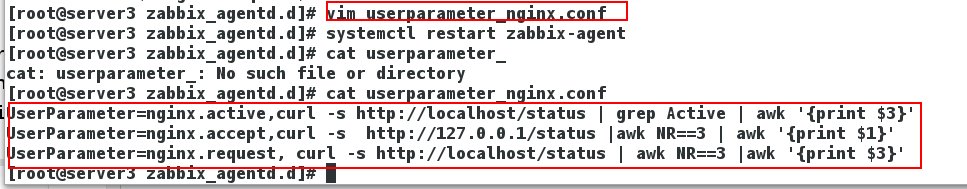
4. Modify the configuration file / etc / ZABBIX / ZABBIX ﹣ agentd.d/userparameter ﹣ nginx.conf of server3 to create monitoring items of nginx
[root@server3 ~]# cd /etc/zabbix/zabbix_agentd.d/
[root@server3 zabbix_agentd.d]# ls
userparameter_mysql.conf
[root@server3 zabbix_agentd.d]# cp userparameter_mysql.conf userparameter_nginx.conf    #take mysql The monitoring template of the service is provided to nginx Copy of service
[root@server3 zabbix_agentd.d]# vim userparameter_nginx.conf     #Edit profile
UserParameter=nginx.active,curl -s http://localhost/status | grep Active | awk '{print $3}'     #Get the number of active connections. nginx.active is the key value, and the number of connections obtained is the value value value
[root@server3 zabbix_agentd.d]# systemctl restart zabbix-agent   #Modify complete restart service.
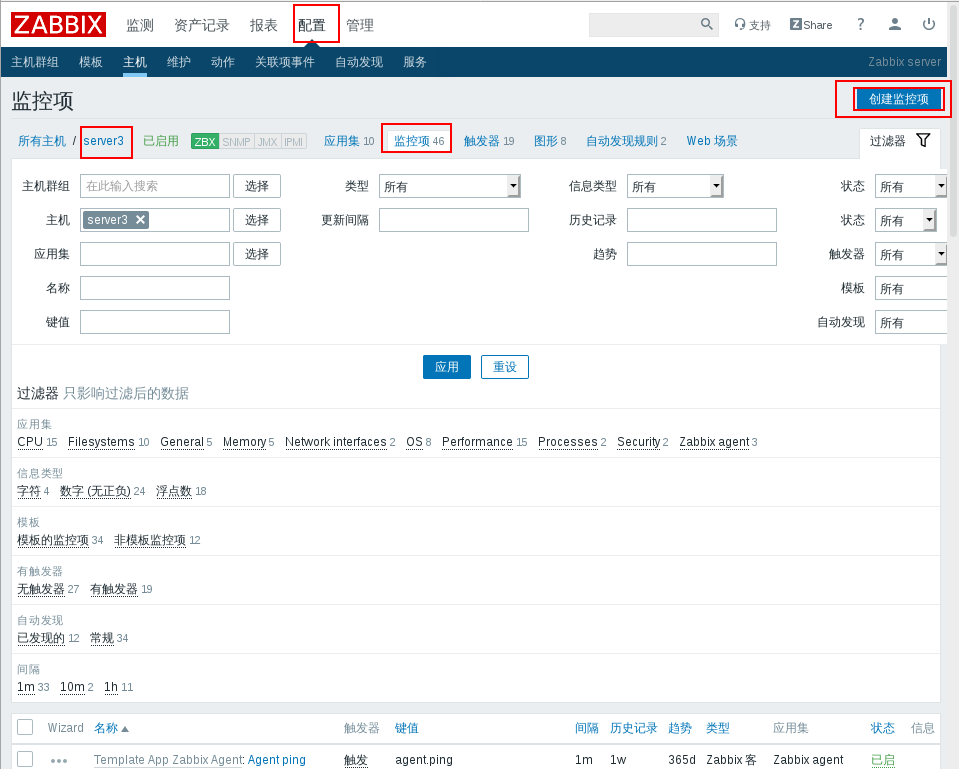
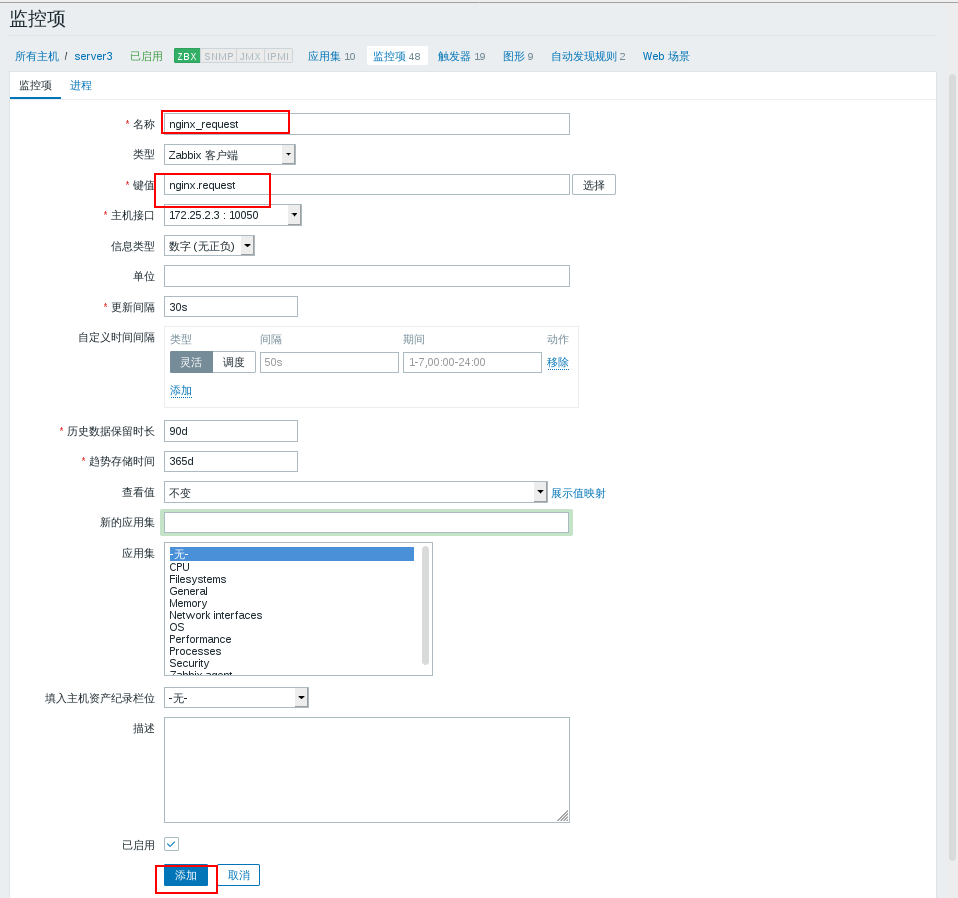
5. In the web interface, server 3 adds nginx monitoring
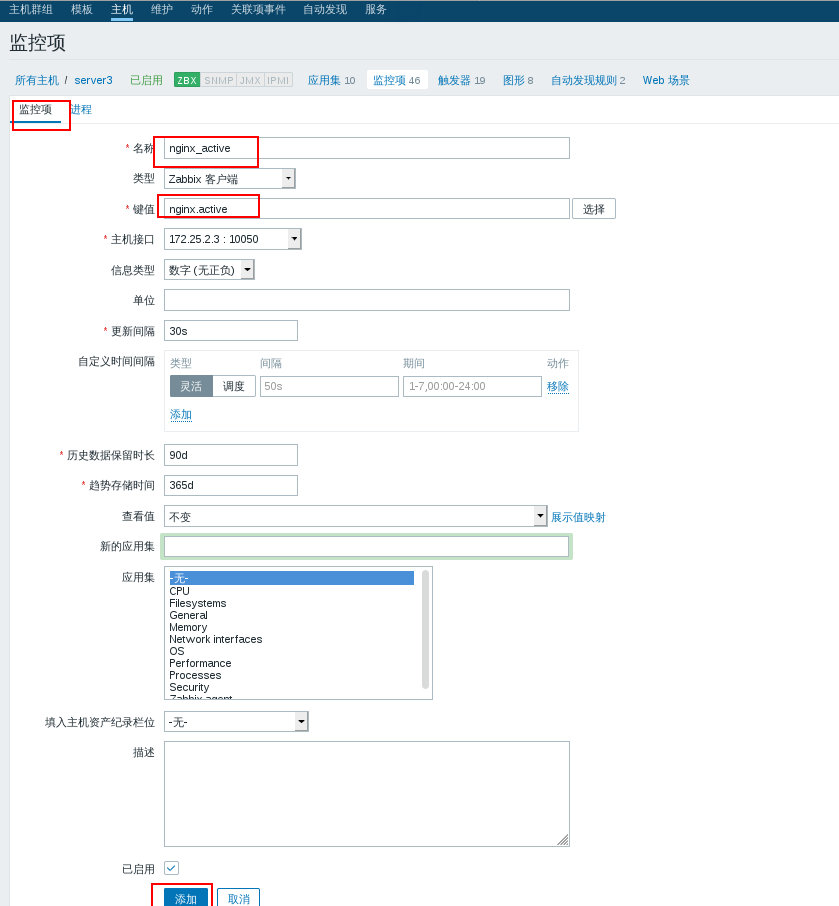
[Select server3 host] - > [create monitoring item]
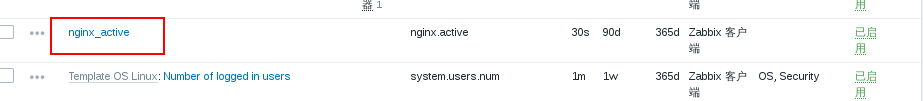
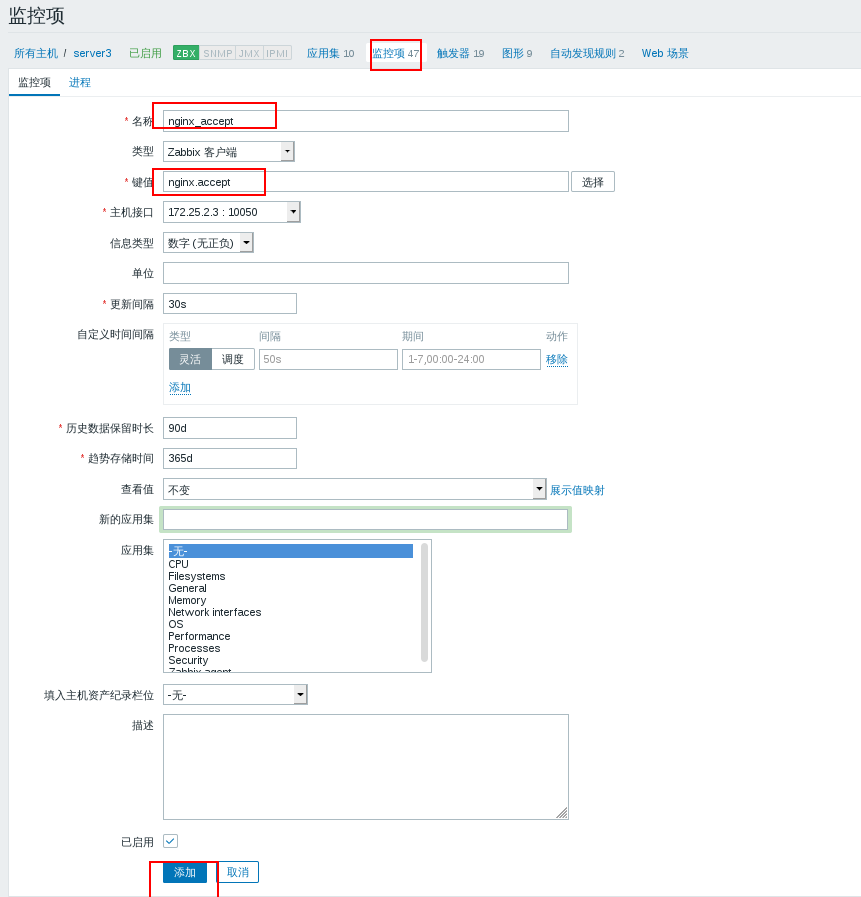
The name of the monitoring item can be customized, and the key value must be the same as that in the server3 configuration file
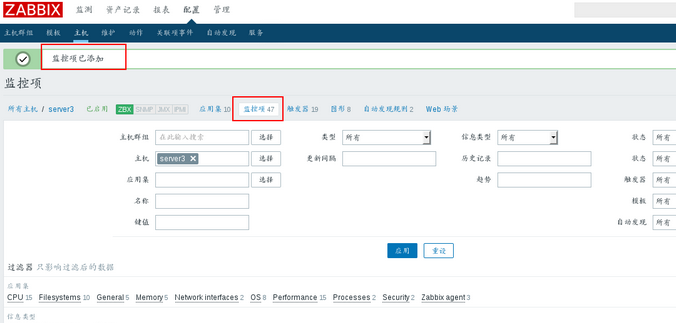
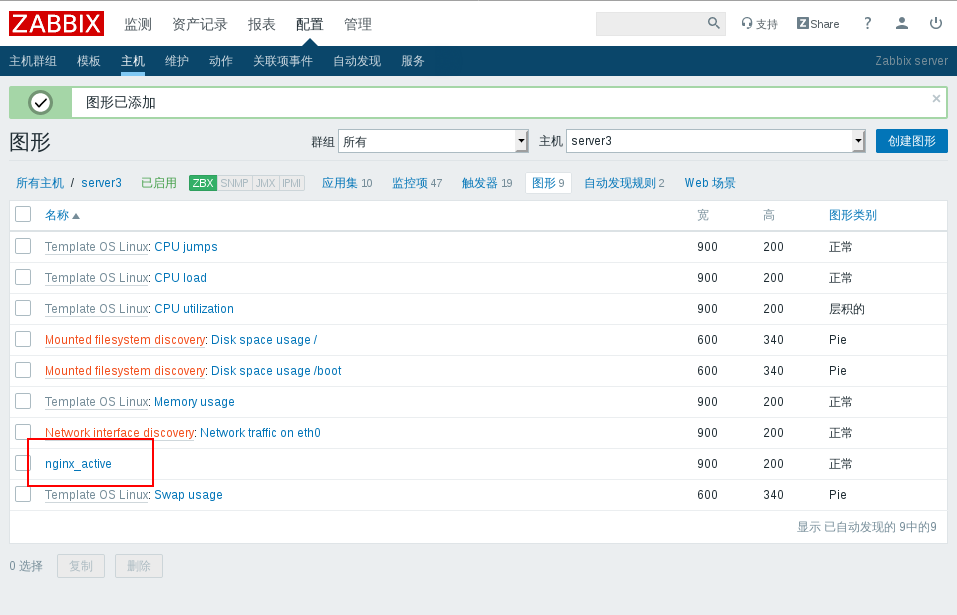
At this point, you can see the added in the monitor item.
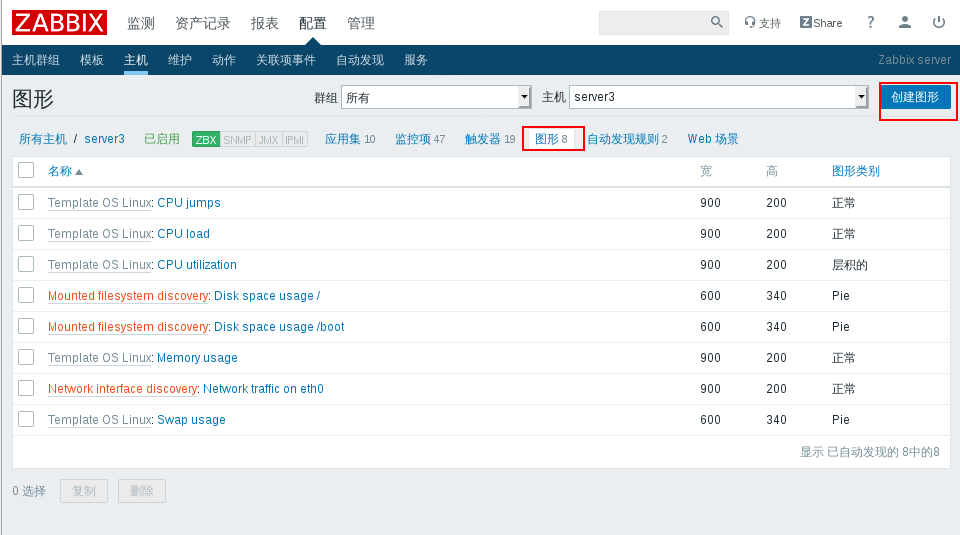
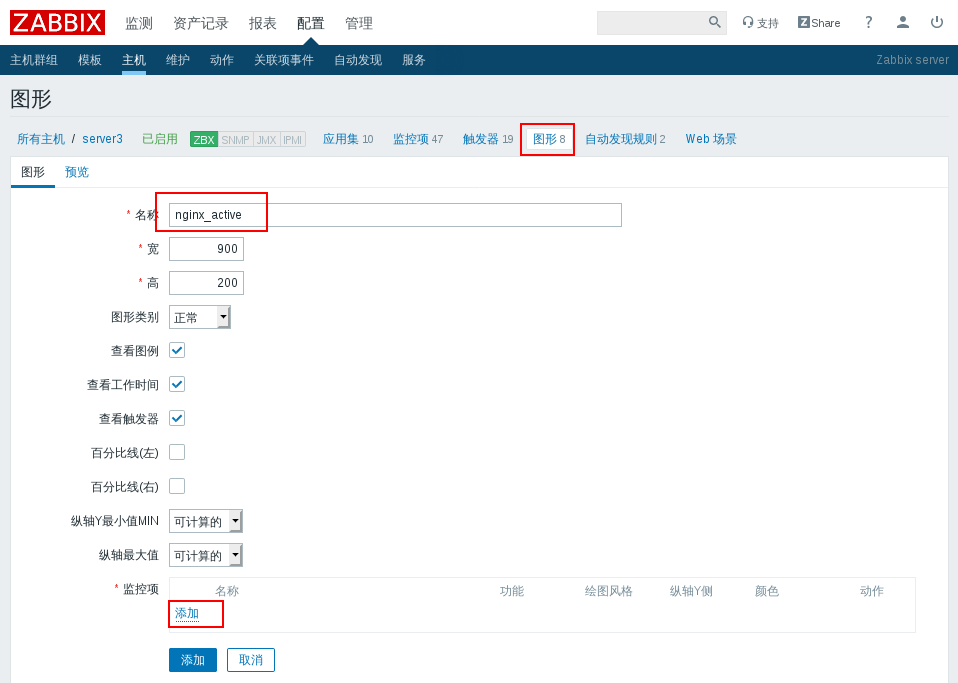
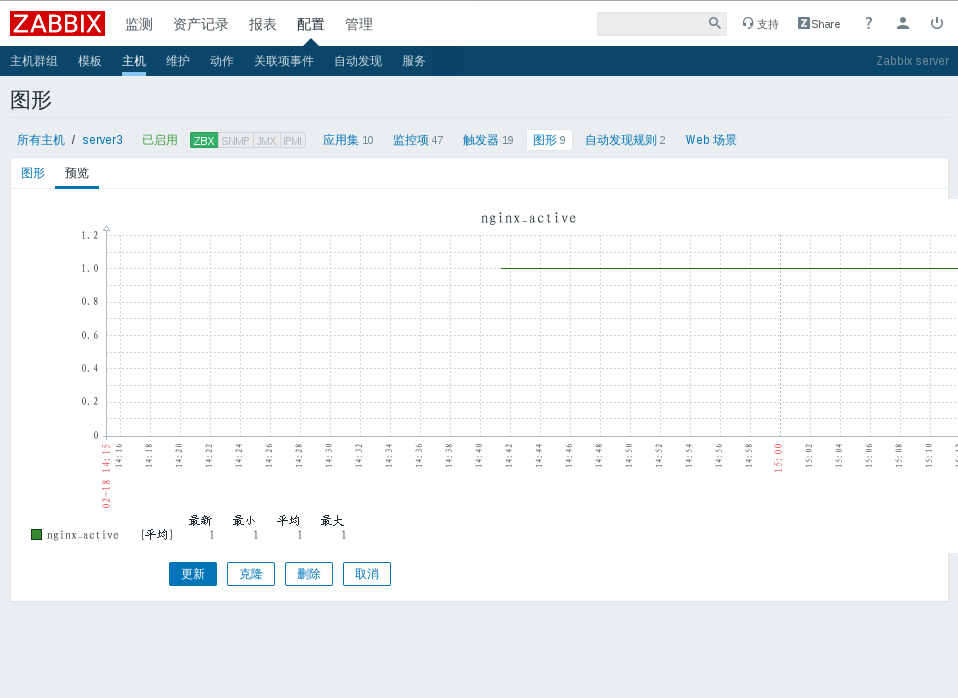
Create a drawing to import the added monitoring items

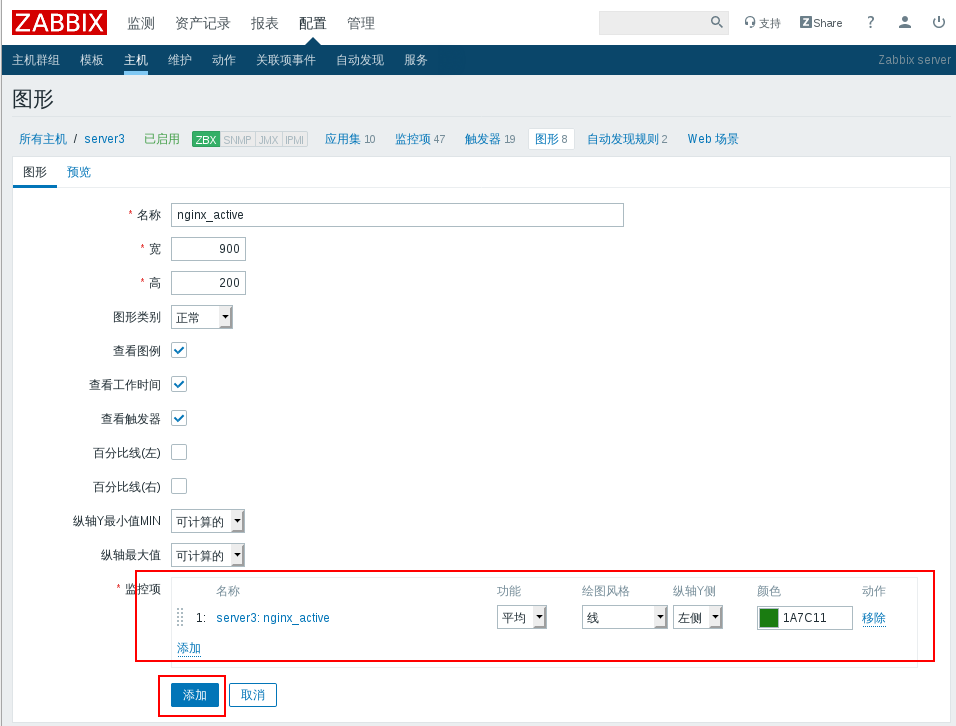
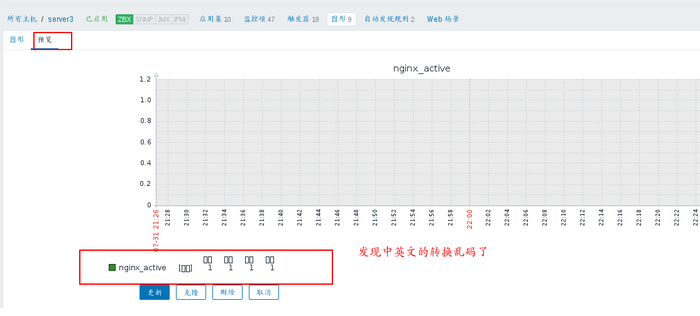
At this point, we view the monitoring graph
At this point, we will find the disorder.
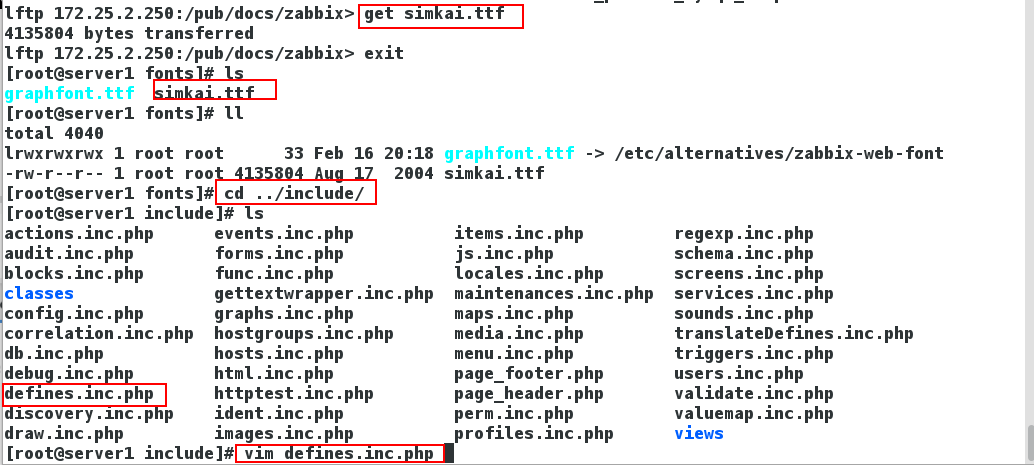
Font adjustment of web interface
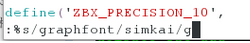
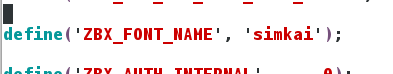
[root@server1 ~]# cd /usr/share/zabbix/fonts/
[root@server1 fonts]# ls
graphfont.ttf simkai.ttf
[root@server1 fonts]# cd ..
[root@server1 zabbix]# cd include/
[root@server1 include]# vim defines.inc.php
:%s/graphfont/simkai/g    #take graphfont Replace with simkai
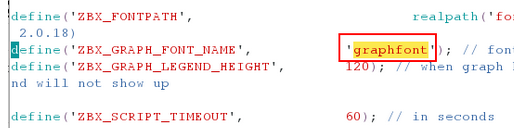
At this point, refresh the web page, you will find that there is no garbled code.
zabbix? Get is a command of zabbix server. It is used to check whether the configuration of agent is correct. It is very convenient to know whether the key can get data normally. It is especially useful when testing custom monitoring
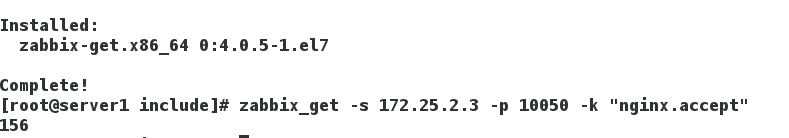
Download ZABBIX get from server1 to get the number of active connections of server3
[root@server1 include]# yum install zabbix-get -y
[root@server1 include]# zabbix_get -s 172.25.2.3 -p 10050 -k "nginx.active"
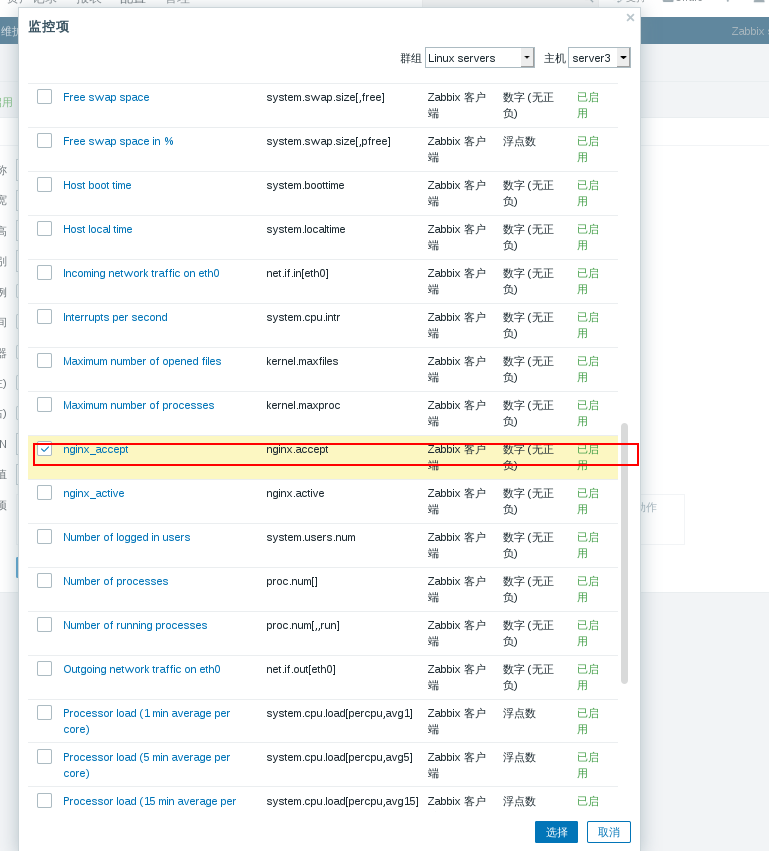
Add a new monitoring item nginx.accept
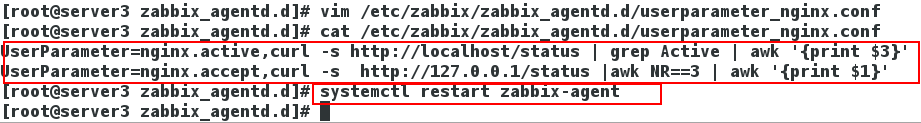
Edit the monitoring file userparameter? Nginx.conf of nginx, and add the key value pair to be obtained
[root@server3 zabbix_agentd.d]# vim userparameter_nginx.conf
UserParameter=nginx.active,curl -s http://localhost/status | grep Active | awk '{print $3}'
UserParameter=nginx.accept, curl -s http://localhost/status | awk NR==3 |awk '{print $1}'
[root@server3 zabbix_agentd.d]# systemctl restart zabbix-agent
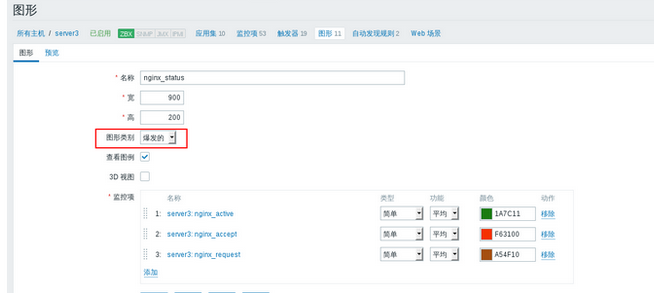
Create monitor item
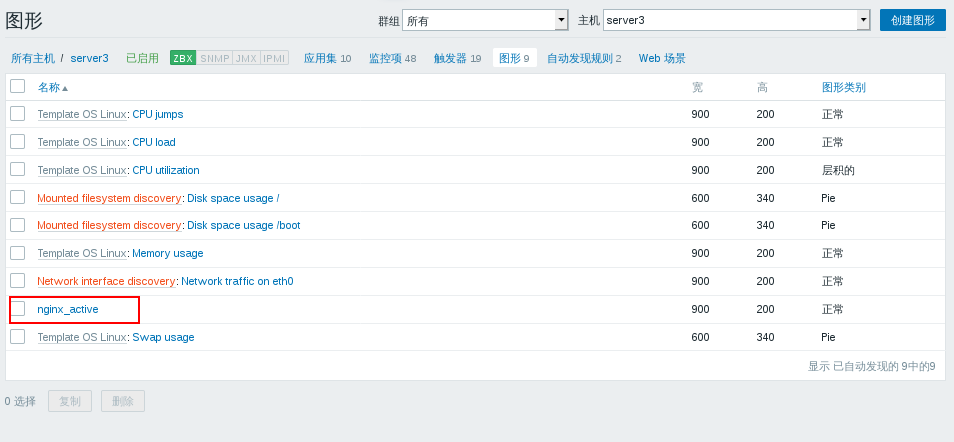
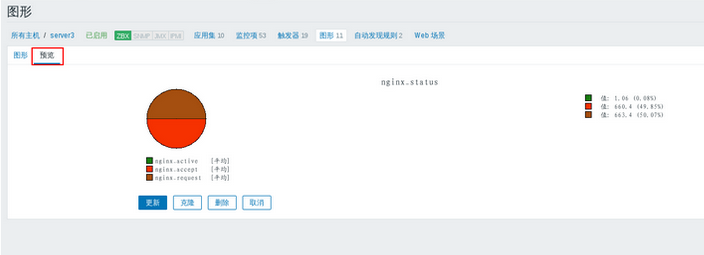
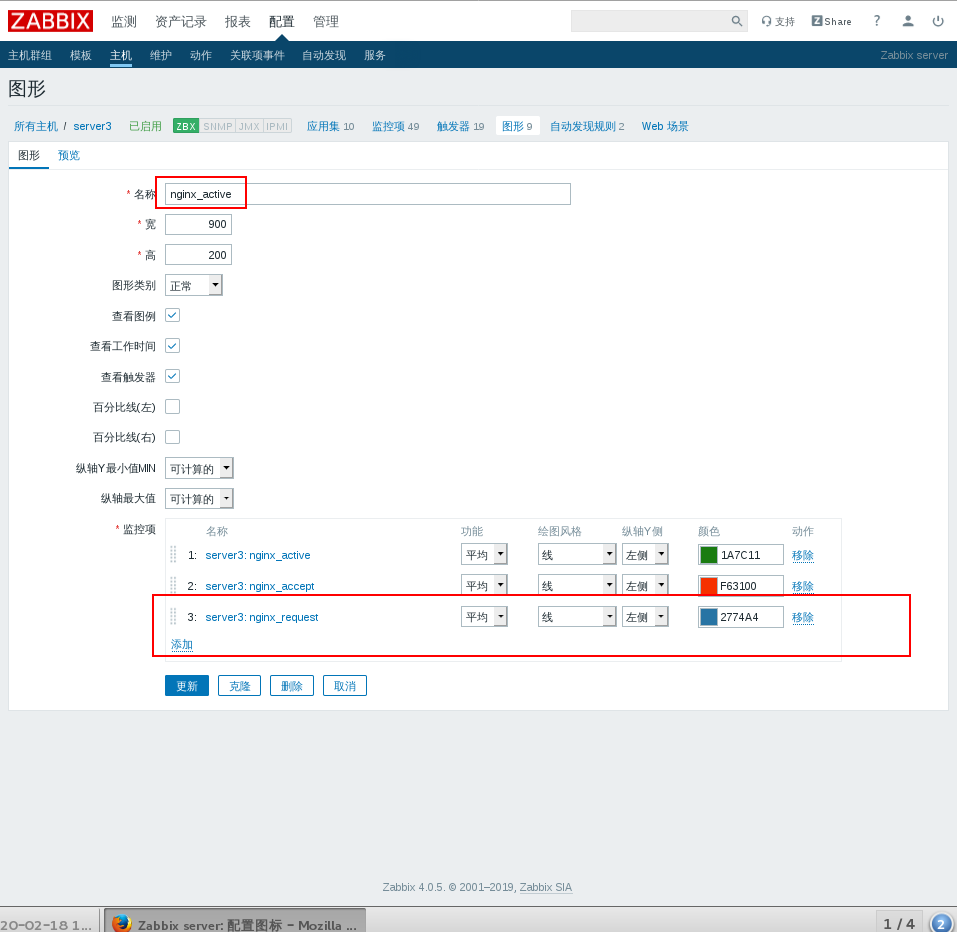
Add the new monitoring items to the original nginx active graph, and put the three monitoring items in the same coordinate graph for comparison
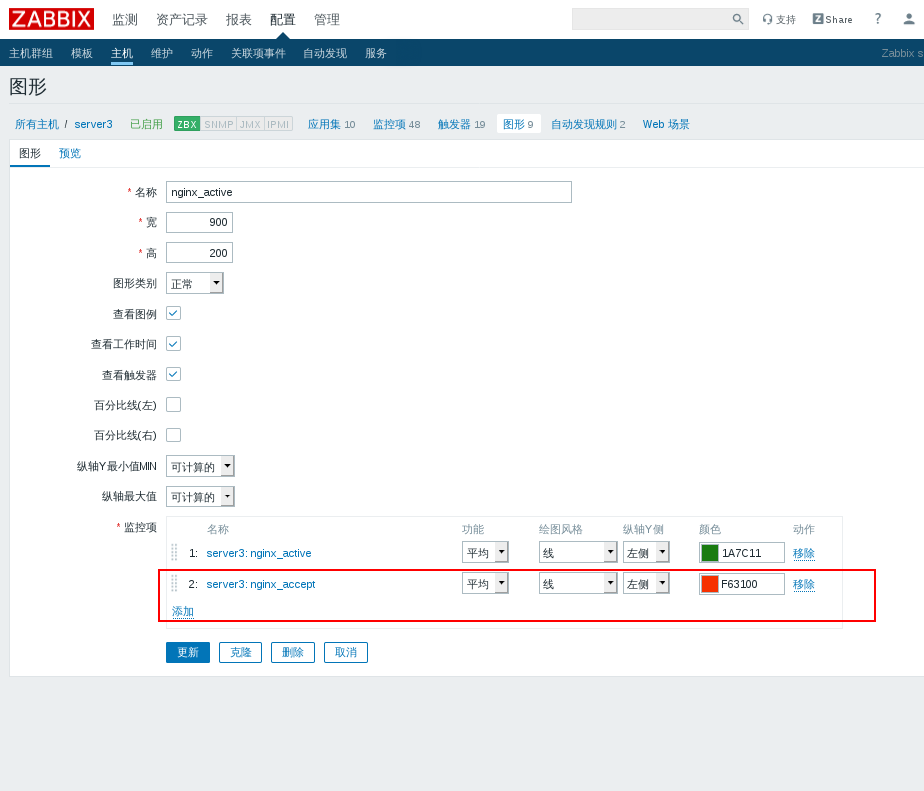
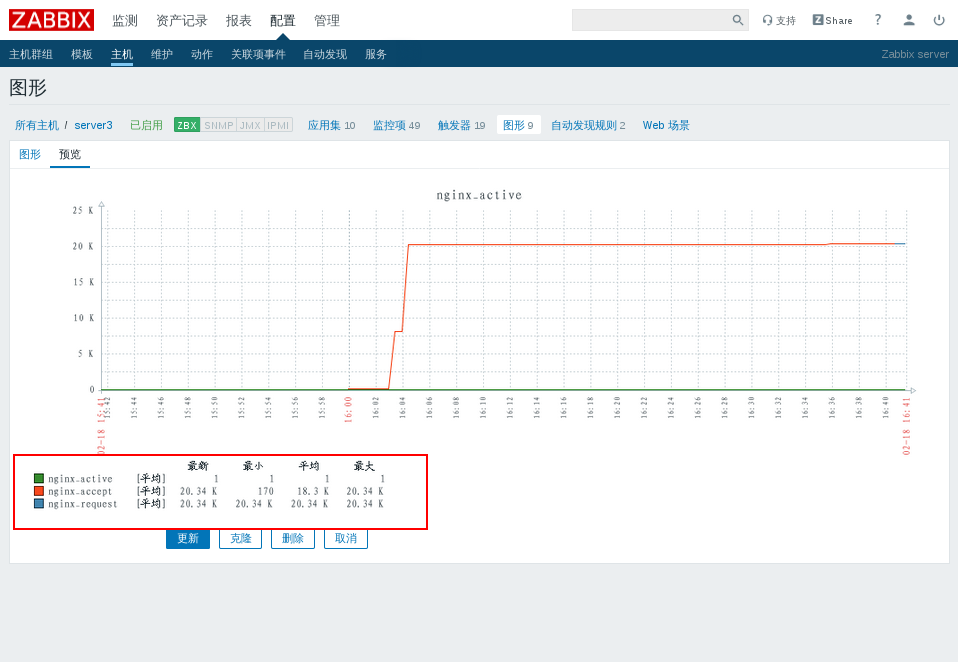
Add successfully, click Update to view the graph
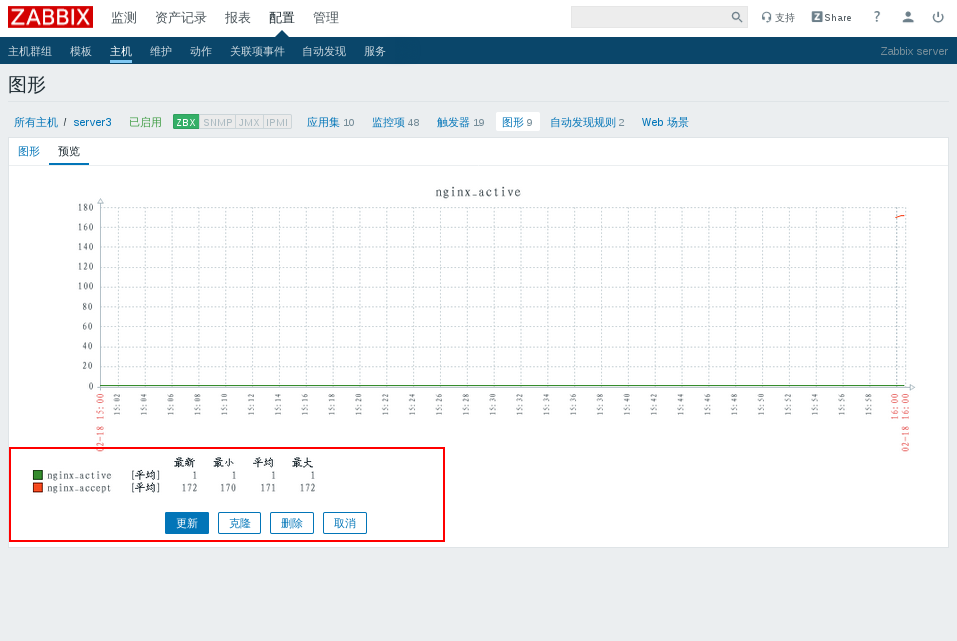
In order to display the effect of graphical interface more clearly, we conduct stress test by ourselves through server3 and visit ourselves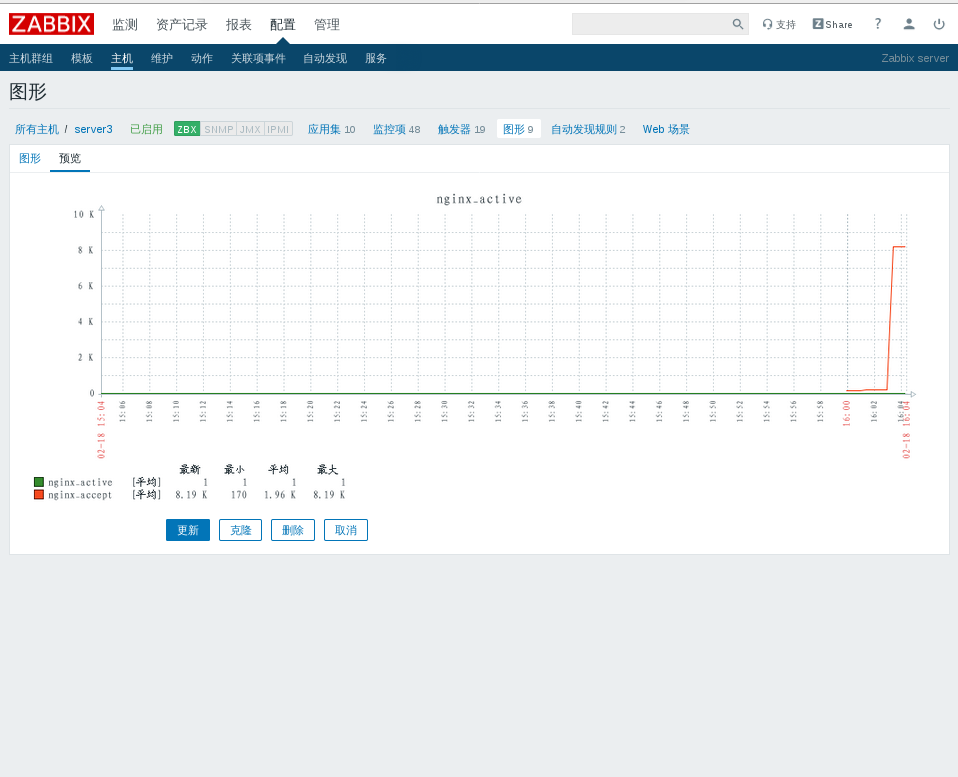
In the same process, we add another item:
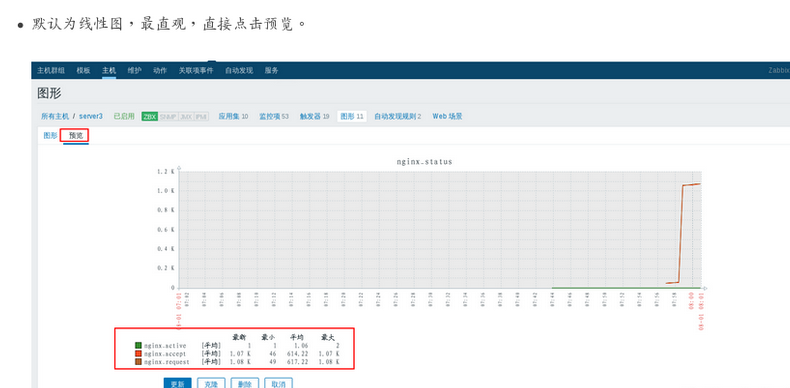
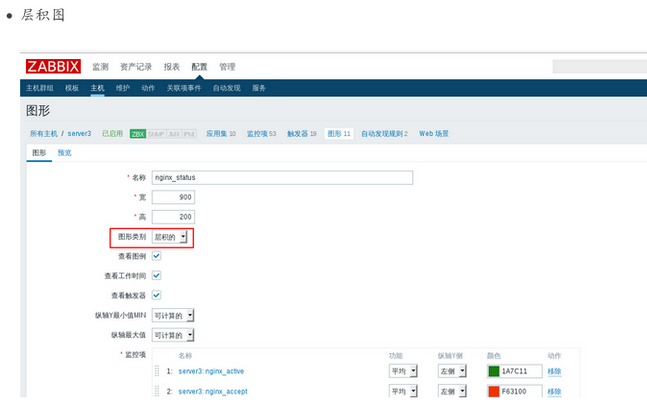
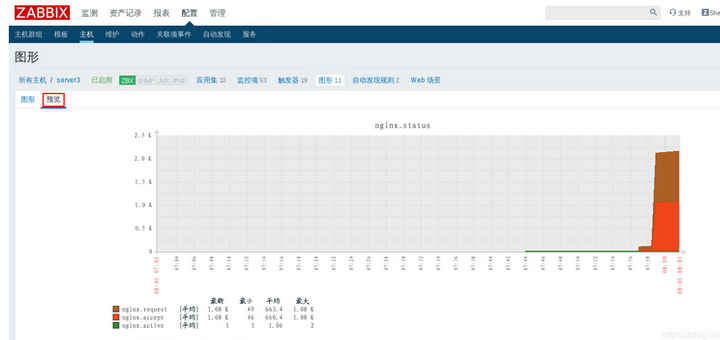
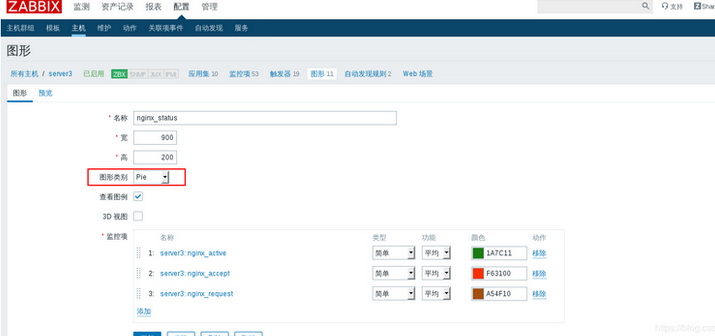
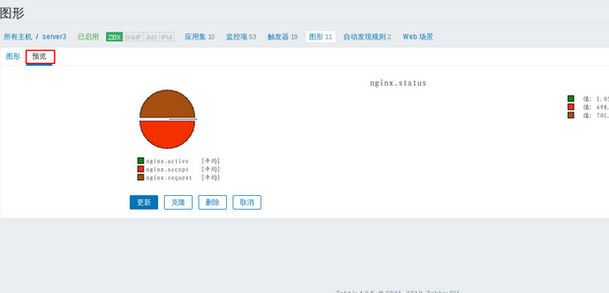
3, Different types of picture switching