Author: a handsome young man
source: http://clsn.io
Chapter 1 zabbix monitoring
1.1 why monitor
When necessary, remind us in advance that there is a problem with the server
When something goes wrong, you can find the root of the problem
Website / server availability
1.1.1 website availability
In the high reliability of software system (also known as availability, described in English as HA, High Available), there is a standard to measure its reliability - x 9, which represents the number 3 ~ 5. X 9 indicates the ratio of the system's normal use time to the total time (1 year) during the use of the software system for 1 year. We can feel the reliability difference of X 9 at different levels through the following calculation.
    One 9: (1-90%) * 365 = 36.5 days, which means that the maximum possible business interruption time of the software system in one year of continuous operation is 36.5 days
    Two 9s: (1-99%) * 365 = 3.65 days, which means that the maximum possible business interruption time of the software system in one year of continuous operation is 3.65 days
    Three 9s: (1-99.9%) * 365 * 24 = 8.76 hours, indicating that the maximum possible business interruption time of the software system in continuous operation for 1 year is 8.76 hours.
    Four 9s: (1-99.99%) * 365 * 24 = 0.876 hours = 52.6 minutes, indicating that the maximum possible business interruption time of the software system in one year of continuous operation is 52.6 minutes.
    Five 9s: (1-99.999%) * 365 * 24 * 60 = 5.26 minutes, which means that the maximum possible business interruption time of the software system in one year of continuous operation is 5.26 minutes.
    6 9s: (1-99.9999%) * 365 * 24 * 60 * 60 = 31 seconds, indicating that the maximum possible service interruption time of the software system in continuous operation for 1 year is 31 seconds
1.2 what is monitored
Monitor everything that needs to be monitored. As long as you can think of it and implement it with commands, you can monitor it
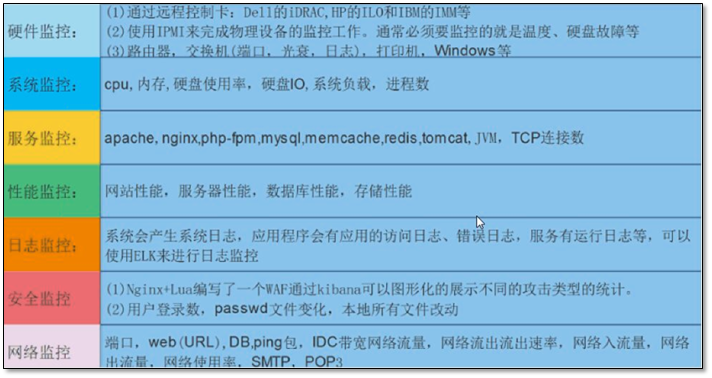
1.2.1 monitoring scope
1.3 how to monitor
1.3.1 remote management server
If you want to remotely manage the server, you have a remote management card, such as Dell idRAC, HP ILO, IBM IMM
1.3.2 monitoring hardware
Check the hardware temperature / fan speed. If the computer has Master Lu, the server has ipmitool.
Using ipmitool to realize the command line remote management of the server
yum -y install OpenIPMI ipmitool  #->IPMI can succeed in the physical machine, but not in the virtual machine

[root@KVM ~]# ipmitool sdr type Temperature
Temp             | 01h | ns  |  3.1 | Disabled
Temp             | 02h | ns  |  3.2 | Disabled
Temp             | 05h | ns  | 10.1 | Disabled
Temp             | 06h | ns  | 10.2 | Disabled
Ambient Temp     | 0Eh | ok  |  7.1 | 22 degrees C
Planar Temp      | 0Fh | ns  |  7.1 | Disabled
IOH THERMTRIP    | 5Dh | ns  |  7.1 | Disabled
CPU Temp Interf  | 76h | ns  |  7.1 | Disabled
Temp             | 0Ah | ns  |  8.1 | Disabled
Temp             | 0Bh | ns  |  8.1 | Disabled
Temp             | 0Ch | ns  |  8.1 | Disabled
1.3.3 viewing cpu related
lscpu,uptime,top,htop vmstat mpstat
htop needs to be installed, and the installation depends on the epel source.
[znix@clsn ~]$lscpu
Architecture:          x86_64
CPU op-mode(s):        32-bit, 64-bit
Byte Order:            Little Endian
CPU(s):                1
On-line CPU(s) list:   0
Thread(s) per core:    1
Core(s) per socket:    1
Socket(s):             1
NUMA node(s):          1
Vendor ID:             GenuineIntel
CPU family:            6
Model:                 85
Model name:            Intel(R) Xeon(R) Platinum 8163 CPU @ 2.50GHz
Stepping:              4
CPU MHz:               2494.150
BogoMIPS:              4988.30
Hypervisor vendor:     KVM
Virtualization type:   full
L1d cache:             32K
L1i cache:             32K
L2 cache:              1024K
L3 cache:              33792K
NUMA node0 CPU(s):     0
1.3.4 is there enough memory available
free
[znix@clsn ~]$free -h
             total       used       free     shared    buffers     cached
Mem:          996M       867M       128M       712K       145M       450M
-/+ buffers/cache:       271M       725M
Swap:         1.0G         0B       1.0G
1.3.5 how much disk is available
df,dd,iotop
[znix@clsn ~]$df -h
Filesystem      Size  Used Avail Use% Mounted on
/dev/vda1        40G   24G   15G  62% /
tmpfs           499M   20K  499M   1% /dev/shm
/dev/vdb1        20G  4.4G   15G  24% /data
1.3.6 monitoring network
iftop nethogs
iftop   Monitor inter host traffic  -i Specify monitoring network card
nethogs Monitor process traffic
1.4 overview of monitoring tools
mrtg flow monitoring plot
nagios monitoring
cacti Flow monitoring plot
zabbix Monitoring + plotting
1.5 zabbix introduction
Zabbix is a network monitoring and management system developed by Alexei Vladishev, which is based on server client architecture. It can be used to monitor the status of various network services, servers and network machines.
Use various database ends such as MySQL, PostgreSQL, SQLite, Oracle or IBM DB2 to store data. The Server side is based on C language, and the Web management side frontend is based on PHP. Zabbix can monitor in many ways. You can only use Simple Check without installing the Client side, and you can also perform life and death monitoring based on SMTP or HTTP... Various protocols.
After Zabbix Agent is installed on clients such as UNIX and windows, various statuses such as CPU Load, network usage and hard disk capacity can be monitored. Even if no Agent is installed in the monitoring object, Zabbix can monitor the target via SNMP, TCP, ICMP, IPMI, SSH and telnet.
In addition, Zabbix includes various Item warning functions such as XMPP.
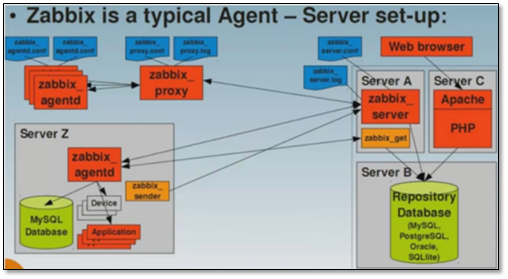
1.5.1 composition of ZABBIX
ZABBIX official website: https://www.zabbix.com
zabbix mainly consists of two parts: zabbix server and zabbix agent
zabbix proxy is used to manage other agents as agents
1.5.2 zabbix monitoring scope
² Hardware monitoring: Zabbix IPMI Interface
² System monitoring: Zabbix Agent Interface
² Java monitoring: ZabbixJMX Interface
² Network device monitoring: Zabbix SNMP Interface
² Application service monitoring: Zabbix Agent UserParameter
² MySQL database monitoring: percona monitoring pldlgins
² URL monitoring: Zabbix Web Monitoring
Chapter 2 installing zabbix
2.1 environmental inspection
[root@m01 ~]# cat /etc/redhat-release
CentOS Linux release 7.4.1708 (Core)

[root@m01 ~]# uname -r
3.10.0-693.el7.x86_64

[root@m01 ~]# getenforce
Disabled

[root@m01 ~]# systemctl status firewalld.service
● firewalld.service - firewalld - dynamic firewall daemon
   Loaded: loaded (/usr/lib/systemd/system/firewalld.service; disabled; vendor preset: enabled)
   Active: inactive (dead)
     Docs: man:firewalld(1)
2.2.1 selection of installation mode
Compilation and installation (many services and complex environment)
yum install (clean environment)
Using Yum requires mirroring the yum source http://www.cnblogs.com/clsn/p/7866643.html
2.2.2 server side quick installation script
#!/bin/bash
#clsn

#Note: when the network conditions are good, you can not create your own yum source
# echo '10.0.0.1 mirrors.aliyuncs.com mirrors.aliyun.com repo.zabbix.com' >> /etc/hosts

#Install zabbix source and aliyun YUM source
curl -o /etc/yum.repos.d/CentOS-Base.repo http://mirrors.aliyun.com/repo/Centos-7.repo
curl -o /etc/yum.repos.d/epel.repo http://mirrors.aliyun.com/repo/epel-7.repo
rpm -ivh http://repo.zabbix.com/zabbix/3.0/rhel/7/x86_64/zabbix-release-3.0-1.el7.noarch.rpm

#Installing zabbix
yum install -y zabbix-server-mysql zabbix-web-mysql

#Install and start the mariadb database
yum install -y  mariadb-server
systemctl start mariadb.service

#Create database
mysql -e 'create database zabbix character set utf8 collate utf8_bin;'
mysql -e 'grant all privileges on zabbix.* to zabbix@localhost identified by "zabbix";'

#Import data
zcat /usr/share/doc/zabbix-server-mysql-3.0.13/create.sql.gz|mysql -uzabbix -pzabbix zabbix

#Configure zabbixserver to connect to mysql
sed -i.ori '115a DBPassword=zabbix' /etc/zabbix/zabbix_server.conf

#Add time zone
sed -i.ori '18a php_value date.timezone  Asia/Shanghai' /etc/httpd/conf.d/zabbix.conf

#Solve Chinese garbled code
yum -y install wqy-microhei-fonts
\cp /usr/share/fonts/wqy-microhei/wqy-microhei.ttc /usr/share/fonts/dejavu/DejaVuSans.ttf

#Start service
systemctl start zabbix-server
systemctl start httpd

#Write boot self boot
chmod +x /etc/rc.d/rc.local
cat >>/etc/rc.d/rc.local<<EOF
systemctl start mariadb.service
systemctl start httpd
systemctl start zabbix-server
EOF

#Output information
echo "Browser access http://`hostname -I|awk '{print $1}'`/zabbix"
2.2.3 client rapid deployment script
#!/bin/bash
#clsn

#Set resolution
echo '10.0.0.1 mirrors.aliyuncs.com mirrors.aliyun.com repo.zabbix.com' >> /etc/hosts

#Install zabbix source and Aliyu num source
curl -o /etc/yum.repos.d/CentOS-Base.repo http://mirrors.aliyun.com/repo/Centos-7.repo
curl -o /etc/yum.repos.d/epel.repo http://mirrors.aliyun.com/repo/epel-7.repo
rpm -ivh http://repo.zabbix.com/zabbix/3.0/rhel/7/x86_64/zabbix-release-3.0-1.el7.noarch.rpm

#Install zabbix client
yum install zabbix-agent -y
sed -i.ori 's#Server=127.0.0.1#Server=172.16.1.61#' /etc/zabbix/zabbix_agentd.conf
systemctl start  zabbix-agent.service

#Write boot self boot
chmod +x /etc/rc.d/rc.local
cat >>/etc/rc.d/rc.local<<EOF
systemctl start  zabbix-agent.service
EOF
2.3 test connectivity
2.3.1 installation of ZABBIX get detection tool on the server
yum install zabbix-get
2.3.2 test at the server
Note: the test can only be performed on the server
zabbix_get -s 172.16.1.61 -p 10050 -k "system.cpu.load[all,avg1]"
zabbix_get -s 172.16.1.21 -p 10050 -k "system.cpu.load[all,avg1]"
test result
[root@m01 ~]# zabbix_get -s 172.16.1.61 -p 10050 -k "system.cpu.load[all,avg1]"
0.000000

[root@m01 ~]# zabbix_get -s 172.16.1.21 -p 10050 -k "system.cpu.load[all,avg1]"
0.000000
Chapter 3 web interface operation
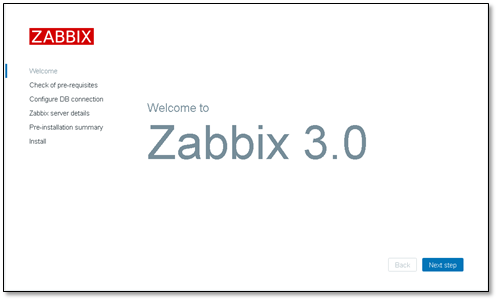
3.1 web installation of ZABBIX
3.1.1 access with browser
http://10.0.0.61/zabbix/setup.php
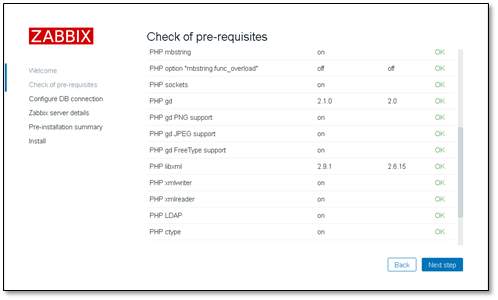
When detecting information, you can view the specific error information for different solutions
Select mysql database and enter the password
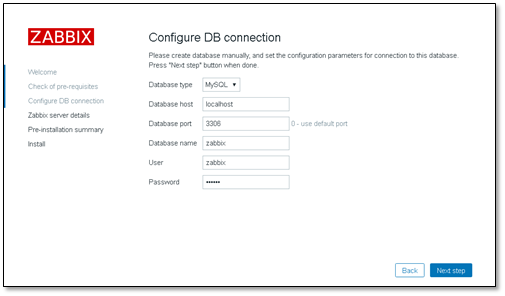
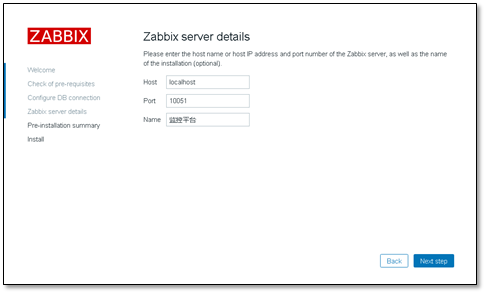
host and port do not need to be modified. name is user-defined
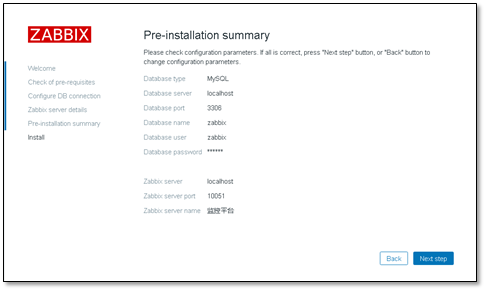
Confirm the information and click Next correctly
After installation, click Find
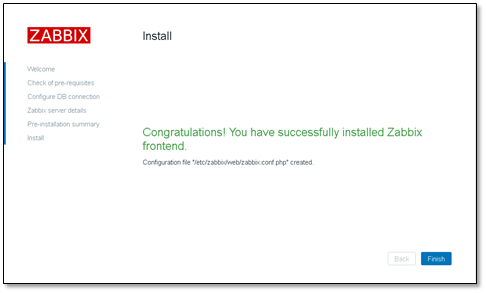
Enter the login interface Account Admin password zabbix Note that A is capitalized
3.2 add monitoring information
3.2.1 modifying the monitoring manager zabbix server
Configure > > host

Host name: the same as the host name, which is used by the zabbix server program
Visible Name: displayed on the zabbix web page, for us to see
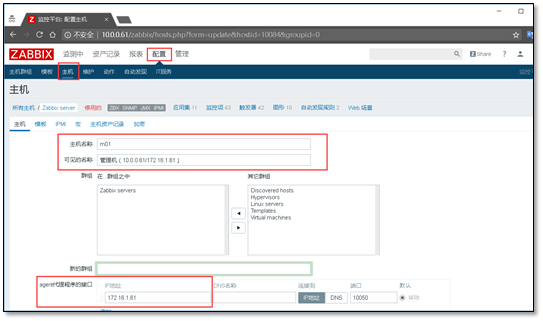
After modification, check the enabled button below
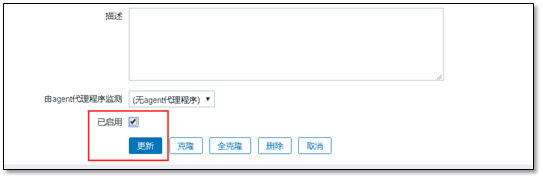
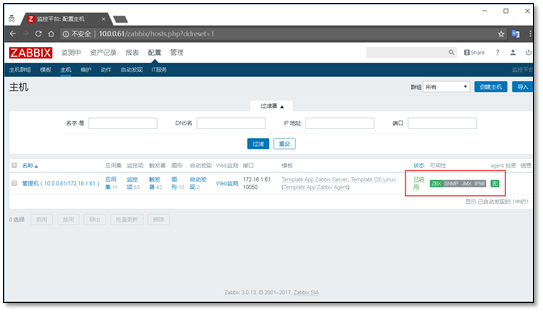
After adding, there is the monitoring host of the management machine
3.2.2 adding a new host
Configure > > host > > create host
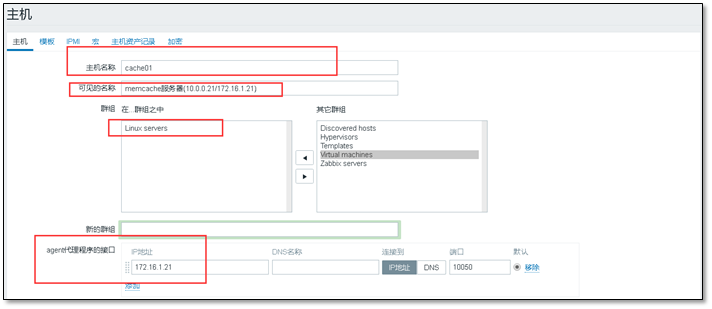
Note check to enable

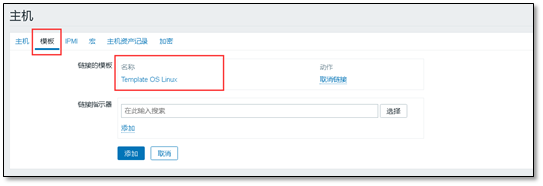
Then add the template, select linux OS, click small add first, and then click large add.
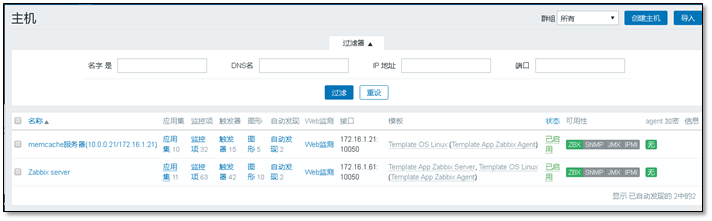
After adding, two pieces of monitoring host information will be displayed
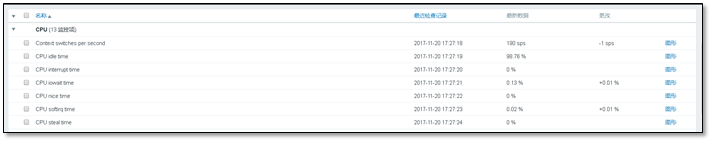
3.2.3 viewing monitoring content
Testing >> Latest data
Filtering is required in the latest data,
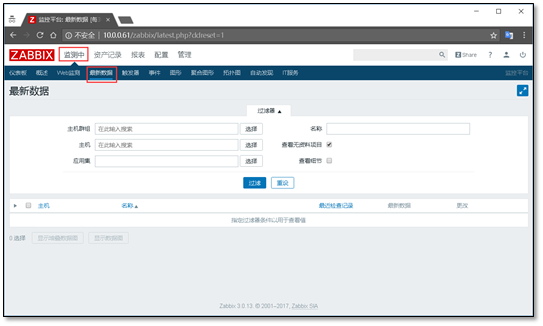
You can search by entering ip or name

All monitoring items will be listed below
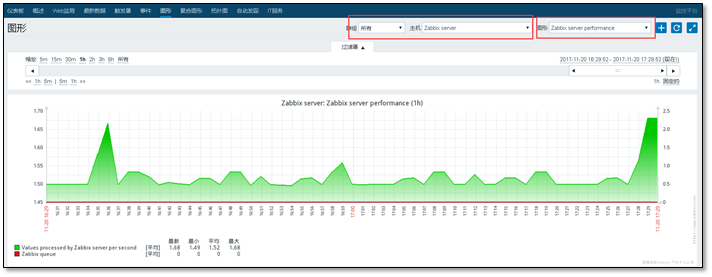
3.2.4 viewing images
Detecting > > graphics
Select the correct host. Select the graph to view to plot
Chapter 4 custom monitoring and monitoring alarm
4.1 user defined monitoring
4.1.1 description
zabbix built-in Template OS Linux (Template App Zabbix Agent) provides routine monitoring of CPU, memory, disk, network card, etc. These monitoring items can be automatically added as long as the new host is associated with this template.
Demand: the number of server login cannot exceed three, and more than three people will give an alarm
4.1.2 preliminary knowledge
The user-defined key can be recognized by server and agent
# Correct key
[root@m01 ~]# zabbix_get -s 172.16.1.21 -p 10050 -k "system.uname"
Linux cache01 3.10.0-693.el7.x86_64 #1 SMP Tue Aug 22 21:09:27 UTC 2017 x86_64
# Unregistered, user-defined key
[root@m01 ~]# zabbix_get -s 172.16.1.21 -p 10050 -k "login-user"
ZBX_NOTSUPPORTED: Unsupported item key.
# Wrong key
[root@m01 ~]# zabbix_get -s 172.16.1.21 -p 10050 -k "system.uname1"
ZBX_NOTSUPPORTED: Unsupported item key.
4.2 realize user-defined monitoring
4.2.1 custom syntax
UserParameter=<key>,<shell command>
UserParameter=login-user,who|wc -l
UserParameter=login-user,/bin/sh /server/scripts/login.sh
4.2.2 agent registration
[root@cache01 ~]# cd /etc/zabbix/zabbix_agentd.d/

[root@cache01 zabbix_agentd.d]# vim userparameter_login.conf
UserParameter=login-user,who|wc -l
UserParameter=login-user2,who|wc -l
UserParameter=login-user3,who|wc -l
Note: key names should be unique. Multiple keys are separated by behavior
#Restart the service after modification
[root@cache01 zabbix_agentd.d]# systemctl restart zabbix-agent.service
get test on the server side
[root@m01 ~]# zabbix_get -s 172.16.1.21 -p 10050 -k "login-user"
3

[root@m01 ~]# zabbix_get -s 172.16.1.21 -p 10050 -k "login-user2"
3

[root@m01 ~]# zabbix_get -s 172.16.1.21 -p 10050 -k "login-user3"
3

[root@m01 ~]# zabbix_get -s 172.16.1.21 -p 10050 -k "login-user4"
ZBX_NOTSUPPORTED: Unsupported item key.
4.2.3 register on the server side (web operation)
① Create template
Configure > > Template > > Create template
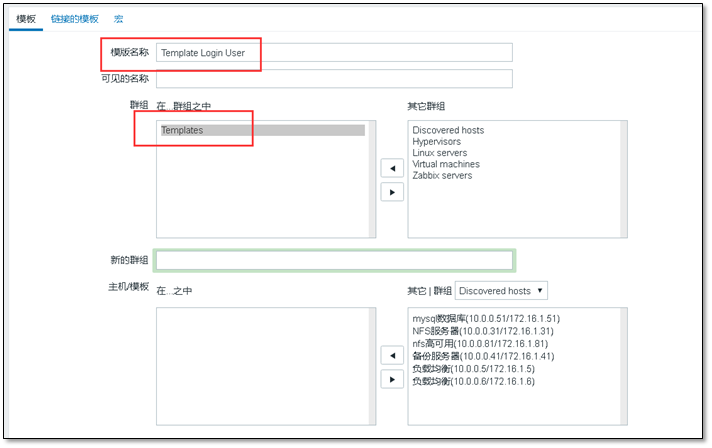
Click Add to create a template

View the created template. ↑
② Create application set
The application set is similar to (directory / folder), and its function is to classify monitoring items.
click Application set > > Create application set
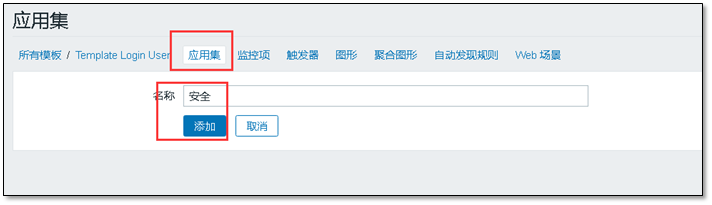
Customize the name of the application set, and then click Add
③ Create monitor item
Monitoring item > > Create monitor item

key value -- key, that is, the login user created earlier.
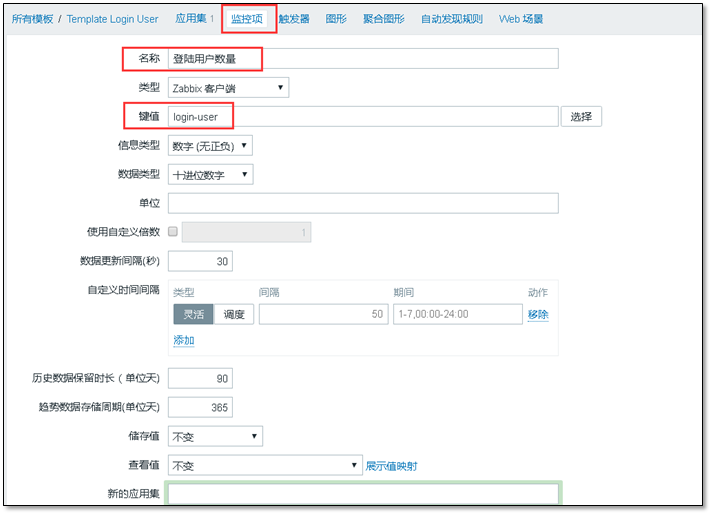
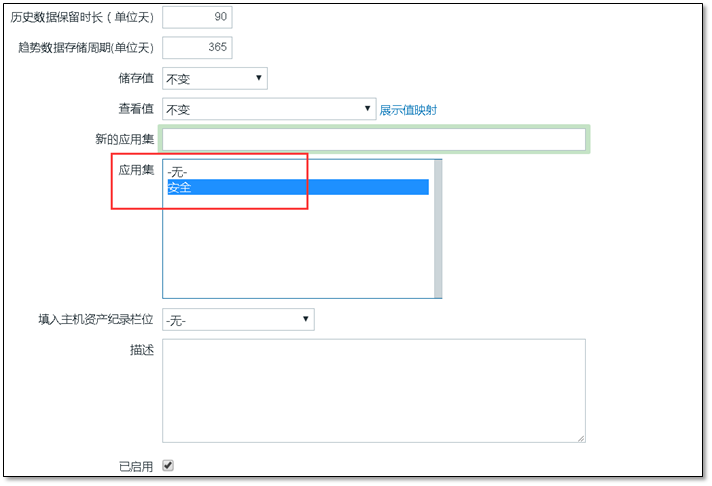
Note: when creating a monitoring item, pay attention to selecting the upper application set, that is, the previously created security.
④ Create trigger
Function of trigger: when the value obtained by the monitoring item reaches a certain condition, an alarm will be triggered
(created on demand)
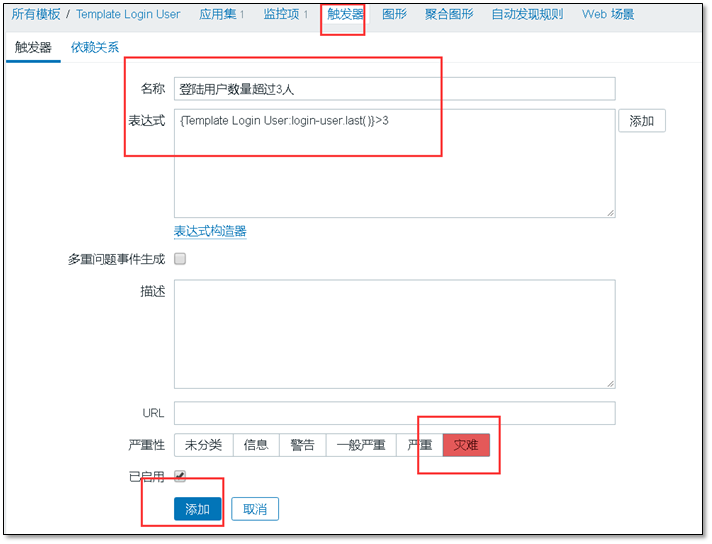
Trigger > > Create trigger
Create a trigger with a custom name, which is the name displayed when the alarm occurs.
Expression, click add on the right and select expression.
Severity customization.
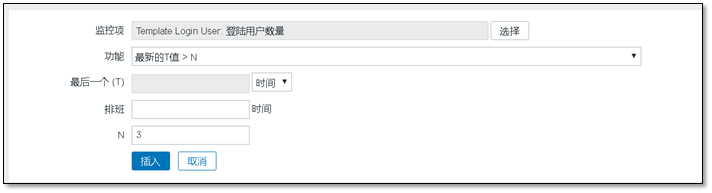
Definition of expression ↓ , Select the previously created monitoring item,
The latest T value is the currently obtained value.
After adding, you can see the addition in the trigger

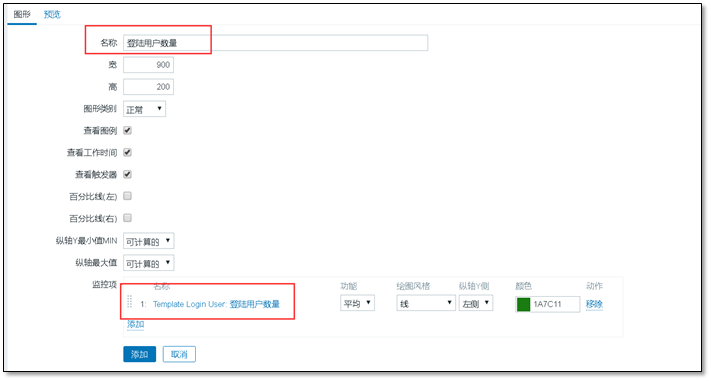
⑤ Create drawing
The monitoring information is displayed graphically
Graphics > > Create drawing
User defined name, associated with the monitoring item.
⑥ Host association template
Configure > > host
A host can associate multiple templates

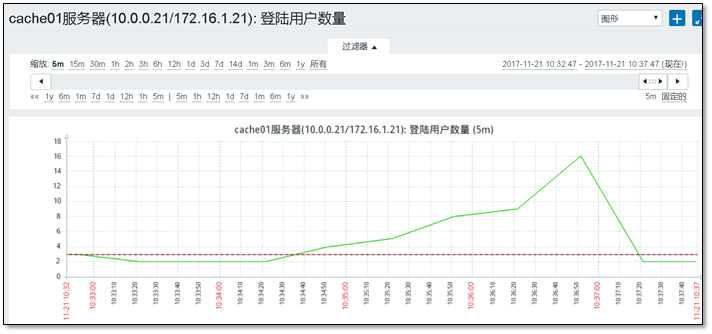
4.2.4 viewing monitored graphics
4.3 monitoring alarm
4.3.1 third party alarm platform
http://www.onealert.com
You can push the most important information to the most appropriate person at the most appropriate time through the notification assignment and scheduling strategy provided by OneAlert, as well as a full range of SMS, wechat, QQ and telephone reminder services.
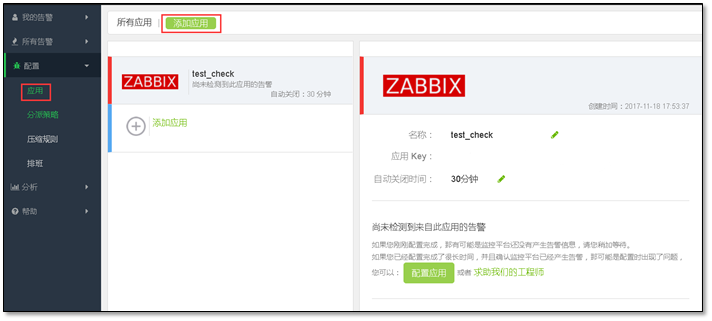
4.3.2 onealert configuration
Add an application. Note that zabbix is added
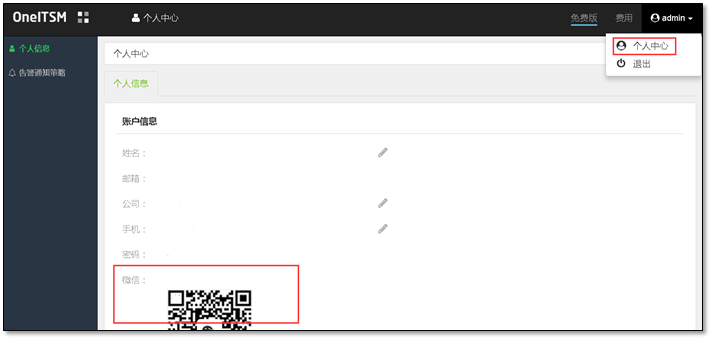
WeChat alarm needs to be concerned about WeChat official account.
4.3.3 installing onealert Agent
1. Switch to zabbix script directory (how to view zabbix script directory):
cd /usr/local/zabbix-server/share/zabbix/alertscripts

#View zabbix script directory
vi /etc/zabbix/zabbix_server.conf
 see AlertScriptsPath
2. Get OneITSM agent package:
wget http://www.onealert.com/agent/release/oneitsm_zabbix_release-1.0.1.tar.gz
3. Decompression and installation.
tar -zxf oneitsm_zabbix_release-1.0.1.tar.gz
cd oneitsm/bin
bash install.sh --#Personal generated key
Note: in the installation process, according to the installation prompt, enter the zabbix management address, administrator user name and password.
Zabbix Management address: http://10.0.0.61/zabbix/
Zabbix administrator account : Admin
Zabbix Administrator password:
4. When "installation succeeded" is prompted, the installation is successful!
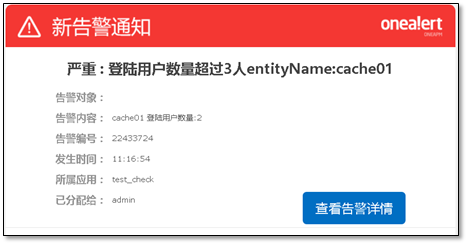
Verify alarm integration

A new zabbix alarm (problem) is generated, and the action status is "delivered", indicating that the integration is successful.
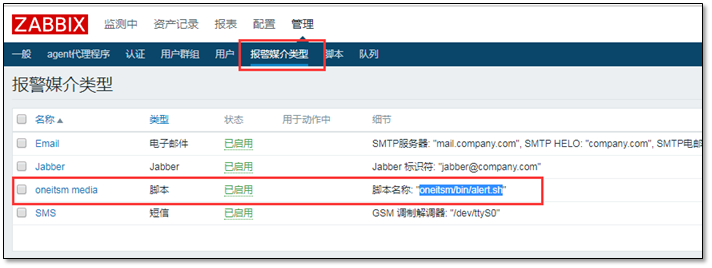
4.3.1 how to delete onealert Agent
① Delete script in alarm media type
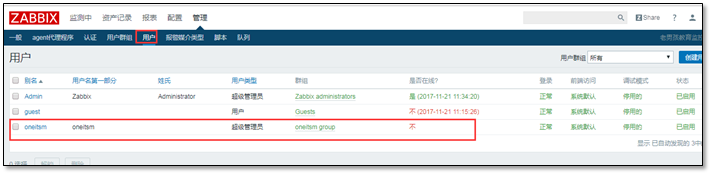
② Delete created user
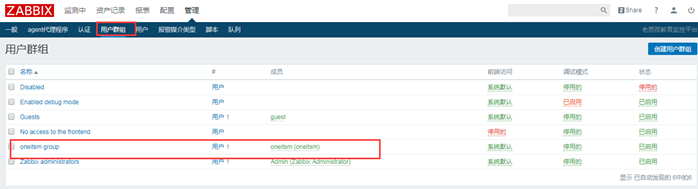
③ Delete user group
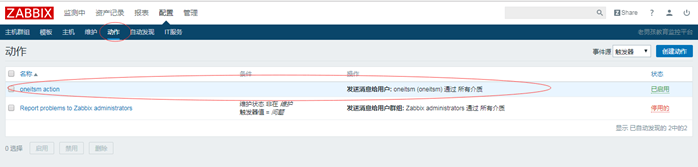
④ Delete created action
4.3.2 trigger responds and sends alarm information
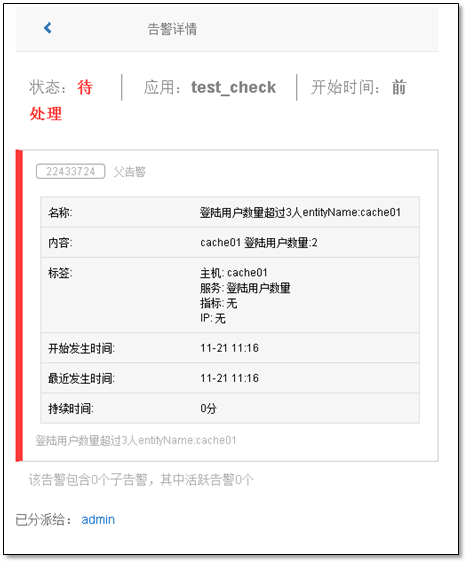
Alarm information can be received in wechat and email.
Note: email will only be sent when the status changes
Good -- > bad
Bad -- > good
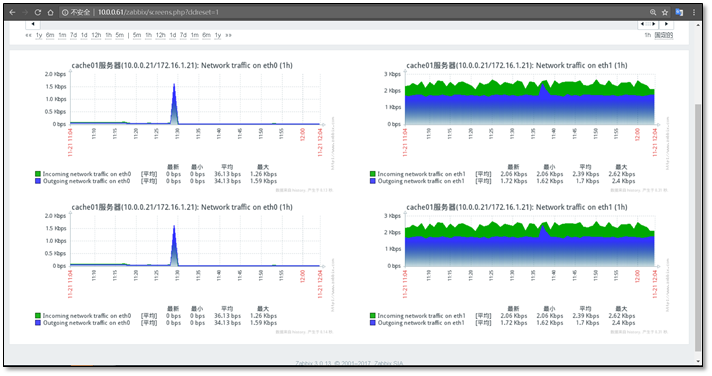
4.4 monitoring visualization
4.4.1 aggregate graphics
Latest data > > graphical
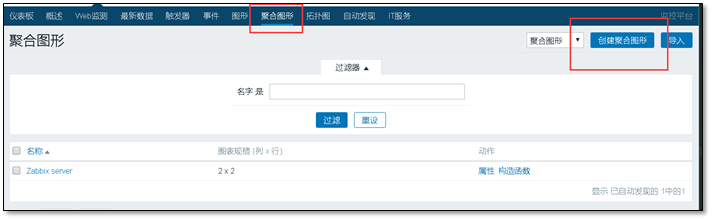
Custom name
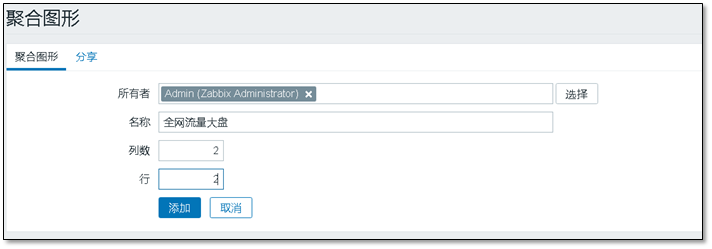
Click the name of the aggregation graph, change it, and add the graph to be displayed.
4.4.2 slides
Add slide
Monitoring > > Composite graphics > > Slide Show
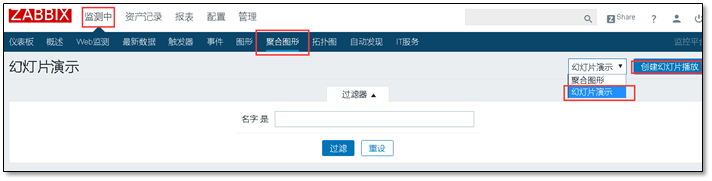
Create a slide, customize the name, and select the slide to display
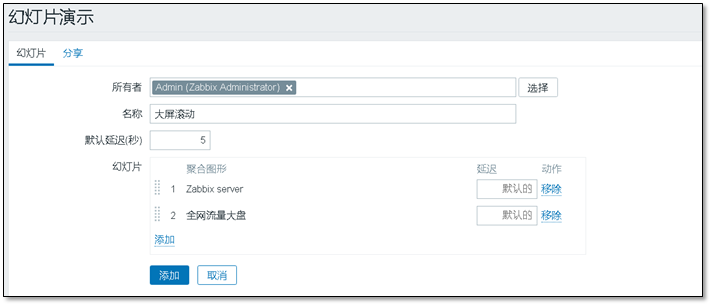
Slides are played automatically according to the set time
4.5 template sharing
4.5.1 host sharing
Open the host page, select all and click export

Import

4.5.2 template sharing
https://github.com/zhangyao8/zabbix-community-repos

Chapter 5 monitoring the whole network server
5.1 requirements description
Actual demand:
The company already has 100 servers and now needs to use zabbix to monitor them all.
5.2 planning scheme
General monitoring: cpu, memory, disk, network card Question: how to quickly add 100 machines
Method 1: use cloning
Method 2: automatic registration and automatic discovery
Method 3: call zabbix api interface curl ,python
Develop your own operation and maintenance platform and zabbix compatible channel
Service monitoring, url monitoring and other special monitoring: Custom monitoring
5.2.1 api interface usage (curl)
curl -i -X POST -H 'Content-Type:application/json' -d'{"jsonrpc": "2.0","method":"user.login","params":{"user":"Admin","password":"zabbix"},"auth": null,"id":0}' "http://10.0.0.61/zabbix/api_jsonrpc.php"

curl -i -X POST -H 'Content-Type:application/json' -d'
    {
        "jsonrpc": "2.0",
        "method": "host.get",
        "params": {
            "output": [
                "hostid",
                "host"
            ],
            "selectInterfaces": [
                "interfaceid",
                "ip"
            ]
        },
        "id": 2,
        "auth": "6a450a8fc3dce71fd310cfe338746578"
    }' "http://10.0.0.61/zabbix/api_jsonrpc.php"
5.3 specific implementation plan
5.3.1 hardware, system and network monitoring
All cluster nodes (all virtual machines) are monitored
Switch and router monitoring (simple method: change to the server network card traffic monitoring corresponding to the port; standard method: monitor the network card of the switch)
snmp monitoring
5.3.2 application service monitoring
1. Monitor the backup server. The simple method is to monitor the rsync port. If there are other better schemes, you can explain them;
    Method 1: monitor 873 port net.tcp.port[,873]
    Method 2: simulate pushing and pulling files
2. Monitor the NFS server. Use monitoring the NFS process to judge whether the NFS server is normal. If there are other better schemes, you can explain them;
    Method 1: port (get nfs port through rpc port of 111) net.tcp.port[,111]
    Method 2: showmount -e ip|wc -l
3. Monitor the MySQL server, simply monitor the 3306 port of MySQL, or use the MySQL template provided by zabbix. If there are other better schemes, please explain;
    Method 1: port (via mysql port of 3306) net.tcp.port[,3306]
    Method 2: mysql remote login
    Method 3: use the template and key provided by zabbix agent
4. Monitor 2 web servers and simply monitor port 80. If there are other better schemes, please explain;
    Method 1: port (through web port of 80) net.tcp.port[,80]
    Method 2: look at the WEB page status code and return content = = zabbix's own WEB detection
5. Monitor the URL address to more accurately monitor the normal operation of our website;
Use the monitoring Web monitoring provided by zabbix to monitor
6. Monitor the reverse proxy server, PPTP server and other services you deploy in the interim architecture.
nginx,pptp
 ntp port udp 123
7. Monitor seven connection states of Nginx.
Custom monitoring
5.3.3 general method of monitoring service
1. Monitoring port netstat ss lsof ==> wc -l
2. Monitor process ps -ef|grep process | wc -l Try it out
3. Simulate the usage of the client and monitor the server
web ==> curl
mysql ==> select insert
memcache = = "set then get"
5.4 implementation of whole network monitoring
Install client script, for centos6
#!/bin/bash

#Set resolution
# echo '10.0.0.1 mirrors.aliyuncs.com mirrors.aliyun.com repo.zabbix.com' >> /etc/hosts

#Install zabbix source and Aliyu num source
curl -o /etc/yum.repos.d/CentOS-Base.repo http://mirrors.aliyun.com/repo/Centos-6.repo
curl -o /etc/yum.repos.d/epel.repo http://mirrors.aliyun.com/repo/epel-6.repo
rpm -ivh http://repo.zabbix.com/zabbix/3.0/rhel/6/x86_64/zabbix-release-3.0-1.el6.noarch.rpm

yum clean all
yum clean all
#Install zabbix client
yum install zabbix-agent -y
sed -i.ori 's#Server=127.0.0.1#Server=172.16.1.61#' /etc/zabbix/zabbix_agentd.conf
/etc/init.d/zabbix-agent start

#Write boot self boot
chmod +x /etc/rc.d/rc.local
cat >>/etc/rc.d/rc.local<<EOF
/etc/init.d/zabbix-agent start
EOF
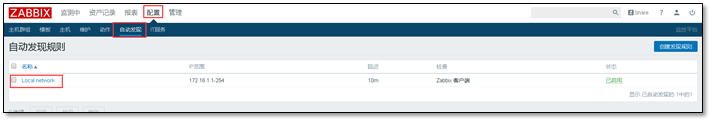
5.4.1 using auto discovery rules
Add autodiscover rule
Create discovery action
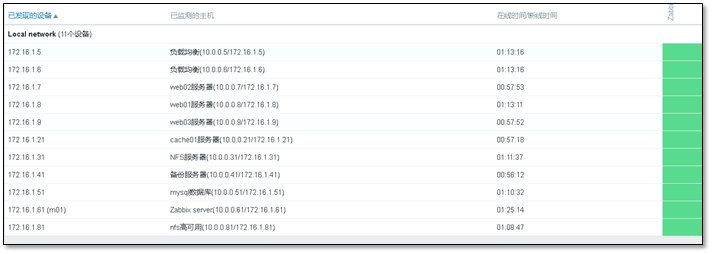
View automatically discovered machines.
5.4.2 monitoring backup server
Use the system's own key value to monitor net.tcp.listen[port] Create a new template

Test on the server
[root@m01 ~]# zabbix_get -s 172.16.1.41 -p 10050 -k "net.tcp.listen[873]"
1

# 1 means the port is listening, 0 means the port is not listening
Add template to host

5.4.3 monitoring NFS server
Create nfs monitoring template
use proc.num[<name>,<user>,<state>,<cmdline>] Key value to detect the number of nfs processes

Test on the server
[root@m01 ~]# zabbix_get -s 172.16.1.31 -p 10050 -k "proc.num[,,,rpc]"
5

[root@m01 ~]# zabbix_get -s 172.16.1.31 -p 10050 -k "proc.num[nfsd,,,]
8
Bind template to host

5.4.4 monitoring MySQL server
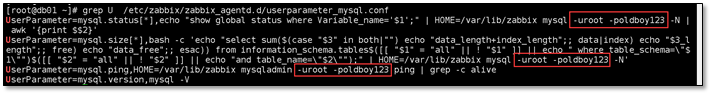
Add the self-contained mysqlkey value to the mysql account password, otherwise the data cannot be obtained.
Use the system's own template Net. TCP. Port [< IP >, port] use the built-in monitoring port key to monitor

Add a new mysql monitoring item port

[root@m01 ~]# zabbix_get -s 172.16.1.51 -p 10050 -k "net.tcp.port[,3306]"
1

#Check whether TCP connection can be established to the specified port. Return 0 - cannot connect; 1 - can be connected
Associate template to host

5.4.5 monitoring web server
Create monitoring template to monitor nginx service and port 80
    Proc.num [< name >, < user >, < state >, < CmdLine >] number of processes. Returns an integer
    Net. TCP. Port [< IP >, port] check whether a TCP connection can be established to the specified port. Return 0 - cannot connect; 1 - can be connected

[root@m01 ~]# zabbix_get -s 172.16.1.8 -p 10050 -k "proc.num[,,,nginx]"
2

[root@m01 ~]# zabbix_get -s 172.16.1.8 -p 10050 -k "net.tcp.port[,80]"
1
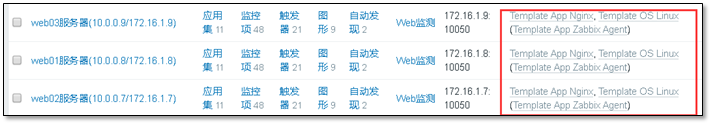
Associate template to host
5.4.6 monitoring URL address
Create monitoring page
echo ok >> /application/nginx/html/www/check.html
Test monitoring page
[root@web03 ~]# for ip in 7 8 9 ;do curl 10.0.0.$ip/check.html ;done
ok
ok
ok
Create a web monitoring template
Create application set
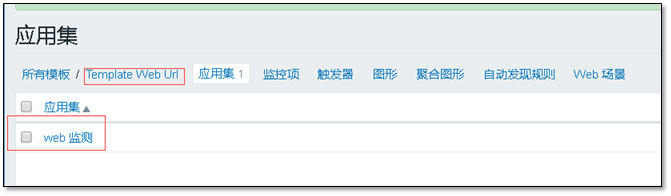
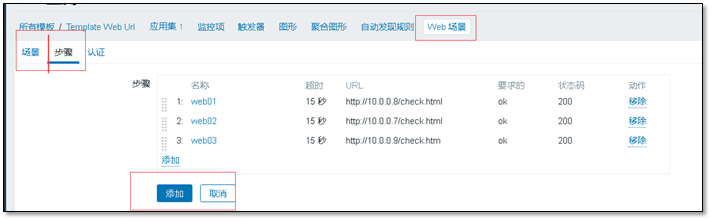
Create a Web scenario
Create drawing

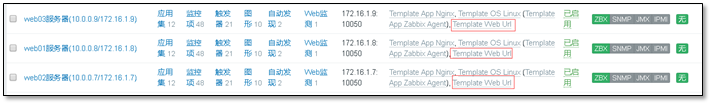
Associate template to host
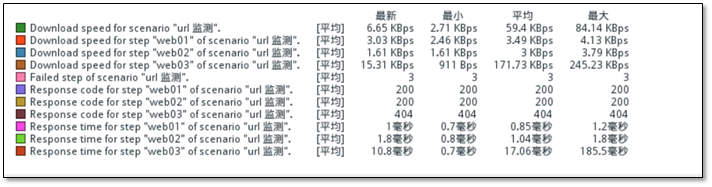
Monitoring results
5.4.7 monitoring reverse proxy server
Create a custom key
[root@lb01 ~]# cat  /etc/zabbix/zabbix_agentd.d/userparameter_nk.conf
UserParameter=keep-ip,ip a |grep 10.0.0.3|wc -l
Test on the server
[root@m01 ~]# zabbix_get -s 172.16.1.5  -p 10050 -k "keep-ip"
1

[root@m01 ~]# zabbix_get -s 172.16.1.6  -p 10050 -k "keep-ip"
0
Add template in web interface

Associate template to host

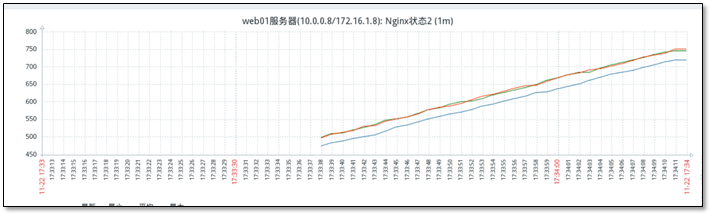
5.4.8 monitor seven connection states of Nginx
The nginx server displays status
......
    location /status {
           stub_status on;
           access_log off;
    }
......
[root@web01 ~]# for ip in 7 8 9 ;do curl 172.16.1.$ip/status ;done
Active connections: 1
server accepts handled requests
 73 73 69
Reading: 0 Writing: 1 Waiting: 0

Active connections: 1
server accepts handled requests
 134 134 127
Reading: 0 Writing: 1 Waiting: 0

Active connections: 1
server accepts handled requests
 7 7 7
Reading: 0 Writing: 1 Waiting: 0
Add key on nginx server
cat >/etc/zabbix/zabbix_agentd.d/userparameter_nginx_status.conf <<'EOF'
UserParameter=nginx_active,curl -s  127.0.0.1/status|awk '/Active/ {print $NF}'
UserParameter=nginx_accepts,curl -s  127.0.0.1/status|awk 'NR==3 {print $1}'
UserParameter=nginx_handled,curl -s  127.0.0.1/status|awk 'NR==3 {print $2}'
UserParameter=nginx_requests,curl -s  127.0.0.1/status|awk 'NR==3 {print $3}'
UserParameter=nginx_reading,curl -s  127.0.0.1/status|awk 'NR==4 {print $2}'
UserParameter=nginx_writing,curl -s  127.0.0.1/status|awk 'NR==4 {print $4}'
UserParameter=nginx_waiting,curl -s  127.0.0.1/status|awk 'NR==4 {print $6}'
EOF
Server test
[root@m01 ~]# zabbix_get -s 172.16.1.7  -p 10050 -k "nginx_waiting"
0

[root@m01 ~]# zabbix_get -s 172.16.1.8  -p 10050 -k "nginx_waiting"
0

[root@m01 ~]# zabbix_get -s 172.16.1.9  -p 10050 -k "nginx_waiting"
0
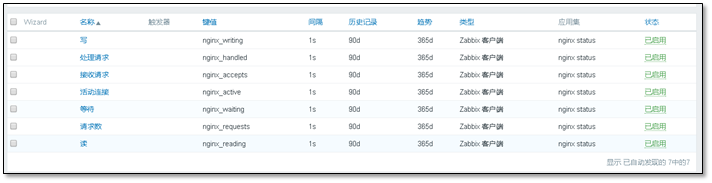
Add on ZABBIX Web

Monitoring item
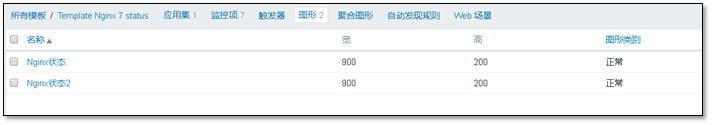
Add graphics
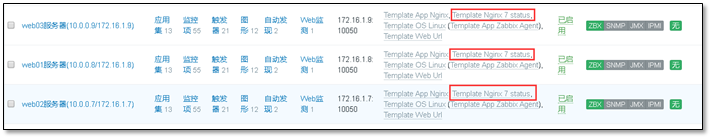
Associate template to host
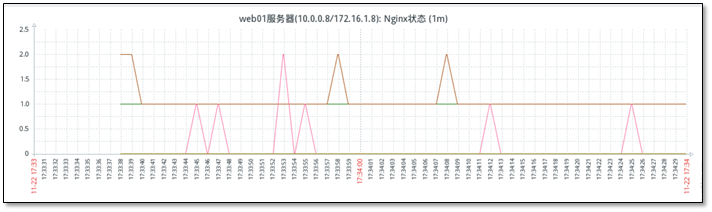
View added drawings
Chapter 6 automatic discovery and automatic registration
6.1 automatic registration and automatic registration
6.1.1 introduction
Autodiscover:
ZABBIX server actively finds all clients and then registers the clients in its own small notebook. However, ZABBIX server has high pressure (large network segments, many clients) and high time consumption.
Automatic registration:
The zabbix agent actively reports to the zabbix Server and registers; Disadvantages: the agent may not find the Server (configuration error)
6.1.2 two modes
Passive mode: the default agent is captured by the server (all from the standpoint of the agent)
Active mode: the agent actively sends data to the server (all from the standpoint of the agent)
be careful: Both modes are configured on the agent
zabbix The host name should be resolved in the hosts file in advance
6.2 auto discovery - passive mode
First milestone: complete previous installation
zabbix Server installation completed
The second milestone: configuring the agent client
After the zabbix agent is installed, pay attention to the configuration of Server=172.16.1.61
Third milestone: configuration on the web interface
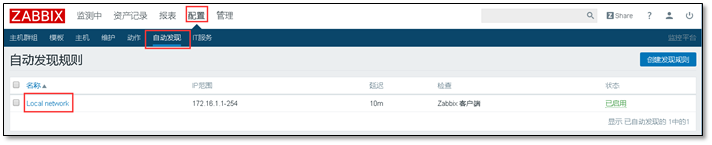
web interface: configure > > auto discovery > > local network
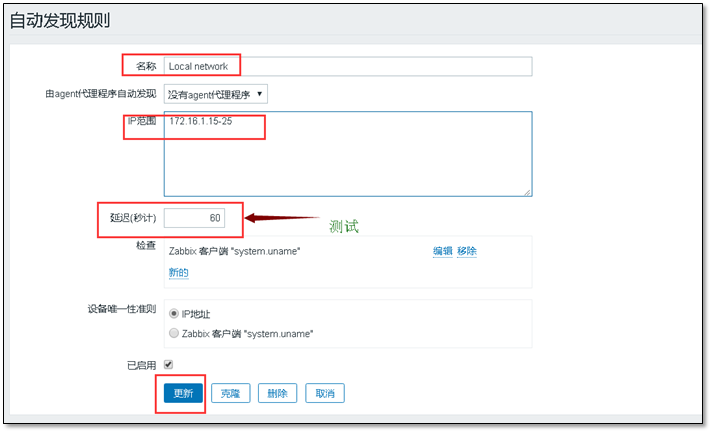
Use the self-contained auto discovery rule (modify it)
    Enter ip within the ip range and pay attention to the format;
    The delay is larger in the actual production environment and smaller in the experimental environment
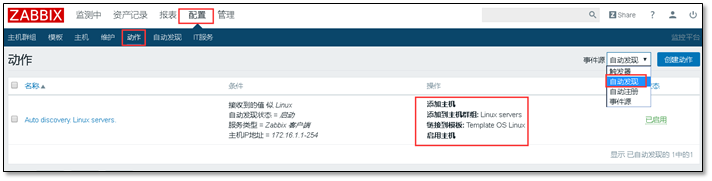
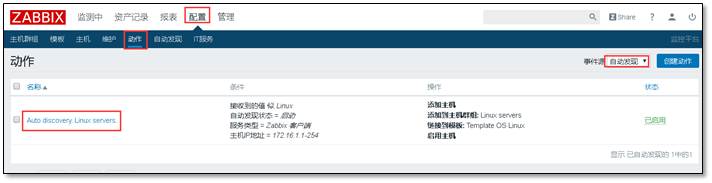
Create discovery action
Configure > > action > > auto discovery. Linux servers
① Configure actions
② Add conditions to conditions to make them more accurate
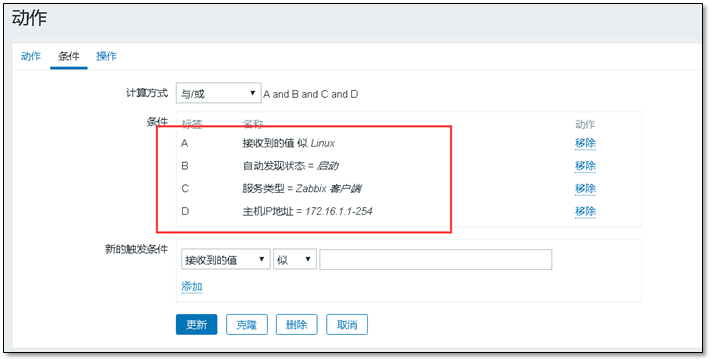
③ Add in action
a) Adding and enabling hosts
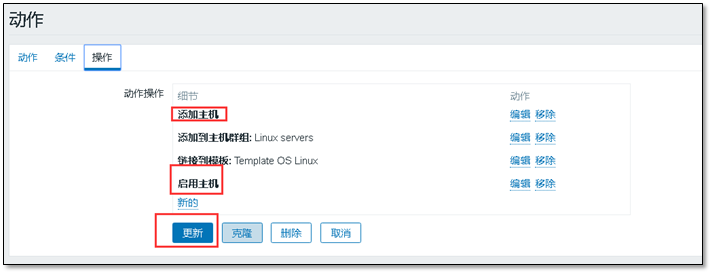
Then wait for the client to come to the door automatically 😏
6.3 automatic registration - active mode
First milestone: zabbix Server installation completed (completed)
zabbix Server installation completed
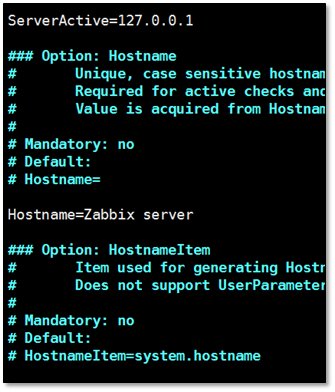
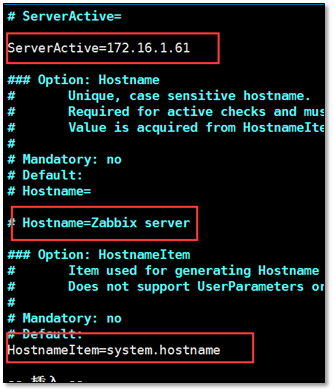
The second milestone: zabbix agent is installed, and additional configuration is required
vim /etc/zabbix/zabbix_agentd.conf
ServerActive=172.16.1.61
# Hostname=Zabbix server
HostnameItem=system.hostname

systemctl restart zabbix-agent.service
netstat -tunlp|grep zabbix
Comparison between source file and modified file
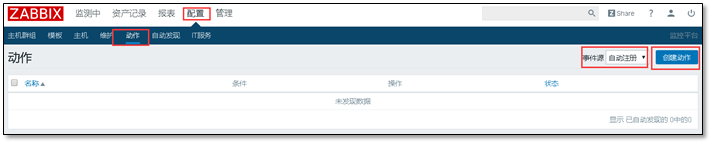
Third milestone: configuration on the web
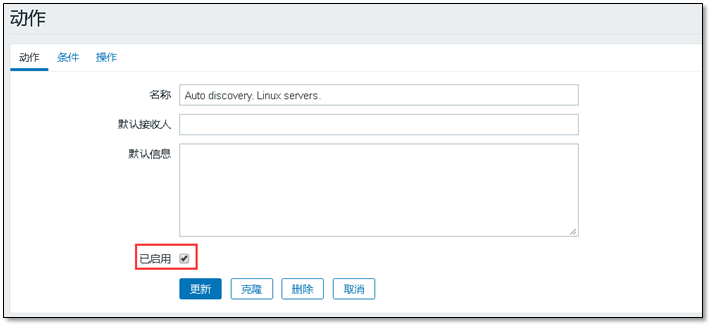
1 configure > > action > > event source (automatic registration) > > create action
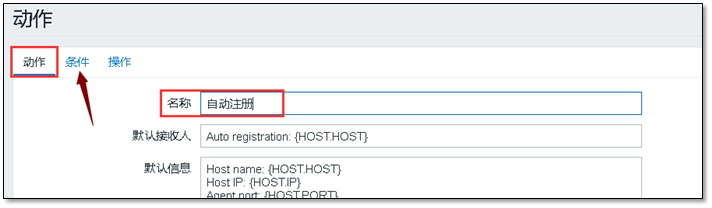
Create an action and add a name
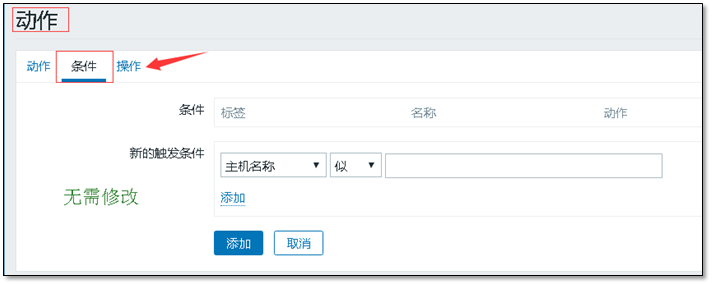
There is no need to modify the condition
Add actions to actions
(add host, add to host group, link to template)
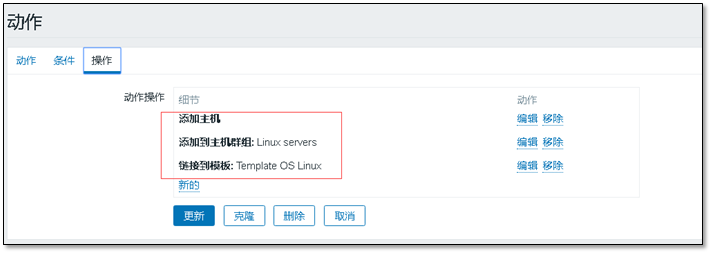
After adding the action, just wait
Note: restarting the client can accelerate discovery. But do not use it in the production environment.

Chapter 7 distributed monitoring and SNMP monitoring
7.1 distributed monitoring
7.1.1 function
Share pressure and reduce load
Multi machine room monitoring
zabbix Server ===> zabbix agent (only the same LAN can monitor)
Share pressure and reduce load
  zabbix Server ===>  zabbix proxy  ===>zabbix agent1 agent2 agent3 . . .
    172.16.1.61           172.16.1.21        172.16.1.0/24
                ===>  zabbix proxy  ===>zabbix agent4 agent5 agent6 . . .
Multi machine room monitoring
    ZABBIX server (Beijing) = = zabbix proxy (built in each machine room) = = zabbix agent
    122.71.240.233/172.16.1.61          122.71.241.11/172.16.2.21     172.16.2.0/24
7.1.2 environmental description
    zabbix server m01
    zabbix proxy cache01
    zabbix agent  cache01
7.1.3 configuring zabbix proxy
First milestone: configure zabbix yum source and install proxy
rpm -ivh http://repo.zabbix.com/zabbix/3.0/rhel/7/x86_64/zabbix-release-3.0-1.el7.noarch.rpm
yum install zabbix-proxy-mysql -y
Second milestone: installing the database
zabbix proxy also needs a database, which is not used to store monitoring data, but to store configuration information
# mount this database
yum -y install mariadb-server
systemctl start mariadb.service
# set up a database
mysql
create database zabbix_proxy character set utf8 collate utf8_bin;
grant all privileges on zabbix_proxy.* to zabbix@'localhost' identified by 'zabbix';
exit
# Import data file
zcat /usr/share/doc/zabbix-proxy-mysql-3.0.13/schema.sql.gz |mysql -uzabbix -pzabbix zabbix_proxy
# Configure zabbix proxy to connect to the database
sed -i.ori '162a DBPassword=zabbix' /etc/zabbix/zabbix_proxy.conf
sed -i 's#Server=127.0.0.1#Server=172.16.1.61#' /etc/zabbix/zabbix_proxy.conf
sed -i 's#Hostname=Zabbix proxy#Hostname=cache01#' /etc/zabbix/zabbix_proxy.conf

# Hostname is used as the name of the agent added later, which should be consistent
# start-up
systemctl restart zabbix-proxy.service
# Check port
[root@cache01 ~]# netstat -lntup |grep zabbix
tcp        0      0 0.0.0.0:10050     0.0.0.0:*       LISTEN      105762/zabbix_agent
tcp        0      0 0.0.0.0:10051   0.0.0.0:*         LISTEN      85273/zabbix_proxy
tcp6       0      0 :::10050       :::*      LISTEN      105762/zabbix_agent
tcp6       0      0 :::10051  :::*           LISTEN      85273/zabbix_proxy
The third milestone: modify the agent configuration to point to proxy
[root@cache01 ~]# grep ^Server /etc/zabbix/zabbix_agentd.conf
Server=172.16.1.61
ServerActive=172.16.1.61

[root@cache01 ~]# sed -i 's#172.16.1.61#172.16.1.21#g' /etc/zabbix/zabbix_agentd.conf

[root@cache01 ~]# grep ^Server /etc/zabbix/zabbix_agentd.conf
Server=172.16.1.21
ServerActive=172.16.1.21

[root@cache01 ~]# systemctl restart zabbix-agent.service
Fourth milestone: adding a proxy to the web interface
Manage > > agent agent > > create agent

The host name should be filled in for the agent name
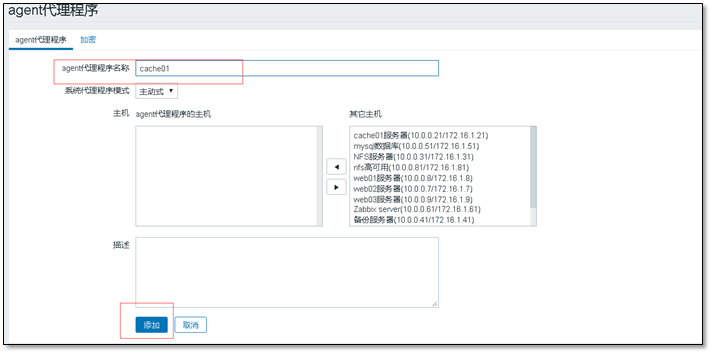
Wait a moment and the agent will appear in the program

The host agent can be found in the host

7.2 SNMP monitoring
7.2.1 scope of use
Unable to install agent Many advanced monitoring software can monitor various devices All are monitored through snmp
snmp simple network manager protocol
Simple network management protocol (SNMP) is composed of a set of network management standards, including an application layer protocol, a database schema and a set of resource objects. The protocol can support the network management system to monitor whether the devices connected to the network have any management concerns.
7.2.2 installing snmp program
yum -y install net-snmp net-snmp-utils
7.2.3 configuring snmp programs
sed -i.ori '57a view systemview   included  .1' /etc/snmp/snmpd.conf
systemctl start snmpd.service
7.2.4 testing snmp
[root@m01 ~]# snmpwalk -v 2c -c public 127.0.0.1 sysname
SNMPv2-MIB::sysName.0 = STRING: m01
explain:
# snmpwalk is similar to zabbix_get
# -v 2c Specifies the version using the snmp protocol snmp is divided into V1, V2 and v3
# -c public Assign password
# sysname zabbix like key
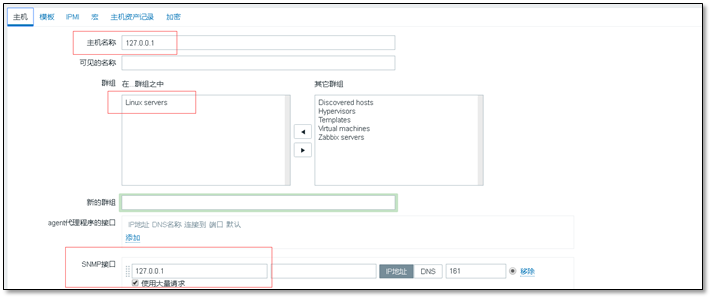
7.2.5 configuration in web interface
When adding a new host, pay attention to the snmp interface
Select a template and pay attention to the SNMP template
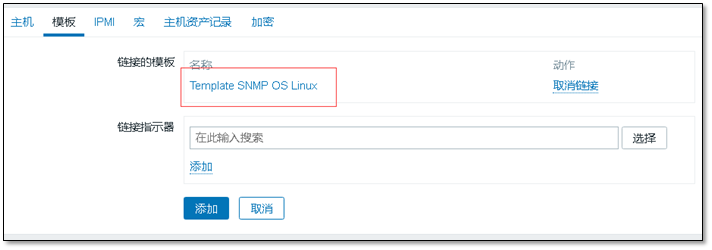
After adding, you can see the host of snmp monitoring pair in the host

7.2.6 appendix
    ##The SNMP OID list monitors the OIDs needed
    http://www.ttlsa.com/monitor/snmp-oid/
    cmdb resource management system
This article is from a miserable young man. Please indicate if you reprint it
Author: a handsome young man
source: http://clsn.io
The copyright of this article belongs to the author. Reprint is welcome, but this statement must be retained without the consent of the author, and the original text connection must be given in an obvious position on the article page, otherwise the right to investigate legal responsibility is reserved.