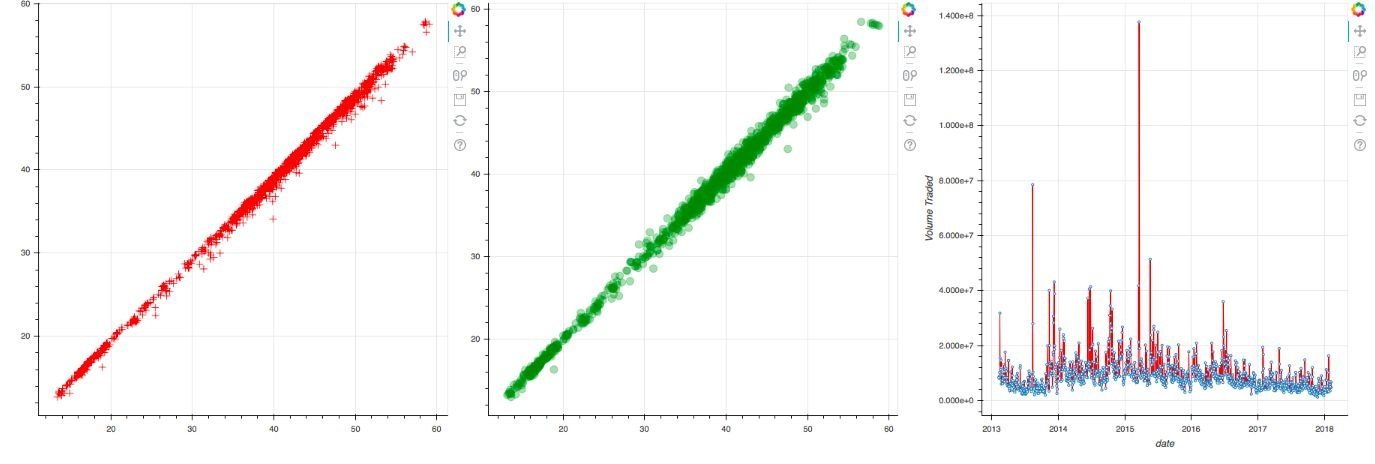
- Create multiple graphs on the same row
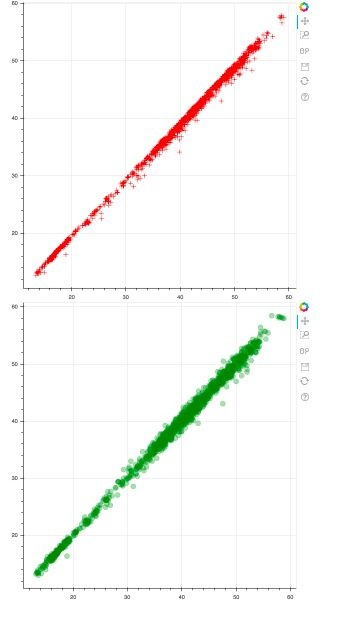
- Create multiple graphs in the same column
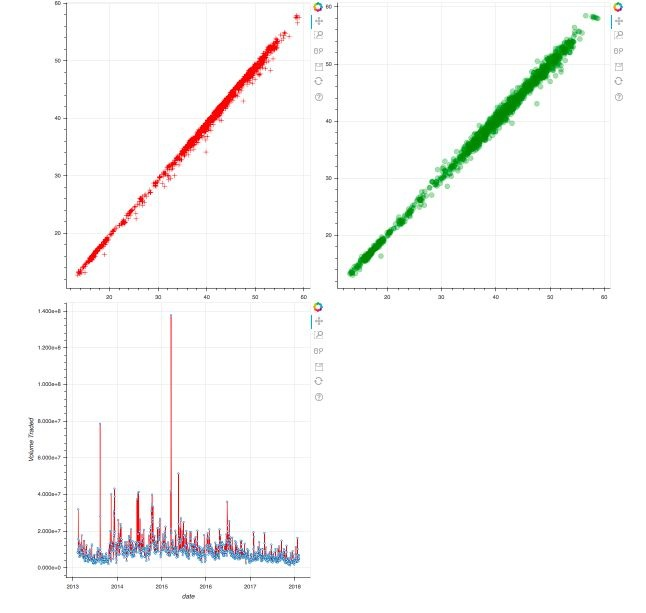
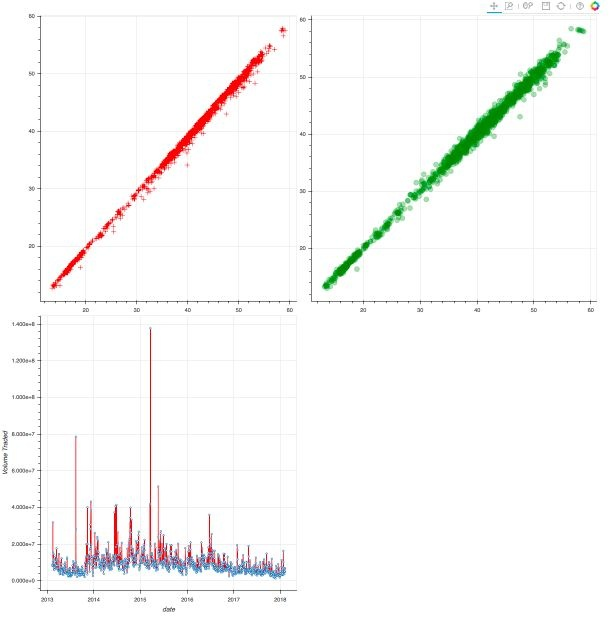
- Create multiple graphs in rows and columns
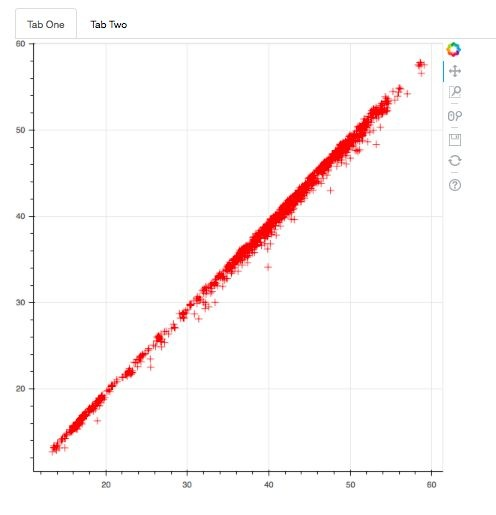
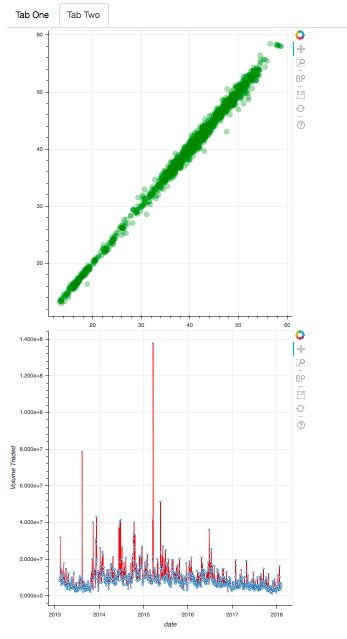
- Tabbed layouts creating multiple drawings
- Create a powerful grid layout
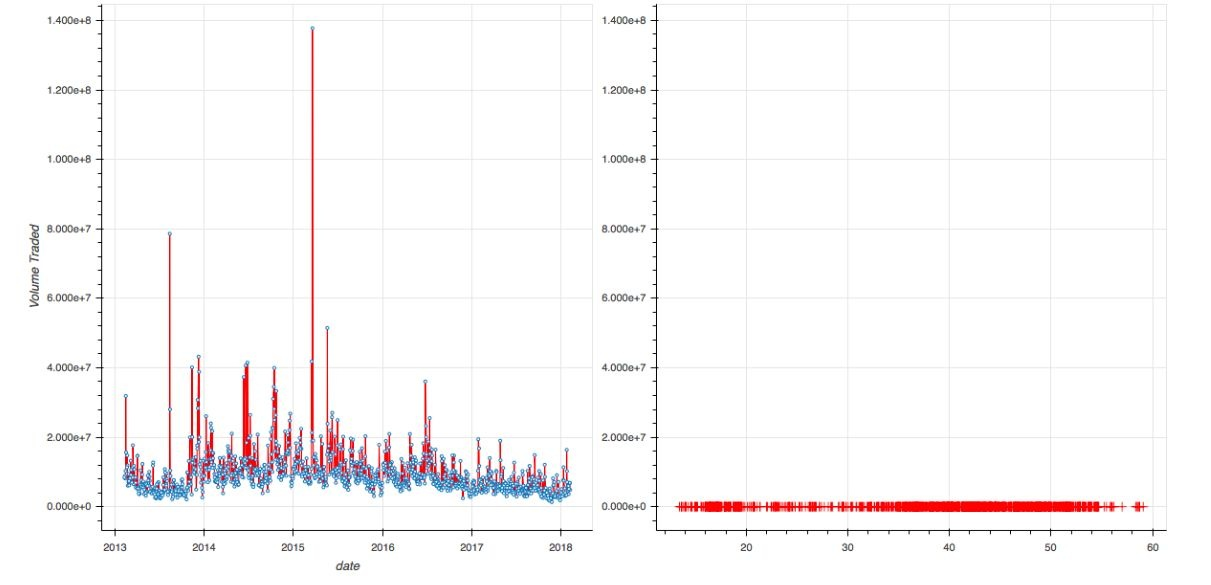
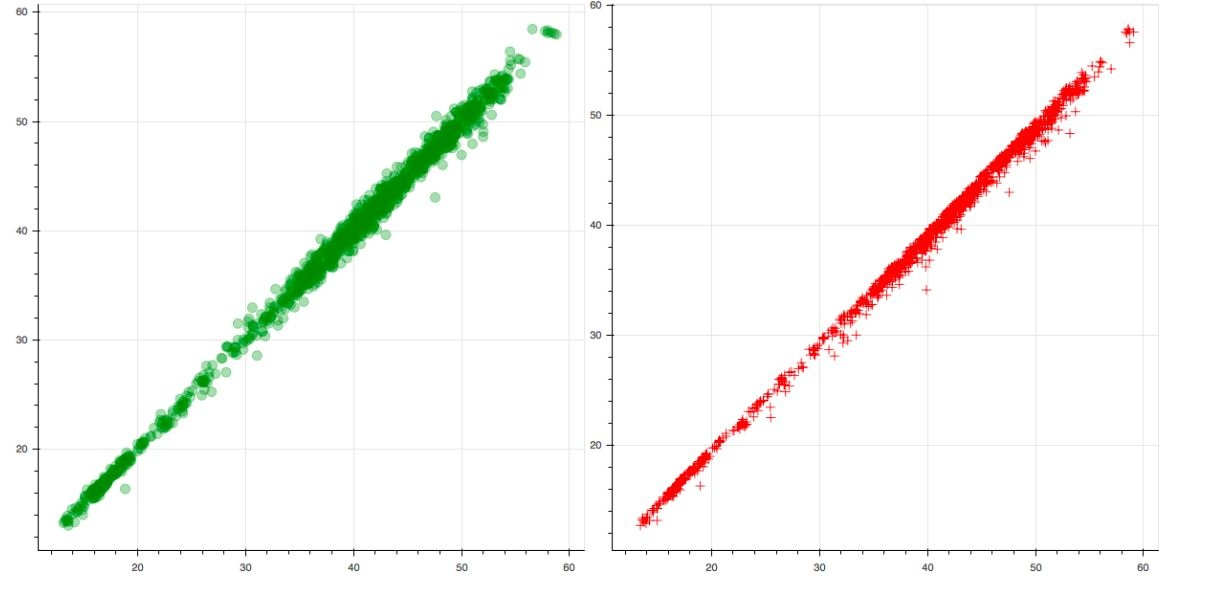
- Link multiple charts together
Create multiple graphs on the same row
bokeh has a lot of data, which can be downloaded as follows:
In [2]: import bokeh

In [3]: bokeh.sampledata.download()
Creating /home/andrew/.bokeh directory
Creating /home/andrew/.bokeh/data directory
Using data directory: /home/andrew/.bokeh/data
Downloading: CGM.csv (1589982 bytes)
   1589982 [100.00%]
Downloading: US_Counties.zip (3182088 bytes)
   3182088 [100.00%]
Unpacking: US_Counties.csv
Downloading: us_cities.json (713565 bytes)
    713565 [100.00%]
Downloading: unemployment09.csv (253301 bytes)
    253301 [100.00%]
Downloading: AAPL.csv (166698 bytes)
    166698 [100.00%]
Downloading: FB.csv (9706 bytes)
      9706 [100.00%]
Downloading: GOOG.csv (113894 bytes)
    113894 [100.00%]
Downloading: IBM.csv (165625 bytes)
    165625 [100.00%]
Downloading: MSFT.csv (161614 bytes)
    161614 [100.00%]
Downloading: WPP2012_SA_DB03_POPULATION_QUINQUENNIAL.zip (5148539 bytes)
   5148539 [100.00%]
Unpacking: WPP2012_SA_DB03_POPULATION_QUINQUENNIAL.csv
Downloading: gapminder_fertility.csv (64346 bytes)
     64346 [100.00%]
Downloading: gapminder_population.csv (94509 bytes)
     94509 [100.00%]
Downloading: gapminder_life_expectancy.csv (73243 bytes)
     73243 [100.00%]
Downloading: gapminder_regions.csv (7781 bytes)
      7781 [100.00%]
Downloading: world_cities.zip (646858 bytes)
    646858 [100.00%]
Unpacking: world_cities.csv
Downloading: airports.json (6373 bytes)
      6373 [100.00%]
Downloading: movies.db.zip (5067833 bytes)
   5067833 [100.00%]
Unpacking: movies.db
Downloading: airports.csv (203190 bytes)
    203190 [100.00%]
Downloading: routes.csv (377280 bytes)
    377280 [100.00%]
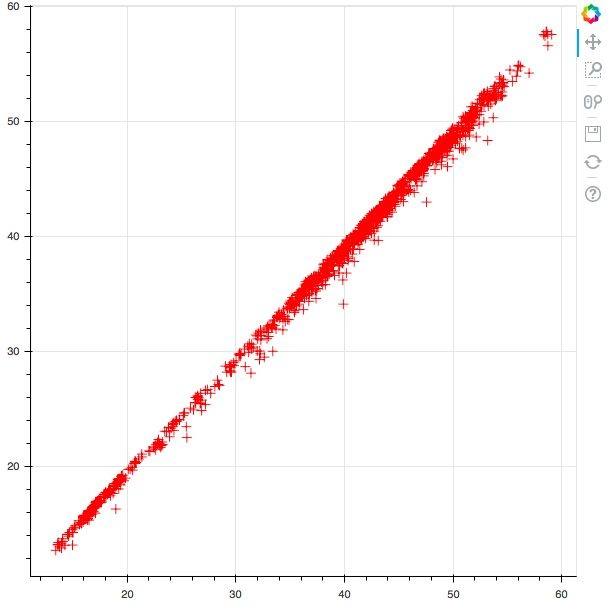
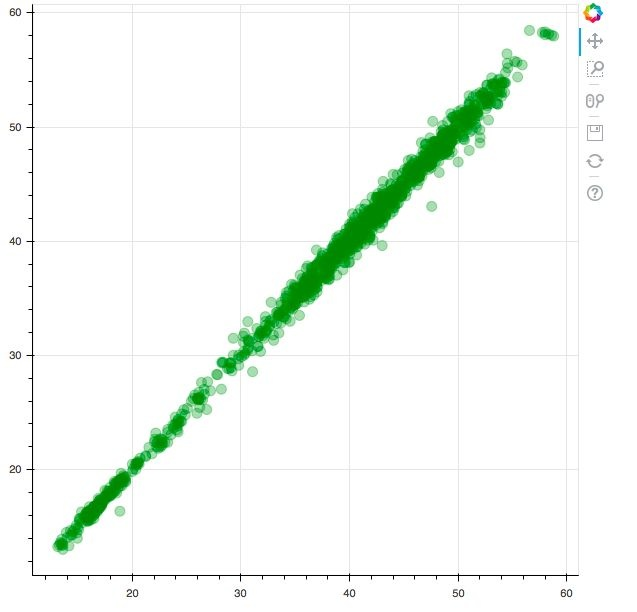
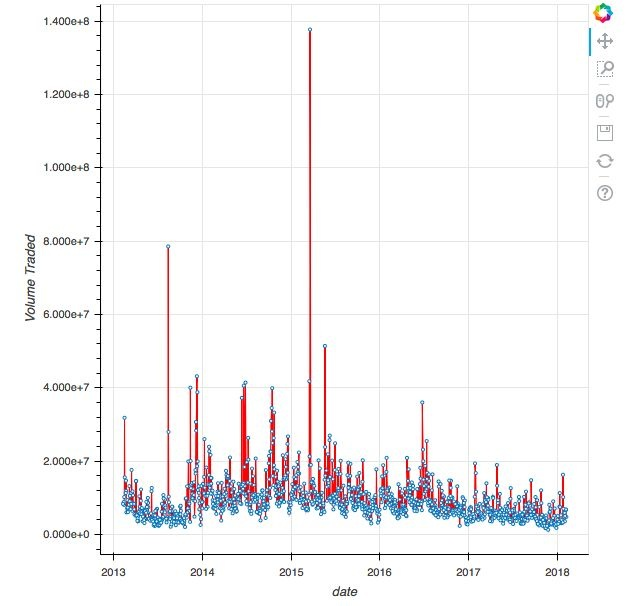
#Preparing all the plots needed for this chapter

import pandas as pd
from bokeh.sampledata.stocks import AAPL

df_apple = pd.DataFrame(AAPL)
df_apple['date'] = pd.to_datetime(df_apple['date'])


#Import the required packages

from bokeh.io import output_file, show
from bokeh.plotting import figure
from bokeh.plotting import ColumnDataSource


#Create the ColumnDataSource object

data = ColumnDataSource(data = {
    'x' : df_apple['high'],
    'y' : df_apple['low'],
    'x1': df_apple['open'],
    'y1': df_apple['close'],
    'x2': df_apple['date'],
    'y2': df_apple['volume'],
})


#Create the first scatter plot
plot1 = figure()
plot1.cross(x = 'x', y = 'y', source = data, color = 'red', size = 10, alpha = 0.8)

#Create the second scatter plot
plot2 = figure()
plot2.circle(x = 'x1', y = 'y1', source = data, color = 'green', size = 10, alpha = 0.3)

#Create the third scatter plot
plot3 = figure(x_axis_type = 'datetime', x_axis_label = 'date', y_axis_label = 'Volume Traded')
plot3.line(x = 'x2', y = 'y2', source = data, color = 'red')
plot3.circle(x = 'x2', y = 'y2', source = data, fill_color = 'white', size = 3)


#Output the 3 plots
#Output the plot1
output_file('first_plot.html')
show(plot1)

#Output the plot2
output_file('second_plot.html')
show(plot2)


#Output the plot3
output_file('third_plot.html')
show(plot3)


#Creating multiple plots along the same row
#Import the required packages
from bokeh.layouts import row
from bokeh.io import output_file, show

#Group the 3 plots into a 'row' layout
row_layout = row(plot1,plot2,plot3)

#Output the plot
output_file('horizontal.html')
show(row_layout)


#Creating multiple plots along the same column

#Import the required packages

from bokeh.layouts import column
from bokeh.io import output_file, show

#Group the 2 plots into a 'column' layout
col_layout = column(plot1,plot2)

#Output the plot
output_file('vertical.html')
show(col_layout)

#Creating multiple plots along a row and column

#Import the required packages

from bokeh.layouts import column, row
from bokeh.io import output_file, show

#Construct the nested layout
nested_layout = column(row(plot1,plot2), plot3)

#Output the plot
output_file('nested.html')
show(nested_layout)


#Creating multiple plots on a tabbed layout

#Import the required packages
from bokeh.models.widgets import Tabs, Panel
from bokeh.io import output_file, show
from bokeh.layouts import column, row

#Create the two panels

tab1 = Panel(child = plot1, title = 'Tab One')
tab2 = Panel(child = column(plot2,plot3), title = 'Tab Two')

#Feed the tabs into a Tabs object
tabs_object = Tabs(tabs = [tab1, tab2])

#Output the plot
output_file('tab_layout.html')
show(tabs_object)


#Creating a grid layout
#Import required packages

from bokeh.io import output_file, show
from bokeh.layouts import gridplot

#Create the grid layout
grid_layout = gridplot([plot1, plot2], [plot3, None])

#Output the plot
output_file('grid.html')
show(grid_layout)


#Linking multiple plots along the y axis
#Import the required packages

from bokeh.io import output_file, show
from bokeh.layouts import row

#Creating equal y axis ranges
plot3.y_range = plot1.y_range

#Create the row layout
row_layout = row(plot3, plot1)

#Output the plot
output_file('grid.html')
show(row_layout)


#Linking multiple plots along the x axis
#Import the required packages
from bokeh.io import output_file, show
from bokeh.layouts import row

#Creating equal x-axis ranges
plot2.x_range = plot1.x_range

#Create the row layout
row_layout = row(plot2, plot1)

#Output the plot
output_file('row.html')
show(row_layout)
Lovely python test development library Please like github, thank you!
Summary of python Chinese Library Documents
[Xuefeng magnetic needle stone blog] python3 standard library - Chinese version
[Xuefeng magnetite blog] python3 quick start tutorial
Interface automation performance test online training program
Automatic test data analysis of python test development
Please pay attention to more Xuefeng magnetic needle stone: a brief book
Technical support qq group: 144081101 (the group file will be recorded later) 591302926 567351477 nail free group: 21745728
Taoist technology - palmistry, hand examination, Chinese medicine and other nail groups 21734177 qq group: 391441566 184175668 338228106, hand examination, face examination, tongue examination, lottery, constitution identification. The service fee is 50 yuan per person. Please contact pin or wechat Python