The debugging skills in Xcode are closely related to our daily development. These debugging skills often have half the power when we solve bugs, and often use various breakpoints and commands. And these debugging skills are often asked in interviews, so let's take a look at what we don't know.
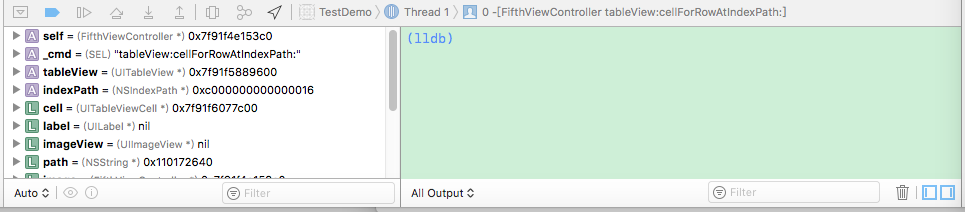
Debug main viewing area
Debug command
In the above figure, the green area on the right is the Log output area. In the Log output area, you can use some commands to assist debugging. What are the debugging commands? If you want to see all the debugging commands, you can type help in the right area of the figure above, and all the debugging commands will be listed. This article introduces some of the high frequency of use, others on the check, self understand it.
1. p command
-- ('expression --') Evaluate an expression on the current thread.
Displays any returned value with LLDB's default formatting.
The p command is the abbreviation of the print command. You can use the p command to view the values of basic data types, but if you use the p command to view objects, only the pointer address of the objects will be returned. The p command can be followed by not only variables and constants, but also expressions. ( A kind of But you can't use macros ❌)
2. po command
The po command can be understood as a print object. The function is similar to the p command, so it can also print constants, variables, objects returned by printing expressions, etc. ( A kind of You can't print macros either ❌)
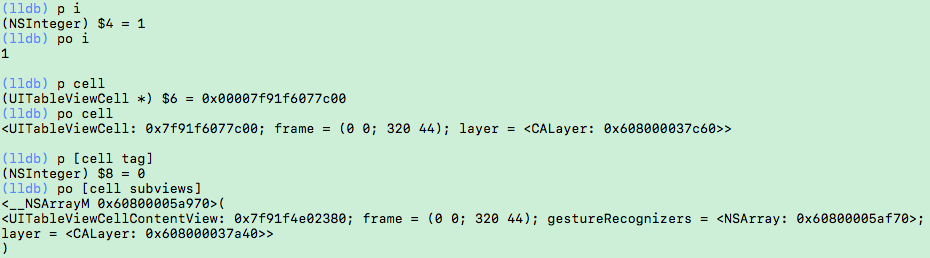
Examples of p and po usage
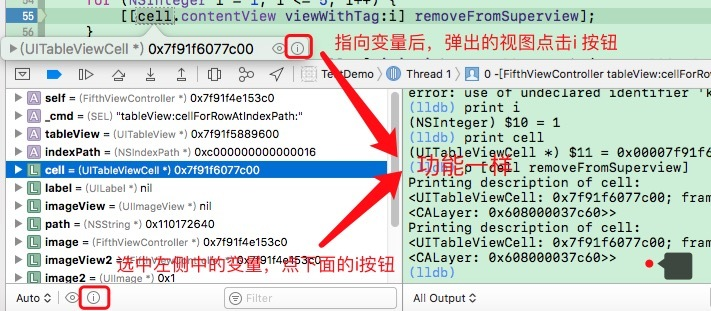
Of course, in addition to using commands, we can also use the left area to right-click variables -- > Print description of "xxx":
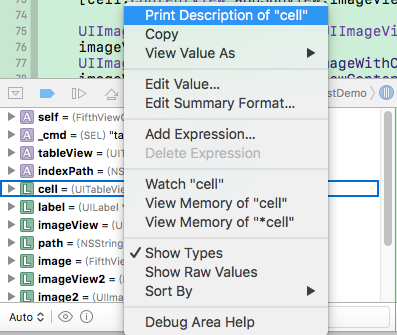
Paste_Image.png
Of course, there are other printing methods:
3.expr command
Expr is the abbreviation of expression. With the expr command, you can dynamically execute the assignment expression and print out the result when debugging. We can dynamically change the value of variables when debugging, which is very useful when debugging to let the application execute an exception path (such as executing an else case).
(lldb) p i
(NSInteger) $16 = 1
(lldb) expression i = 5
(NSInteger) $17 = 5
(lldb) po i
5
4.call command
The above is to dynamically modify the value of variables, Xcode also supports dynamic calling functions. When executing this command on the console, you can modify the view on the interface without modifying the code or recompiling. Here is an example of removing a subview of the cell dynamically:
(lldb) po cell.contentView.subviews
<__NSArrayM 0x60800005f5f0>(
<UILabel: 0x7f91f4f18c90; frame = (5 5; 300 25); text = '2 - Drawing index is top ...'; userInteractionEnabled = NO; tag = 1; layer = <_UILabelLayer: 0x60800009ff40>>,
<UIImageView: 0x7f91f4d20050; frame = (105 20; 85 85); opaque = NO; userInteractionEnabled = NO; tag = 2; layer = <CALayer: 0x60000003ff60>>,
<UIImageView: 0x7f91f4f18f10; frame = (200 20; 85 85); opaque = NO; userInteractionEnabled = NO; tag = 3; layer = <CALayer: 0x608000039860>>
)(lldb) call [label removeFromSuperview]
(lldb) po cell.contentView.subviews
<__NSArrayM 0x600000246de0>(
<UIImageView: 0x7f91f4d20050; frame = (105 20; 85 85); opaque = NO; userInteractionEnabled = NO; tag = 2; layer = <CALayer: 0x60000003ff60>>,
<UIImageView: 0x7f91f4f18f10; frame = (200 20; 85 85); opaque = NO; userInteractionEnabled = NO; tag = 3; layer = <CALayer: 0x608000039860>>
)
5.bt command
The bt command prints out the thread's stack information, which is more detailed than what the Debug Navigator on the left sees.
The bt command prints the stack information of the current thread
(lldb) bt
* thread #1: tid = 0x27363, 0x000000010d204125 TestDemo-[FifthViewController tableView:cellForRowAtIndexPath:](self=0x00007f91f4e153c0, _cmd="tableView:cellForRowAtIndexPath:", tableView=0x00007f91f5889600, indexPath=0xc000000000400016) + 2757 at FifthViewController.m:91, queue = 'com.apple.main-thread', stop reason = breakpoint 6.1 * frame #0: 0x000000010d204125 TestDemo-[FifthViewController tableView:cellForRowAtIndexPath:](self=0x00007f91f4e153c0, _cmd="tableView:cellForRowAtIndexPath:", tableView=0x00007f91f5889600, indexPath=0xc000000000400016) + 2757 at FifthViewController.m:91
frame #1: 0x0000000111d0a7b5 UIKit-[UITableView _createPreparedCellForGlobalRow:withIndexPath:willDisplay:] + 757 frame #2: 0x0000000111d0aa13 UIKit-[UITableView _createPreparedCellForGlobalRow:willDisplay:] + 74
frame #3: 0x0000000111cde47d UIKit-[UITableView _updateVisibleCellsNow:isRecursive:] + 3295 frame #4: 0x0000000111d13d95 UIKit-[UITableView _performWithCachedTraitCollection:] + 110
frame #5: 0x0000000111cfa5ef UIKit-[UITableView layoutSubviews] + 222 frame #6: 0x0000000111c61f50 UIKit-[UIView(CALayerDelegate) layoutSublayersOfLayer:] + 1237
frame #7: 0x00000001117a5cc4 QuartzCore-[CALayer layoutSublayers] + 146 frame #8: 0x0000000111799788 QuartzCoreCA::Layer::layout_if_needed(CA::Transaction) + 366
frame #9: 0x0000000111799606 QuartzCoreCA::Layer::layout_and_display_if_needed(CA::Transaction*) + 24 frame #10: 0x0000000111727680 QuartzCoreCA::Context::commit_transaction(CA::Transaction) + 280
frame #11: 0x0000000111754767 QuartzCoreCA::Transaction::commit() + 475 frame #12: 0x00000001117550d7 QuartzCoreCA::Transaction::observer_callback(__CFRunLoopObserver, unsigned long, void) + 113
frame #13: 0x0000000110743e17 CoreFoundation__CFRUNLOOP_IS_CALLING_OUT_TO_AN_OBSERVER_CALLBACK_FUNCTION__ + 23 frame #14: 0x0000000110743d87 CoreFoundation__CFRunLoopDoObservers + 391
frame #15: 0x0000000110728b9e CoreFoundation__CFRunLoopRun + 1198 frame #16: 0x0000000110728494 CoreFoundationCFRunLoopRunSpecific + 420
frame #17: 0x0000000114390a6f GraphicsServicesGSEventRunModal + 161 frame #18: 0x0000000111b9d964 UIKitUIApplicationMain + 159
frame #19: 0x000000010d21294f TestDemomain(argc=1, argv=0x00007fff529fe620) + 111 at main.m:14 frame #20: 0x000000011458a68d libdyld.dylibstart + 1
(lldb)
The bt all command prints the stack information for all threads. There are too many printed information to display!
As a developer, it is particularly important to have a learning atmosphere and a communication circle. This is my iOS communication group: 519832104 Whether you are Xiaobai or Daniel, welcome to join us, share experience, discuss technology, and let's learn and grow together!
In addition, a copy of interview questions collected by all friends is attached. If you need iOS development learning materials and real interview questions, you can add advanced iOS development communication group, which can be downloaded by yourself!
6.image command
The image list command can list all modules in the current App (this module is useful when the symbol breakpoint follows), and view the code location corresponding to an address. In addition to image list, there are image add, image lookup and other commands. You can view them by yourself. When you encounter crash, you can only see the address of the stack frame when viewing the thread stack. You can easily locate the code line corresponding to this address by using the image lookup – address address address address.
breakpoint
The breakpoints in Xcode are also very learned, including common breakpoints, conditional breakpoints, symbolic breakpoints, exception breakpoints, etc.
1. Common breakpoint
To make a normal breakpoint, just find the corresponding line and click on the left side (line number) of the code.
2. Conditional breakpoint
Conditional breakpoints are useful breakpoints, especially in for loops. If we need to add breakpoints when i = 5, otherwise, we can use conditional breakpoints. The conditional breakpoint is to right-click the normal breakpoint, select Edit Breakpoint... And set another condition
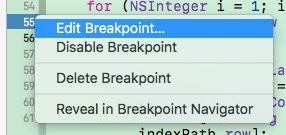
Edit normal breakpoint
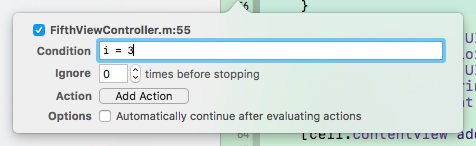
Add condition
3. Symbol breakpoint
A Symbolic Breakpoint is a Symbolic Breakpoint. It is actually a breakpoint for a specific function. It can be an OC function or a C + + function. Add the following:
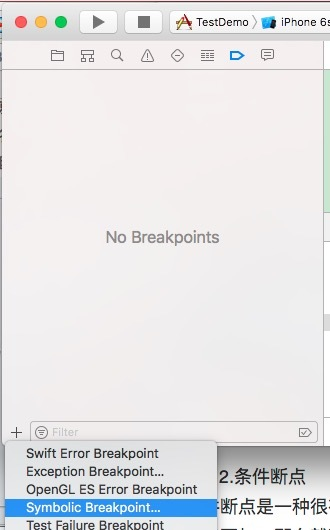
Symbolic breakpoint
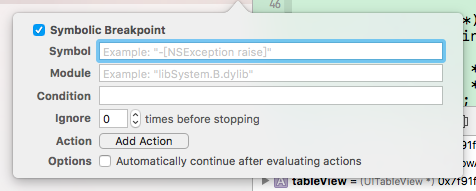
Symbol breakpoint condition
Symbol column can be filled with [class name, method name] or method name. Module is also an optional item. It is the module listed in the image command above. For example, if we fill in only one viewDidLoad, we will break the point at viewDidLoad of all classes (including third-party libraries).
Symbolic breakpoints are more useful when debugging some modules without source code, such as debugging a Lib library provided by a third party, or system modules. You can set breakpoints at the corresponding functions, roughly debug the running process of the program, or view the parameter information at breakpoints.
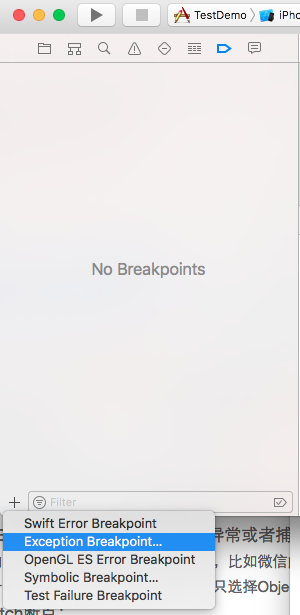
4. Abnormal breakpoint
If the program crashes when running, we can make an exception breakpoint, which will trigger the breakpoint when it crashes. It is easy to locate the problem and see more crash related information, such as Log and function call stack.
Exception Breakpoint
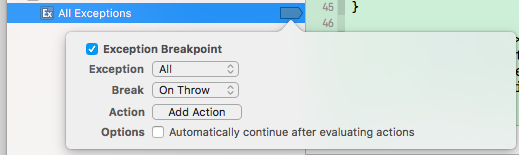
You can modify the condition of an exception breakpoint
Note: some programs or functions may use exceptions to organize program logic. For example, when calling AVAudioPlayer and running to AVAudioPlayer, breakpoints will be triggered. We can modify the Exception parameter or cancel the Exception breakpoint.
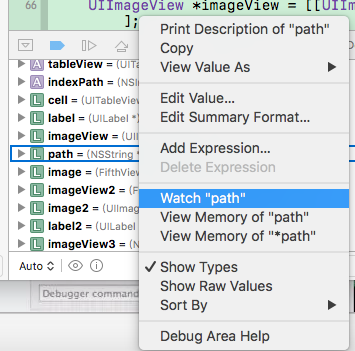
5.Watch breakpoint
Triggered when a variable changes. Create a Watch breakpoint:
There are so many breakpoints and commands in Xcode debugging skills, and other useful ones will be added later.