The debugging skills in Xcode are closely related to our daily development. These debugging skills often have half the power when we solve bugs, and often use various breakpoints and commands.
Debug command
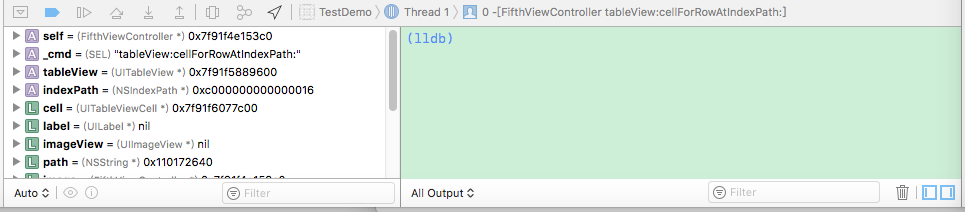
In the above figure, the green area on the right is the Log output area. In the Log output area, you can use some commands to assist debugging.
What are the debugging commands?
If you want to see all the debugging commands, you can type help in the right area of the figure above, and all the debugging commands will be listed.
This article introduces some of the high frequency of use, others on the check, self understand it.
-
1. p command
-- ('expression --') Evaluate an expression on the current thread.
           Displays any returned value with LLDB's default formatting.
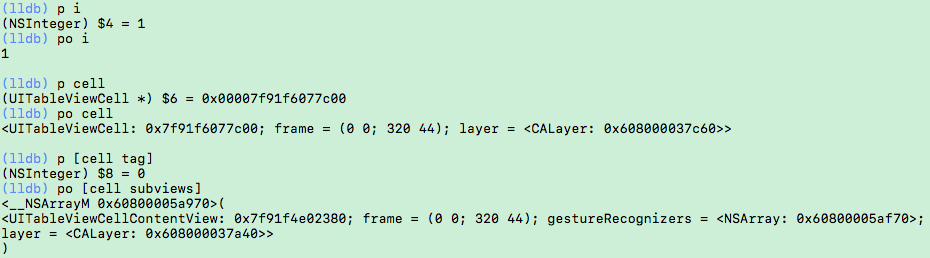
The p command is the abbreviation of the print command. You can use the p command to view the values of basic data types, but if you use the p command to view objects, only the pointer address of the objects will be returned.
The p command can be followed by not only variables and constants, but also expressions. (❌ but you can't use macro ❌)
-
2. po command
The po command can be understood as a print object. The function is similar to the p command, so it can also print constants, variables, objects returned by printing expressions, etc. (❌ macro cannot be printed ❌)
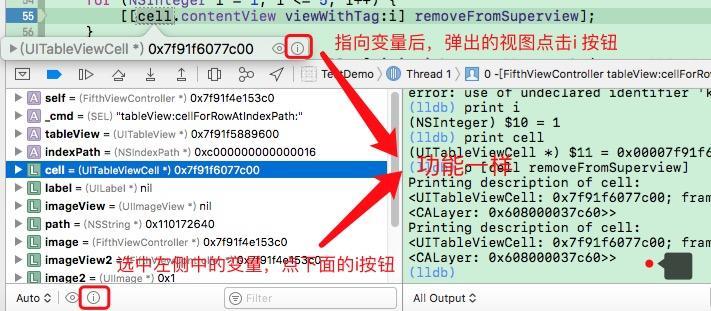
Of course, in addition to using commands, we can also use the left area to right-click variables - > Print description of "xxx":
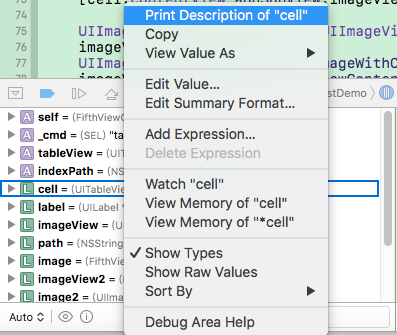
Of course, there are other printing methods:
-
3.expr command
Expr is the abbreviation of expression. With the expr command, you can dynamically execute the assignment expression and print out the result when debugging. We can dynamically change the value of variables when debugging, which is very useful when debugging to let the application execute an exception path (such as executing an else case).
(lldb) p i
(NSInteger) $16 = 1
(lldb) expression i = 5
(NSInteger) $17 = 5
(lldb) po i
5
-
4.call command
The above is to dynamically modify the value of variables, Xcode also supports dynamic calling functions. When executing this command on the console, you can modify the view on the interface without modifying the code or recompiling.
Here is an example of removing a subview of the cell dynamically:
(lldb) po cell.contentView.subviews
<__NSArrayM 0x60800005f5f0>(
<UILabel: 0x7f91f4f18c90; frame = (5 5; 300 25); text = '2 - Drawing index is top ...'; userInteractionEnabled = NO; tag = 1; layer = <_UILabelLayer: 0x60800009ff40>>,
<UIImageView: 0x7f91f4d20050; frame = (105 20; 85 85); opaque = NO; userInteractionEnabled = NO; tag = 2; layer = <CALayer: 0x60000003ff60>>,
<UIImageView: 0x7f91f4f18f10; frame = (200 20; 85 85); opaque = NO; userInteractionEnabled = NO; tag = 3; layer = <CALayer: 0x608000039860>>
)

(lldb) call [label removeFromSuperview]
(lldb) po cell.contentView.subviews
<__NSArrayM 0x600000246de0>(
<UIImageView: 0x7f91f4d20050; frame = (105 20; 85 85); opaque = NO; userInteractionEnabled = NO; tag = 2; layer = <CALayer: 0x60000003ff60>>,
<UIImageView: 0x7f91f4f18f10; frame = (200 20; 85 85); opaque = NO; userInteractionEnabled = NO; tag = 3; layer = <CALayer: 0x608000039860>>
)
-
5.bt command
The bt command prints out the thread's stack information, which is more detailed than what the Debug Navigator on the left sees.
The bt command prints the stack information of the current thread
(lldb) bt
* thread #1: tid = 0x27363, 0x000000010d204125 TestDemo`-[FifthViewController tableView:cellForRowAtIndexPath:](self=0x00007f91f4e153c0, _cmd="tableView:cellForRowAtIndexPath:", tableView=0x00007f91f5889600, indexPath=0xc000000000400016) + 2757 at FifthViewController.m:91, queue = 'com.apple.main-thread', stop reason = breakpoint 6.1
 * frame #0: 0x000000010d204125 TestDemo`-[FifthViewController tableView:cellForRowAtIndexPath:](self=0x00007f91f4e153c0, _cmd="tableView:cellForRowAtIndexPath:", tableView=0x00007f91f5889600, indexPath=0xc000000000400016) + 2757 at FifthViewController.m:91
  frame #1: 0x0000000111d0a7b5 UIKit`-[UITableView _createPreparedCellForGlobalRow:withIndexPath:willDisplay:] + 757
  frame #2: 0x0000000111d0aa13 UIKit`-[UITableView _createPreparedCellForGlobalRow:willDisplay:] + 74
  frame #3: 0x0000000111cde47d UIKit`-[UITableView _updateVisibleCellsNow:isRecursive:] + 3295
  frame #4: 0x0000000111d13d95 UIKit`-[UITableView _performWithCachedTraitCollection:] + 110
  frame #5: 0x0000000111cfa5ef UIKit`-[UITableView layoutSubviews] + 222
  frame #6: 0x0000000111c61f50 UIKit`-[UIView(CALayerDelegate) layoutSublayersOfLayer:] + 1237
  frame #7: 0x00000001117a5cc4 QuartzCore`-[CALayer layoutSublayers] + 146
  frame #8: 0x0000000111799788 QuartzCore`CA::Layer::layout_if_needed(CA::Transaction*) + 366
  frame #9: 0x0000000111799606 QuartzCore`CA::Layer::layout_and_display_if_needed(CA::Transaction*) + 24
  frame #10: 0x0000000111727680 QuartzCore`CA::Context::commit_transaction(CA::Transaction*) + 280
  frame #11: 0x0000000111754767 QuartzCore`CA::Transaction::commit() + 475
  frame #12: 0x00000001117550d7 QuartzCore`CA::Transaction::observer_callback(__CFRunLoopObserver*, unsigned long, void*) + 113
  frame #13: 0x0000000110743e17 CoreFoundation`__CFRUNLOOP_IS_CALLING_OUT_TO_AN_OBSERVER_CALLBACK_FUNCTION__ + 23
  frame #14: 0x0000000110743d87 CoreFoundation`__CFRunLoopDoObservers + 391
  frame #15: 0x0000000110728b9e CoreFoundation`__CFRunLoopRun + 1198
  frame #16: 0x0000000110728494 CoreFoundation`CFRunLoopRunSpecific + 420
  frame #17: 0x0000000114390a6f GraphicsServices`GSEventRunModal + 161
  frame #18: 0x0000000111b9d964 UIKit`UIApplicationMain + 159
  frame #19: 0x000000010d21294f TestDemo`main(argc=1, argv=0x00007fff529fe620) + 111 at main.m:14
  frame #20: 0x000000011458a68d libdyld.dylib`start + 1
(lldb)
The bt all command prints the stack information for all threads. There are too many printed information to display!
-
6.image command
image list
The command can list all modules in the current App (this module is useful when the symbol breakpoint follows), and view the code location corresponding to an address.
In addition to image list, there are image add, image lookup and other commands. You can view them by yourself.
When you encounter crash, you can only see the address of the stack frame when viewing the thread stack. You can easily locate the code line corresponding to this address by using the image lookup – address address address address.

