Sketch
In the development of WPF, it is often necessary to draw curves, histograms, etc. Although WPF has its own basic functions such as drawing graphics, a very basic principle of programming is to avoid repeated wheel building. The official WPF drawing curve open source library of Microsoft was found on GitHub: InteractiveDataDisplay.WPF.
The IDE I use is VS201x, and NuGet installation is recommended -- reference InteractiveDataDisplay.WPF. How to use NuGet Baidu.
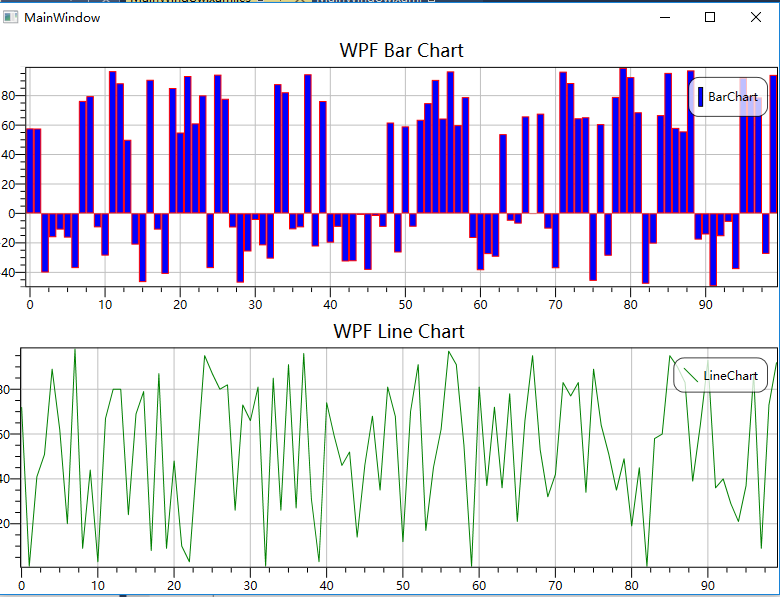
The following is the WPF curve program drawn by the open source library I tested.
Code
MainWindow.xaml
<Window x:Class="WpfDrawPlot.MainWindow"
        xmlns="http://schemas.microsoft.com/winfx/2006/xaml/presentation"
        xmlns:x="http://schemas.microsoft.com/winfx/2006/xaml"
        xmlns:d3="clr-namespace:InteractiveDataDisplay.WPF;assembly=InteractiveDataDisplay.WPF"
        Title="MainWindow" Height="600" Width="800">
    <Grid>
        <Grid.RowDefinitions>
            <RowDefinition Height="*"/>
            <RowDefinition Height="*"/>
        </Grid.RowDefinitions>

        <!-- BarGraph -->
        <d3:Chart Grid.Row="0">
            <d3:Chart.Title>
                <TextBlock Text="WPF Bar Chart" HorizontalAlignment="Center" FontSize="18" Margin="0, 5"/>
            </d3:Chart.Title>
            <d3:BarGraph x:Name="BarChart" Description="BarChart" Stroke="Red" StrokeThickness="1"/>
        </d3:Chart>

        <!-- LineGraph -->
        <d3:Chart x:Name="LinePlot" Grid.Row="1">
            <d3:Chart.Title>
                <TextBlock Text="WPF Line Chart" HorizontalAlignment="Center" FontSize="18" Margin="0, 5"/>
            </d3:Chart.Title>
            <d3:LineGraph x:Name="LineChart" Description="LineChart" Stroke="Green" StrokeThickness="1"/>
        </d3:Chart>

    </Grid>
</Window>
MainWindow.cs
using System;
using System.Collections.Generic;
using System.Linq;
using System.Text;
using System.Threading.Tasks;
using System.Windows;
using System.Windows.Controls;
using System.Windows.Data;
using System.Windows.Documents;
using System.Windows.Input;
using System.Windows.Media;
using System.Windows.Media.Imaging;
using System.Windows.Navigation;
using System.Windows.Shapes;
using System.Threading;
using InteractiveDataDisplay.WPF;

namespace WpfDrawPlot
{
    /// <summary>
    ///Interaction logic of MainWindow.xaml
    /// </summary>
    public partial class MainWindow : Window
    {
        public MainWindow()
        {
            InitializeComponent();

            //Update curve in thread
            Thread threadTmp = new Thread( UpdateChart );
            threadTmp.Start();
        }

        private void UpdateChart()
        {
            int nPointNum = 100;
            Random randm = new Random();
            double[] dArray = new double[ nPointNum ];
            double[] dX = new double[ nPointNum ];
            double[] dY = new double[ nPointNum ];
            double dRandomtTmp = 0;

            while( true )
            {
                Thread.Sleep( 1000 );//Refresh once per second
                for ( int n = 0; n < dArray.Length; n++ )
                {
                    dRandomtTmp = randm.NextDouble();
                    dArray[ n ] = ( dRandomtTmp < 0.5 ) ? -dRandomtTmp * dArray.Length : dRandomtTmp * dArray.Length;
                }
                for ( int n = 0; n < dX.Length; n++ )
                {
                    dX[ n ] = n;
                    dY[ n ] = randm.Next( dX.Length );
                }

                //Update UI
                Dispatcher.Invoke( new Action( delegate
                {
                    this.BarChart.PlotBars( dArray );
                    this.LineChart.Plot( dX, dY );
                } ) );
            }
        }
    }
}
Effect