background information
Recent re-reading of some books on windows performance, for a lazy person like me who used SCOM monitoring, the windows OS template on Zabbix is not enough, because the previous SCOM monitoring package (Microsoft has done all the work, I just need to enable rules and alerts as needed). Yes.
The default Zabbix performance data is only Avg Latency, and the average data is not accurate. If you want to see the Latency of disk and IOPS, you have to do it yourself. If you look at the grammar of windows performance Counter in Zabbix, I flinch a little. Counter Category and CounterName are all digital performance counters.
Only the transmission speed and average latency are the statistics related to the self-contained disk.
If other performance counters are to be monitored, what are their names and what are their functions? Is there a list that can be quickly searched?
Solve by knife
Fortunately, powershell is easy to write. It has written the following function, which integrates the grammar of zabbix performance counter.
function Get-PerfCounterDesc{
    [cmdletbinding()]
    param(
        [switch]$show
    )

    $Categories = [System.Diagnostics.PerformanceCounterCategory]::GetCategories()
    $SingleInstanceCategories = $Categories | Where-Object {$_.CategoryType -eq "SingleInstance"}
    $MultiInstanceCategories =  $Categories| Where-Object {$_.CategoryType -eq "MultiInstance"}

    $SingleInstanceCounters = $SingleInstanceCategories | ForEach-Object {
        (new-object System.Diagnostics.PerformanceCounterCategory($_.CategoryName)).GetCounters()
    }
    $MultiInstanceCounters = $MultiInstanceCategories | ForEach-Object {
        $category=new-object System.Diagnostics.PerformanceCounterCategory($_.CategoryName)
        if($category.InstanceExists('_Total')){
            $category.GetCounters('_Total')
        }elseif($category.InstanceExists('Total')){
            $category.GetCounters('Total')
        }else{
            $instanceNames=$category.GetInstanceNames()
            if($instanceNames.count -gt 0){
                $category.GetCounters($instanceNames[0])
            }
        }
    }

    $AllCounters = $MultiInstanceCounters + $SingleInstanceCounters
    $key="HKLM:\SOFTWARE\Microsoft\Windows NT\CurrentVersion\Perflib\009"

    $counters=Get-ItemPropertyValue -Path $key -Name "counter"
    $Dict=@{}

    for ($i=0;$i -lt $counters.count;$i=$i+2){
        if($counters[$i+1] -and -not $Dict.ContainsKey($counters[$i+1])){
            $Dict.add($counters[$i+1],$counters[$i])
        }
    }
    Write-Debug $dict.keys.count
    $result=$AllCounters | Sort-Object Categoryname,Countername|
            Select-Object CategoryName,
            Countername,
            @{n="zabbixPerfCounter";e={'perf_counter["\{0}({{#ReplaceThis}})\{1}"]' -f $dict[$_.CategoryName],$dict[$_.Countername]}},
            @{n="categoryNum";e={$Dict[$_.CategoryName]}},
            @{n="CounterNum";e={$Dict[$_.Countername]}},
            CategoryHelp,
            CounterHelp

    if($show){
        $result|Out-GridView
    }else{
        $result
    }
}
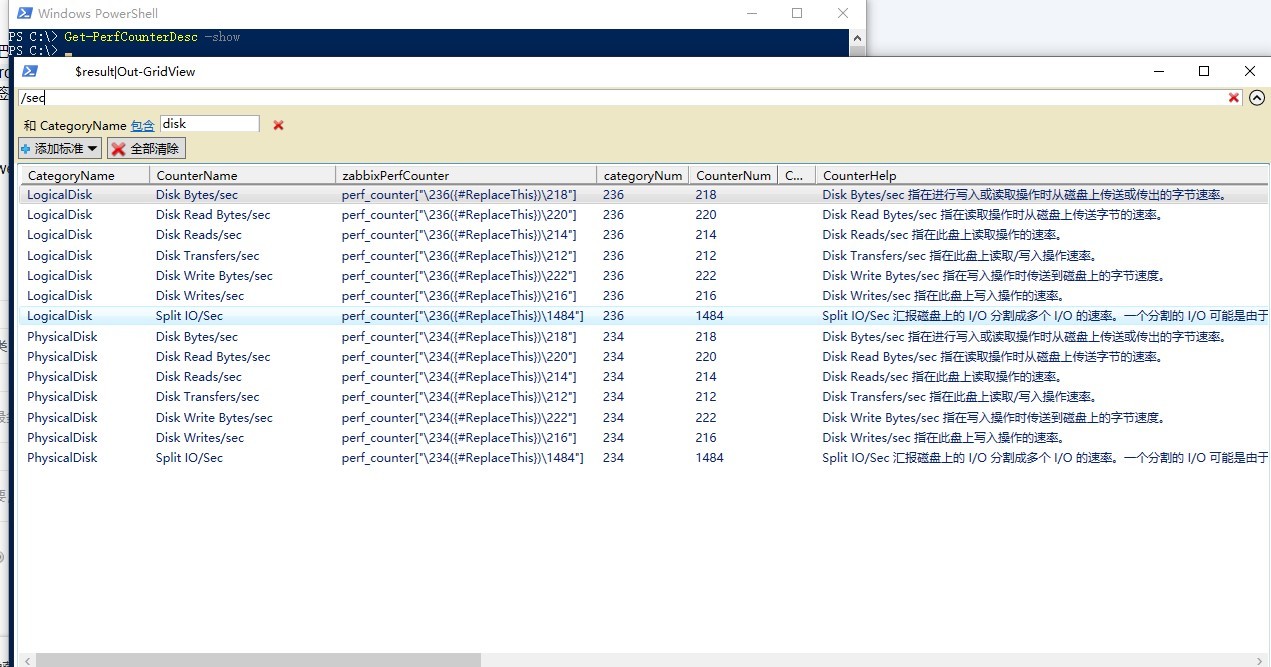
How to use it? Add the above function directly to the personal powershell configuration file, that is, in the powershell console notepad $profile, paste the content in it, save it, and then set the set executionpolicy remotesigned to make the custom unsigned script run.
A new power shell, directly tapping Get-PerfCounterDesc-show, filters the results. The zabbixPerfCounter column is the key used in the generated zabbix, in which {replaceThis} is replaced by the instance name of the counter. For example _total.
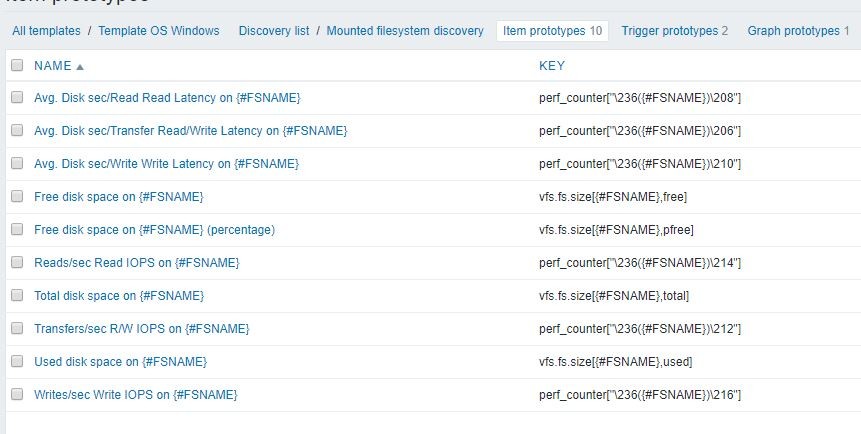
Then I added the following counter to the zabbix template to display the disk IOPS and Latency
item prototype
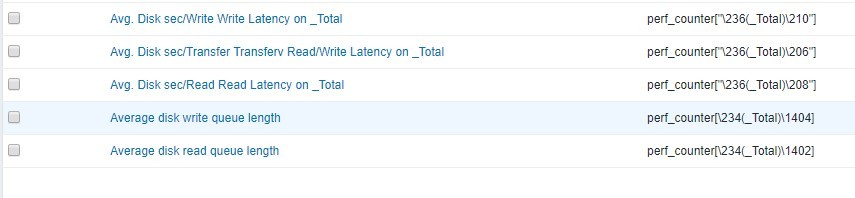
items
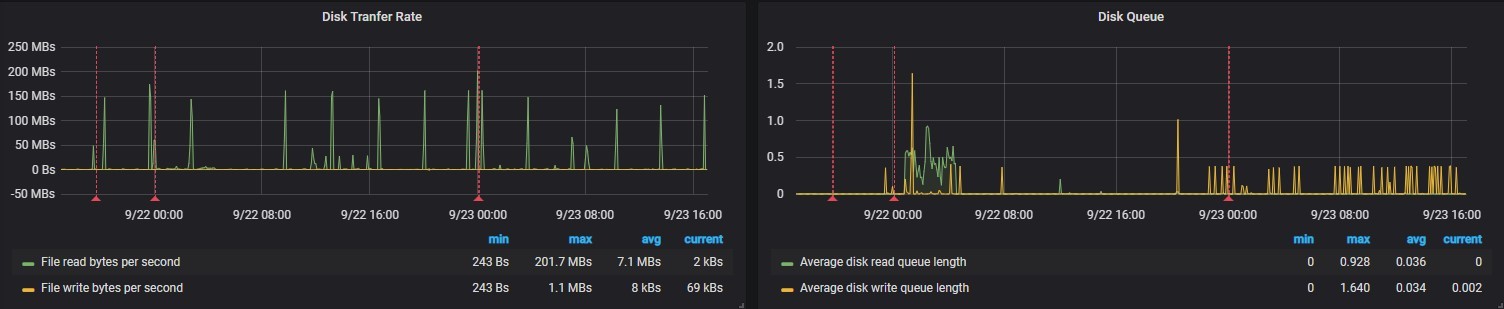
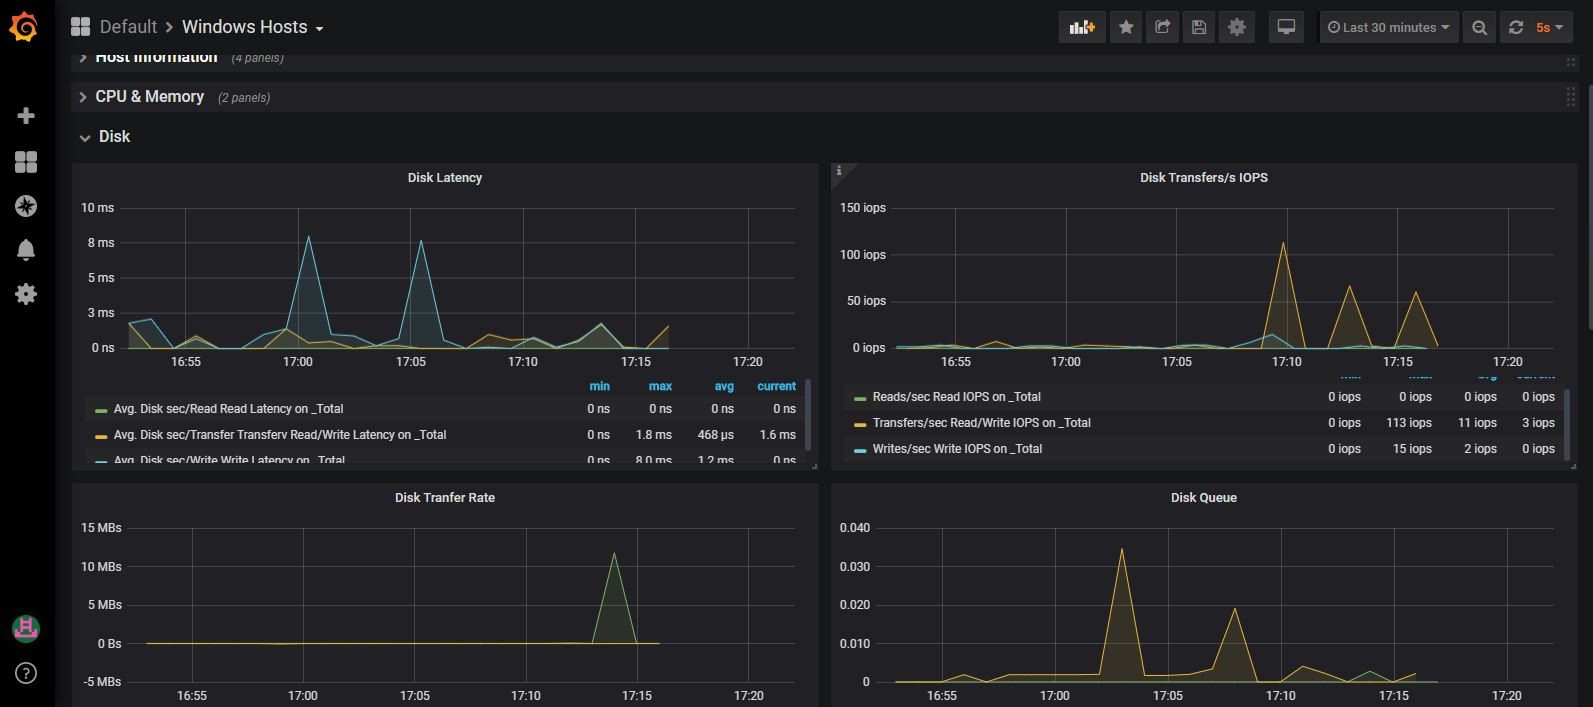
You also need to change Grafana accordingly
## Supplementary Resources and References