In fact, copykat is only unsatisfactory when judging by the algorithm, but the visualization is still that the naked eye can clearly distinguish diploid normal cells and aneuploid cancer cells, so we want to see what specific improvements can be made to bypass this bug. The first choice is that we split all epithelial cells according to patients, Get the separate folder for each patient as shown below and the expFile.txt under each folder!
   81M 12  2 10:09 S11/expFile.txt
  123M 12  2 10:22 S21/expFile.txt
   84M 12  2 10:41 S47/expFile.txt
   75M 12  2 10:54 S50/expFile.txt
   78M 12  2 11:05 S53/expFile.txt
   95M 12  2 11:20 S56/expFile.txt
   95M 12  2 11:34 S57/expFile.txt
   78M 12  2 11:49 S58/expFile.txt
  107M 12  2 12:01 S63/expFile.txt
   77M 12  2 12:17 S65/expFile.txt
   87M 12  2 12:29 S66/expFile.txt
   87M 12  2 12:42 S69/expFile.txt
   79M 12  2 12:56 S71/expFile.txt
   75M 12  2 13:08 S72/expFile.txt
   76M 12  2 13:19 S74/expFile.txt
   78M 12  2 13:34 S78/expFile.txt
   77M 12  2 13:45 S79/expFile.txt
   77M 12  2 13:57 S81/expFile.txt
   84M 12  2 14:09 S82/expFile.txt
In this way, I only need to write a simple script Step4 run copykat. R, which can save the country by parallel curves in the way of all samples, which can also be regarded as parallel computing.
This simple script Step4 run copykat. R is the following shell script:
ls -d S*|while read id;do
echo $id;
cd $id;
nohup Rscript.exe ../scripts/step4-run-copykat.R &
cd ../
done
It is easy to see the single cell level cell expression matrix of each patient. Running this copykat process takes time:
S11/nohup.out:Time difference of 54.33337 mins
S21/nohup.out:Time difference of 1.20906 hours
S47/nohup.out:Time difference of 54.88378 mins
S50/nohup.out:Time difference of 43.44914 mins
S53/nohup.out:Time difference of 51.72247 mins
S56/nohup.out:Time difference of 1.020941 hours
S57/nohup.out:Time difference of 1.001784 hours
S58/nohup.out:Time difference of 52.24233 mins
S63/nohup.out:Time difference of 1.096883 hours
S65/nohup.out:Time difference of 45.49075 mins
S66/nohup.out:Time difference of 56.40917 mins
S69/nohup.out:Time difference of 56.40654 mins
S71/nohup.out:Time difference of 52.58897 mins
S72/nohup.out:Time difference of 42.06179 mins
S74/nohup.out:Time difference of 47.09917 mins
S78/nohup.out:Time difference of 49.3231 mins
S79/nohup.out:Time difference of 50.86545 mins
S81/nohup.out:Time difference of 44.29561 mins
S82/nohup.out:Time difference of 45.59241 mins
Moreover, I briefly looked at the discrimination difference between diploid normal cells and aneuploid cells in these patients:
tail -n  6  S*/nohup.out
==> S11/nohup.out <==
               aneuploid diploid
  epi                177       0
  ref-Bcells           7     389
  ref-Tcells           0     478
  spike-Bcells         6     235
  spike-Tcells         0     289

==> S21/nohup.out <==
               aneuploid diploid
  epi                935      23
  ref-Bcells           9     393
  ref-Tcells           0     480
  spike-Bcells         4     241
  spike-Tcells         0     289

==> S47/nohup.out <==
               aneuploid diploid
  epi                195      13
  ref-Bcells           9     385
  ref-Tcells           0     477
  spike-Bcells         6     232
  spike-Tcells         0     289

==> S50/nohup.out <==
               aneuploid diploid
  epi                 27       8
  ref-Bcells         316      77
  ref-Tcells          20     457
  spike-Bcells       184      55
  spike-Tcells        24     265

==> S53/nohup.out <==
               aneuploid diploid
  epi                 74      27
  ref-Bcells           0     393
  ref-Tcells           0     477
  spike-Bcells         1     238
  spike-Tcells         0     289

==> S56/nohup.out <==
               aneuploid diploid
  epi                348     114
  ref-Bcells           0     399
  ref-Tcells           0     477
  spike-Bcells         0     241
  spike-Tcells         0     289

==> S57/nohup.out <==
               aneuploid diploid
  epi                104     356
  ref-Bcells           0     395
  ref-Tcells           0     477
  spike-Bcells         0     239
  spike-Tcells         0     289

==> S58/nohup.out <==
               aneuploid diploid
  epi                 96       2
  ref-Bcells         311      82
  ref-Tcells          16     461
  spike-Bcells       180      60
  spike-Tcells        18     271

==> S63/nohup.out <==
               aneuploid diploid
  epi                605      80
  ref-Bcells           0     400
  ref-Tcells           1     477
  spike-Bcells         0     243
  spike-Tcells         0     289

==> S65/nohup.out <==
               aneuploid diploid
  epi                 56      28
  ref-Bcells         307      84
  ref-Tcells          32     445
  spike-Bcells       190      45
  spike-Tcells        29     257

==> S66/nohup.out <==
               aneuploid diploid
  epi                266      19
  ref-Bcells          16     379
  ref-Tcells           0     478
  spike-Bcells         9     234
  spike-Tcells         2     287

==> S69/nohup.out <==
               aneuploid diploid
  epi                290       3
  ref-Bcells           7     391
  ref-Tcells           0     479
  spike-Bcells         5     238
  spike-Tcells         0     289

==> S71/nohup.out <==
               aneuploid diploid
  epi                 71      52
  ref-Bcells           0     393
  ref-Tcells           0     477
  spike-Bcells         0     240
  spike-Tcells         0     289

==> S72/nohup.out <==
               aneuploid diploid
  epi                 28       2
  ref-Bcells         317      75
  ref-Tcells          29     448
  spike-Bcells       188      47
  spike-Tcells        32     254

==> S74/nohup.out <==
               aneuploid diploid
  epi                 48      25
  ref-Bcells           0     393
  ref-Tcells           0     477
  spike-Bcells         1     238
  spike-Tcells         0     289

==> S78/nohup.out <==
               aneuploid diploid
  epi                 94       8
  ref-Bcells         317      75
  ref-Tcells          35     442
  spike-Bcells       192      44
  spike-Tcells        31     255

==> S79/nohup.out <==
               aneuploid diploid
  epi                 46      53
  ref-Bcells         313      80
  ref-Tcells          28     449
  spike-Bcells       183      57
  spike-Tcells        31     258

==> S81/nohup.out <==
               aneuploid diploid
  epi                 75       3
  ref-Bcells         309      83
  ref-Tcells          21     456
  spike-Bcells       187      49
  spike-Tcells        20     266

==> S82/nohup.out <==
               aneuploid diploid
  epi                 70      15
  ref-Bcells          83     308
  ref-Tcells         455      22
  spike-Bcells        49     186
  spike-Tcells       259      27
This is very interesting. It can be seen that there are very strange discrimination of single cells in half of the patients, such as S82/nohup.out, in which a large number of ref and spike are judged as malignant cells. Let's look at its chart:
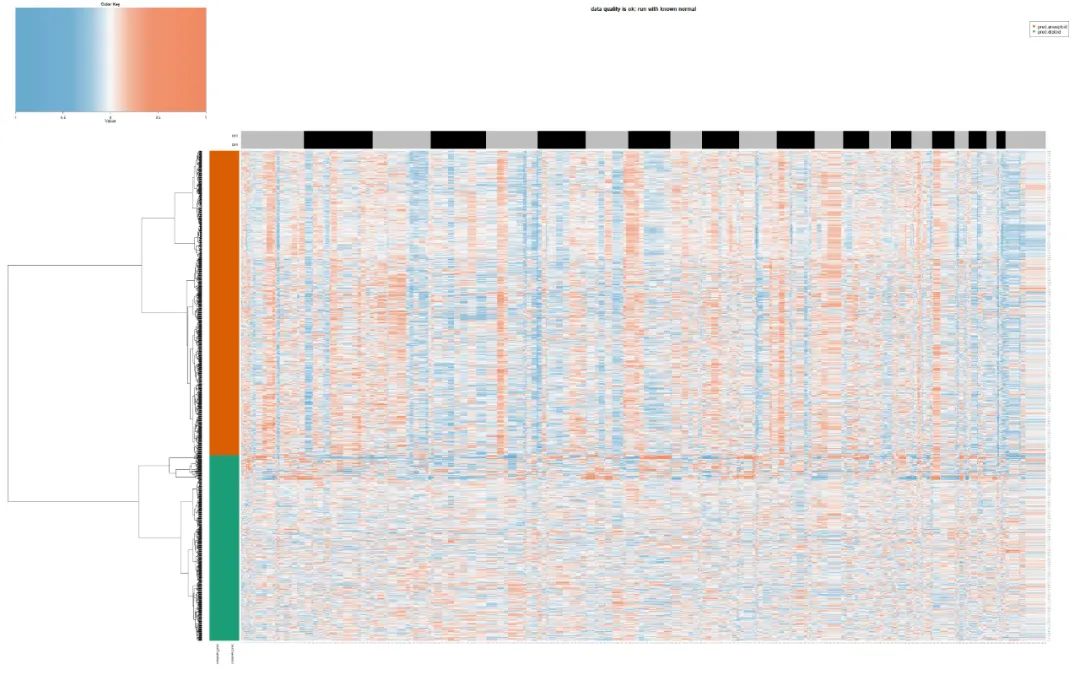
test_copykat_heatmap
It's really a little strange. At this time, the naked eye is actually the same as the software! And I went to see its inforcnv results, as shown below:
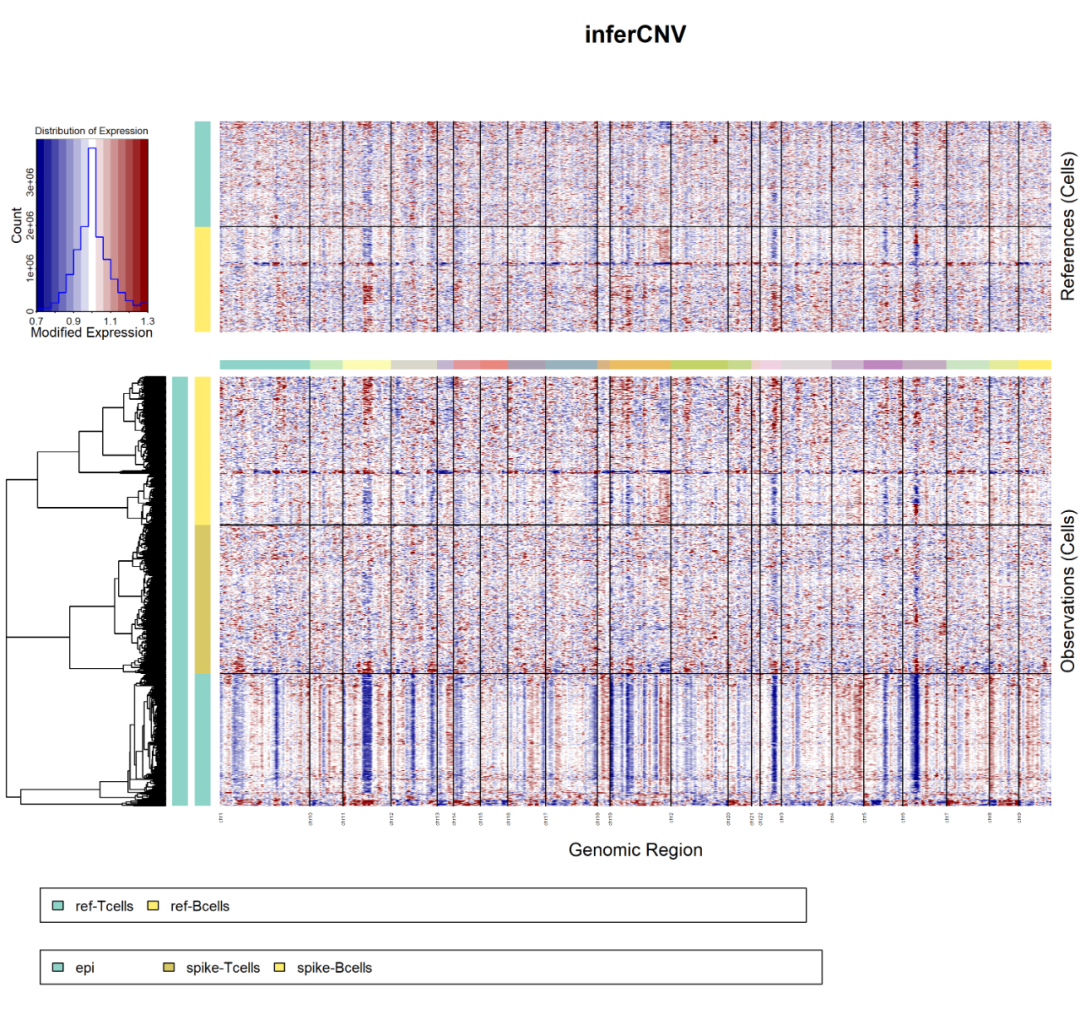
infercnv
It can be seen that copykat is just not intuitive, but in such patient data with a low proportion of malignant cells, there is no much difference in the effect, which is consistent with the conclusion of judging whether the cells are malignant or not by the naked eye! Although copykat mistakenly identified a large number of ref and spike as malignant cells, it is obvious that we will turn to the previous malignant epithelial cells as normal cells. At this time, there is some suspicion of idealism.
Although copykat is just not intuitive as inforcnv, copykat at least gives the judgment of aneuploid and diploid. The result file given by inforcnv still needs to be read by yourself, calculate the cnv score by yourself, and give a threshold to distinguish whether the cell is malignant or not. This step is also a test of your programming skills. You need to familiarize yourself with the following 5 tutorials:
- CNS chart reproduction 13 - use inforcnv to distinguish whether tumor cells are malignant or not
- CNS chart reproduction 14 - infocnv process for literature review
- CNS chart reproduction 15 - uncover the big difference of input data in infocnv process
- CNS chart reproduction 16 - Interpretation and utilization of infocnv results
- CNS chart reproduction 17 - advanced interpretation and utilization of infocnv results
If you also have your own copy number variation analysis needs of tumor related single-cell data, and you always report errors in many attempts, please leave a message and entrust us. The copy number variation single analysis of tumor related single-cell data is 2400. If the previous Dimension Reduction Clustering clustering is required, an additional 800 is required to provide an independent copykat and inforcnv process for distinguishing samples, as well as all the results and code folders of the combined copykat and inforcnv processes.
It should be noted that we will not keep the txt and other files in the middle, because it consumes too much disk space. For example, the project we demonstrated has less than 7000 epithelial cells from more than 20 patients. By following the copykat and inforcnv processes, we obtained nearly 100G files:
 11G ./4-3-only-Epi
478M ./Rdata-celltype
 81G ./epi-one-by-one