For developers and operation and maintenance personnel, the monitoring screen is great. Let's make a Dashboard! You may have heard of some CLI diagnostic tools, such as dotnet counters, dotnet dump and dotnet trace. What is dotnet monitor? The simple understanding is to package the above diagnostic tools and expose the corresponding rest APIs to make diagnosis easier. Last year, dotnet monitor was an experimental diagnostic tool. At that time, I also wrote an article to introduce dotnet monitor, Analyzing. NET applications using dotnet monitor Recently, the. NET team announced the first release version of dotnet monitor, which is also the content of. NET 6 😍, That is dotnet monitor 6.0.0!
Today, we are mainly concerned about the indicators, that is, the / metrics endpoint. As mentioned in the document, it displays the metrics snapshot of the current dotnet program in the format of Prometheus. By the way, this is a very simple format, as follows:
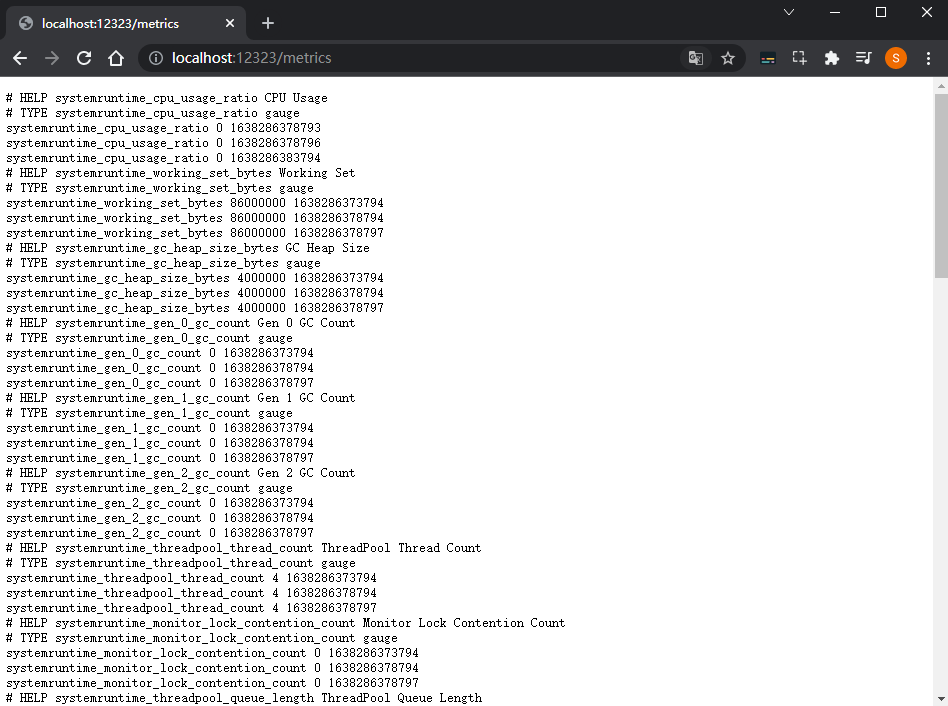
# HELP systemruntime_cpu_usage_ratio CPU Usage
# TYPE systemruntime_cpu_usage_ratio gauge
systemruntime_cpu_usage_ratio 0 1632929076109
systemruntime_cpu_usage_ratio 0 1632929076111
systemruntime_cpu_usage_ratio 0 1632929086110
# HELP systemruntime_working_set_bytes Working Set
# TYPE systemruntime_working_set_bytes gauge
systemruntime_working_set_bytes 1529000000 1632929066112
systemruntime_working_set_bytes 1529000000 1632929076110
systemruntime_working_set_bytes 1529000000 1632929076112
...
# HELP systemruntime_time_in_gc_ratio % Time in GC since last GC
# TYPE systemruntime_time_in_gc_ratio gauge
systemruntime_time_in_gc_ratio 0 1632929066112
systemruntime_time_in_gc_ratio 0 1632929076110
systemruntime_time_in_gc_ratio 0 1632929076112
The above is the indicator of System.Runtime counters. Next, we need to display this information on the Grafana Dashboard.
1. Prepare a dotnet core application
For better demonstration, here we use a sample memory leak project, which is a. NET 5 application. You can find it on github and download it locally
https://github.com/sebastienros/memoryleak
git clone https://github.com/sebastienros/memoryleak.git
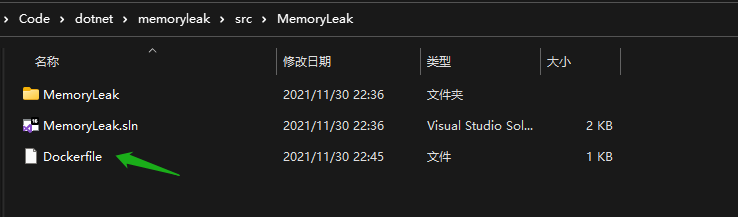
Next, let's run the application in the docker container. A Dockerfile file is prepared here. You need to manually add it to the solution directory of the project
# https://hub.docker.com/_/microsoft-dotnet
FROM mcr.microsoft.com/dotnet/sdk:5.0 AS build
WORKDIR /source

COPY . .
RUN dotnet restore
RUN dotnet publish -c release -o /app --no-restore

# final stage/image
FROM mcr.microsoft.com/dotnet/aspnet:5.0
RUN apt-get update && apt-get install -y procps
WORKDIR /app
COPY --from=build /app .
ENTRYPOINT ["dotnet", "MemoryLeak.dll"]
Then build the mirror
docker build --pull -t memoryleak-image -f Dockerfile .
Because our dotnet monitor runs in the sidecar container, we need to share volume (for IPC communication). Use the following command to create a volume
docker volume create dotnet-tmp
Now we are ready to run our memoryleak image and map port 80 -- > 5000
docker run -d -it --rm -e TZ=Asia/Shanghai -p 5000:80 --mount "source=dotnet-tmp,target=/tmp" memoryleak-image
After running successfully, access http://localhost:5000/

2. dotnet-monitor
We can install dotnet monitor as a global tool, but let's continue to use the Docker container. There are container images available on the Microsoft Container Registry. Just use the following command:
docker run -d -it --rm -e TZ=Asia/Shanghai -p 12323:52323 --mount "source=dotnet-tmp,target=/tmp" mcr.microsoft.com/dotnet/monitor --urls http://*:52323 --no-auth
Similarly, mount the dotnet TMP volume we created above, and then access http://localhost:12323/metrics , now you can see the indicator information
3. Prometheus
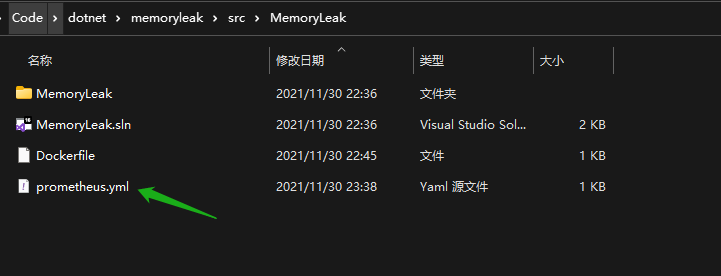
Prometheus is a free monitoring system and time series database. We need to store the metrics indicator information collected by dotnet monitor. Similarly, we can run / install Prometheus in various ways. Here we continue to use Docker. First, we need a prometheus.yml configuration file, which you can manually add to the solution directory
global:
  scrape_interval: 15s
  scrape_timeout: 10s
  evaluation_interval: 15s
alerting:
  alertmanagers:
  - scheme: http
    timeout: 10s
    api_version: v1
    static_configs:
    - targets: []
scrape_configs:
- job_name: prometheus
  honor_timestamps: true
  scrape_interval: 15s
  scrape_timeout: 10s
  metrics_path: /metrics
  scheme: http
  static_configs:
  - targets:
    - localhost:9090
- job_name: memoryleak
  honor_timestamps: true
  scrape_interval: 2s
  scrape_timeout: 2s
  metrics_path: /metrics
  scheme: http
  static_configs:
  - targets:
    - host.docker.internal:12323
In the above configuration, timed 2s capture http://host.docker.internal:12323/metrics , this is the indicator information exposed by dotnet monitor. Then use the following command to start Prometheus in docker. Note that D:\Code\dotnet\memoryleak\src\MemoryLeak\prometheus.yml should be changed to your local prometheus.yml file path.
docker run -d --name prometheus-container -e TZ=Asia/Shanghai -p 30090:9090 -v D:\Code\dotnet\memoryleak\src\MemoryLeak\prometheus.yml:/etc/prometheus/prometheus.yml ubuntu/prometheus
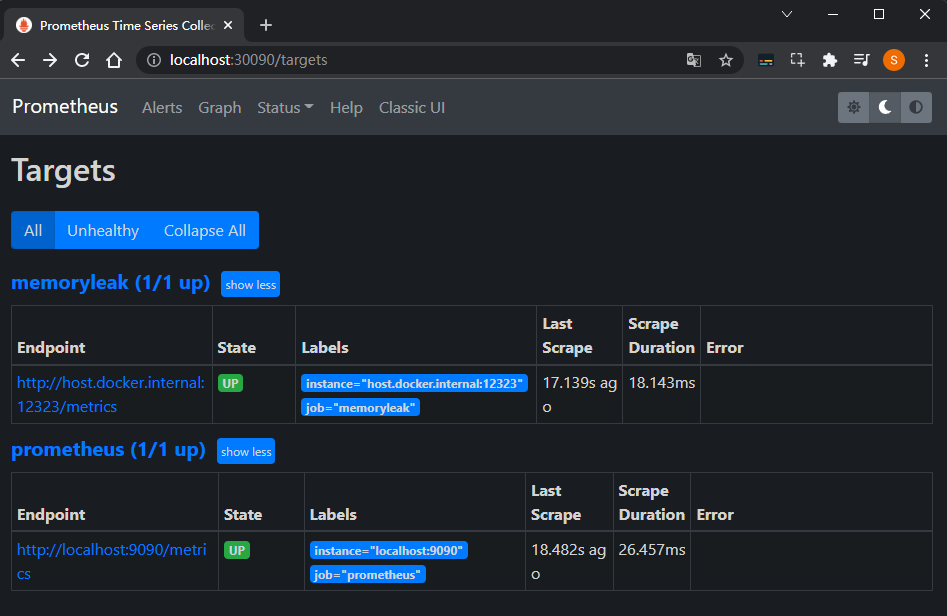
It's that simple. After Prometheus runs, we visit http://localhost:30090/targets , check the running status, and everything is OK
4. Grafana
Finally, we use Grafana for visualization. Similarly, we use the following command to run Grafana in docker
docker run -d -e TZ=Asia/Shanghai -p 3000:3000 grafana/grafana
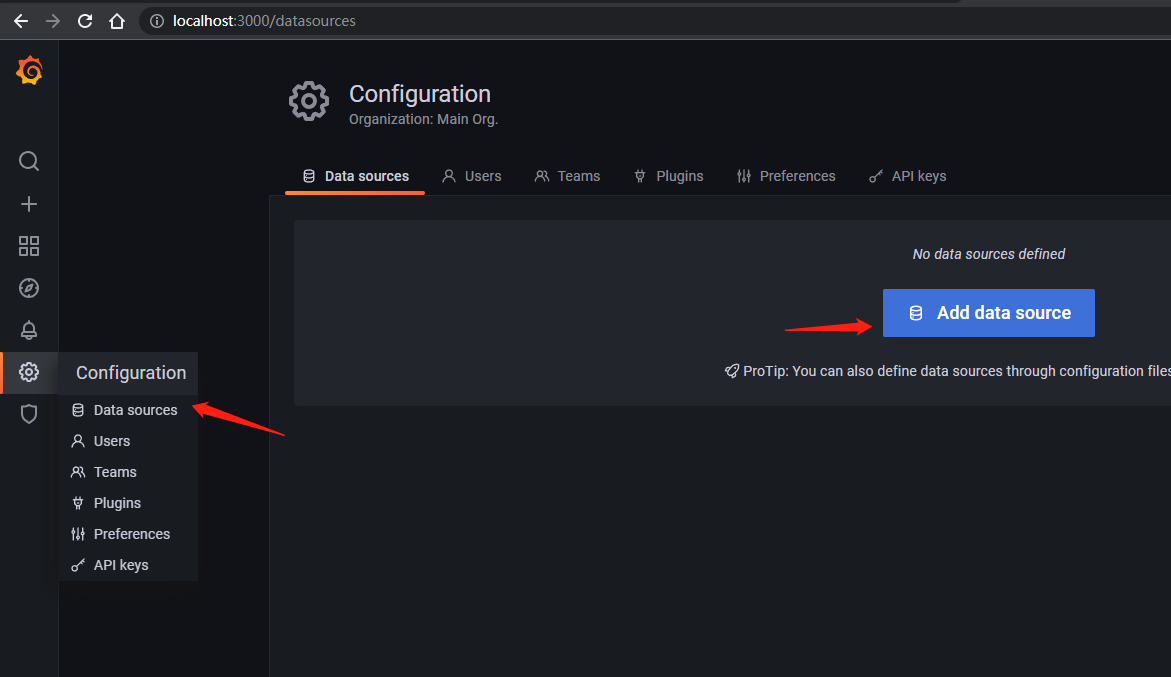
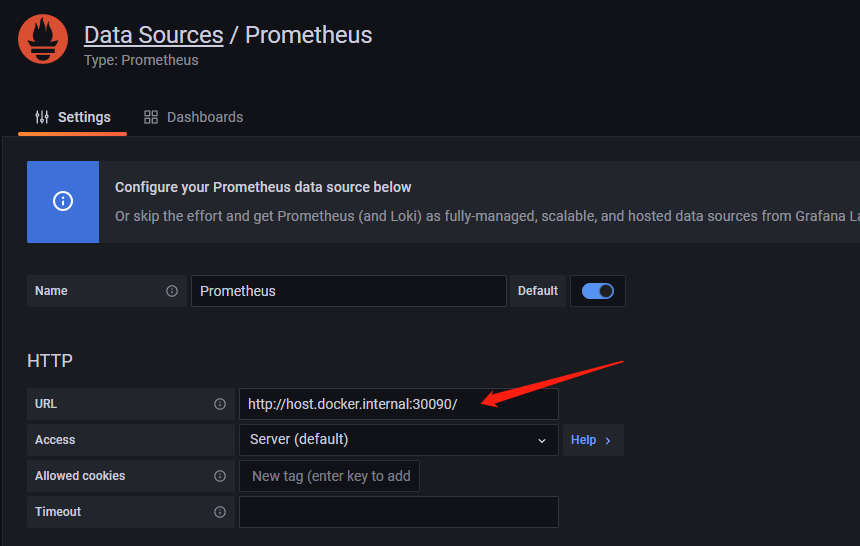
Next, we visit http://localhost:3000/ , you can use admin/admin to log in for the first time, then go to configuration - > data sources, click Add data source to add a data source, select Prometheus, and set the URL to http://host.docker.internal:30090/ , other parameters are default, and then save & test, as shown below
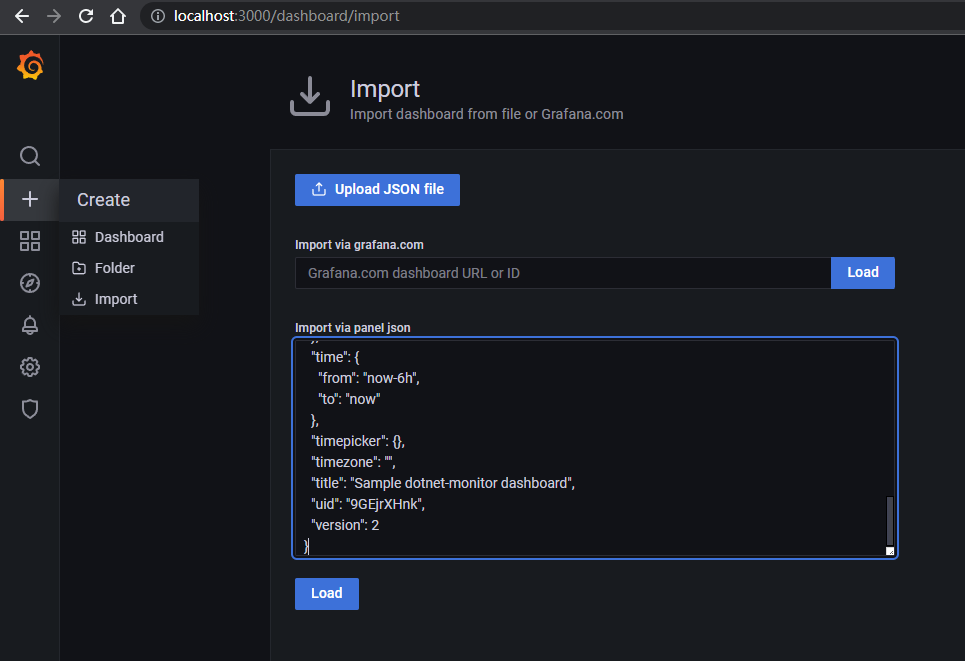
Now that the data source is set, you need to configure the dashboard. Here is a json file. You can directly copy the content to the text box and import it, as shown below
https://dotnetos.org/assets/files/posts/sample-dotnet-monitor-dashboard.json
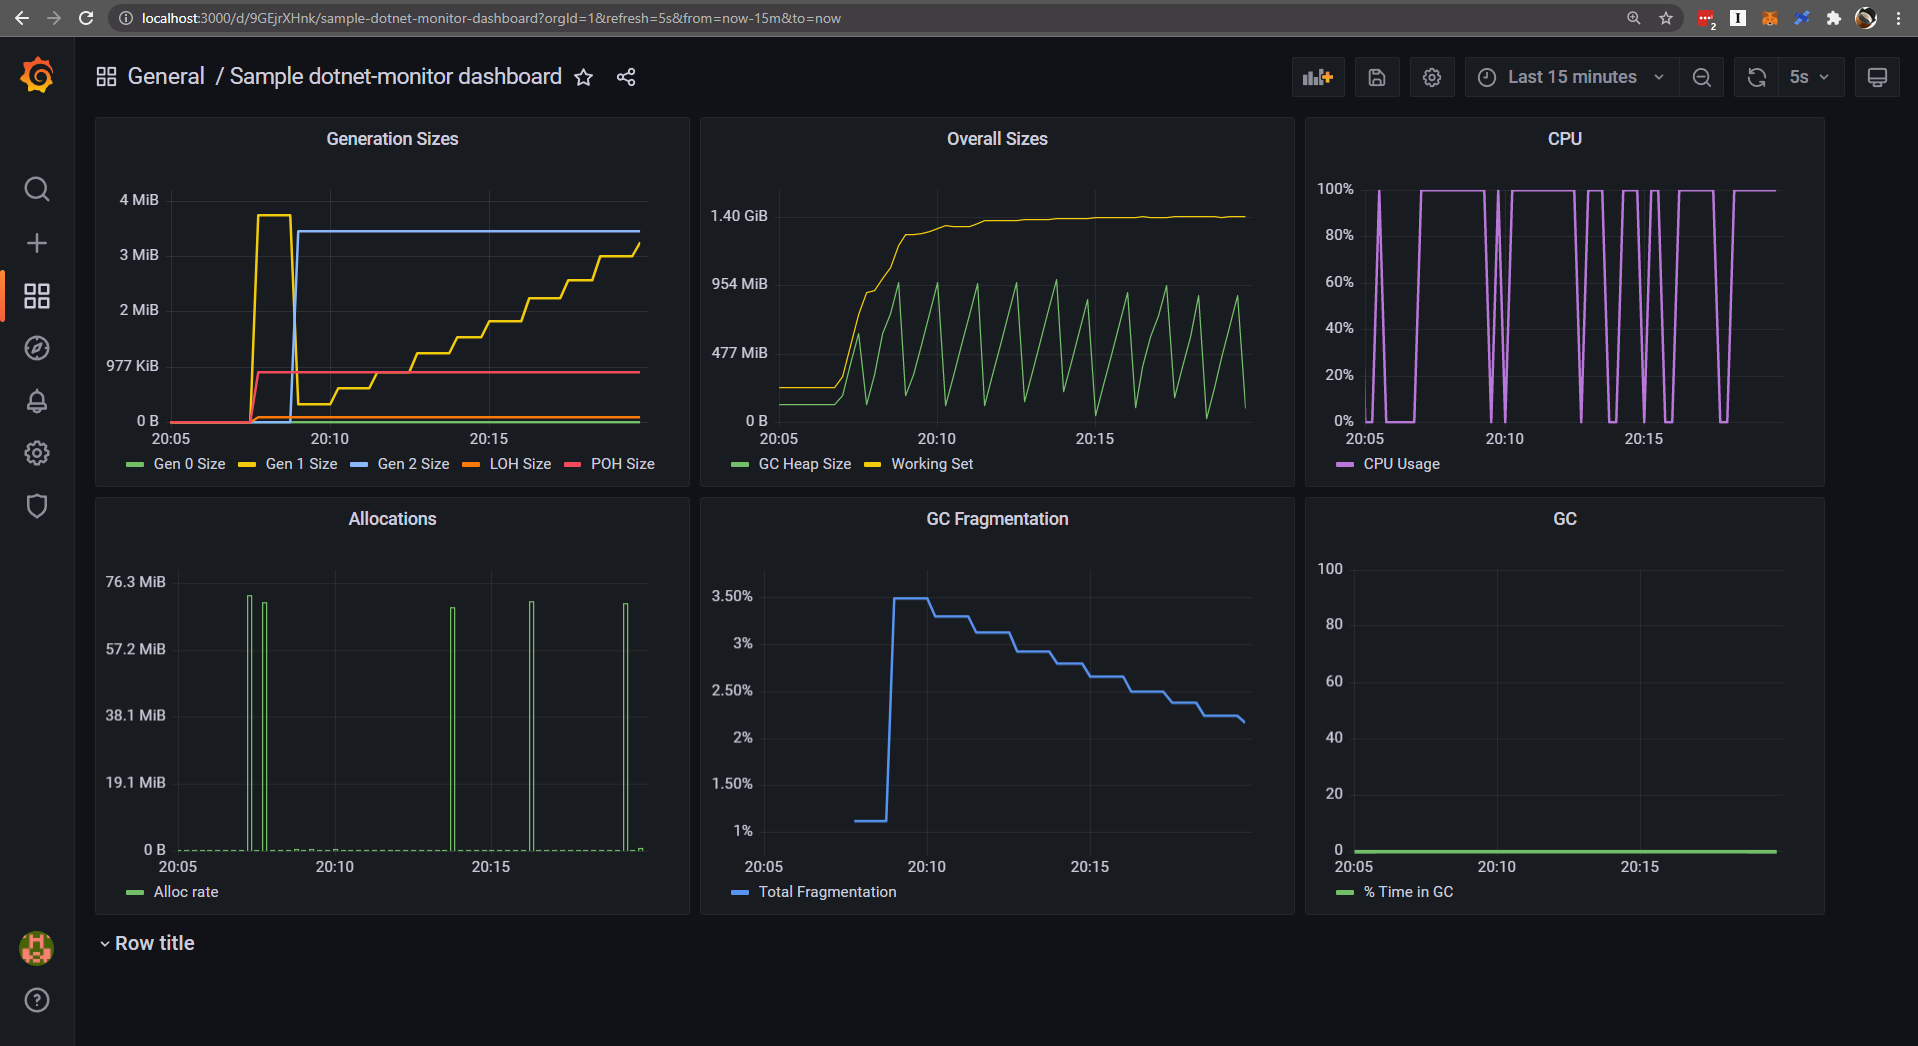
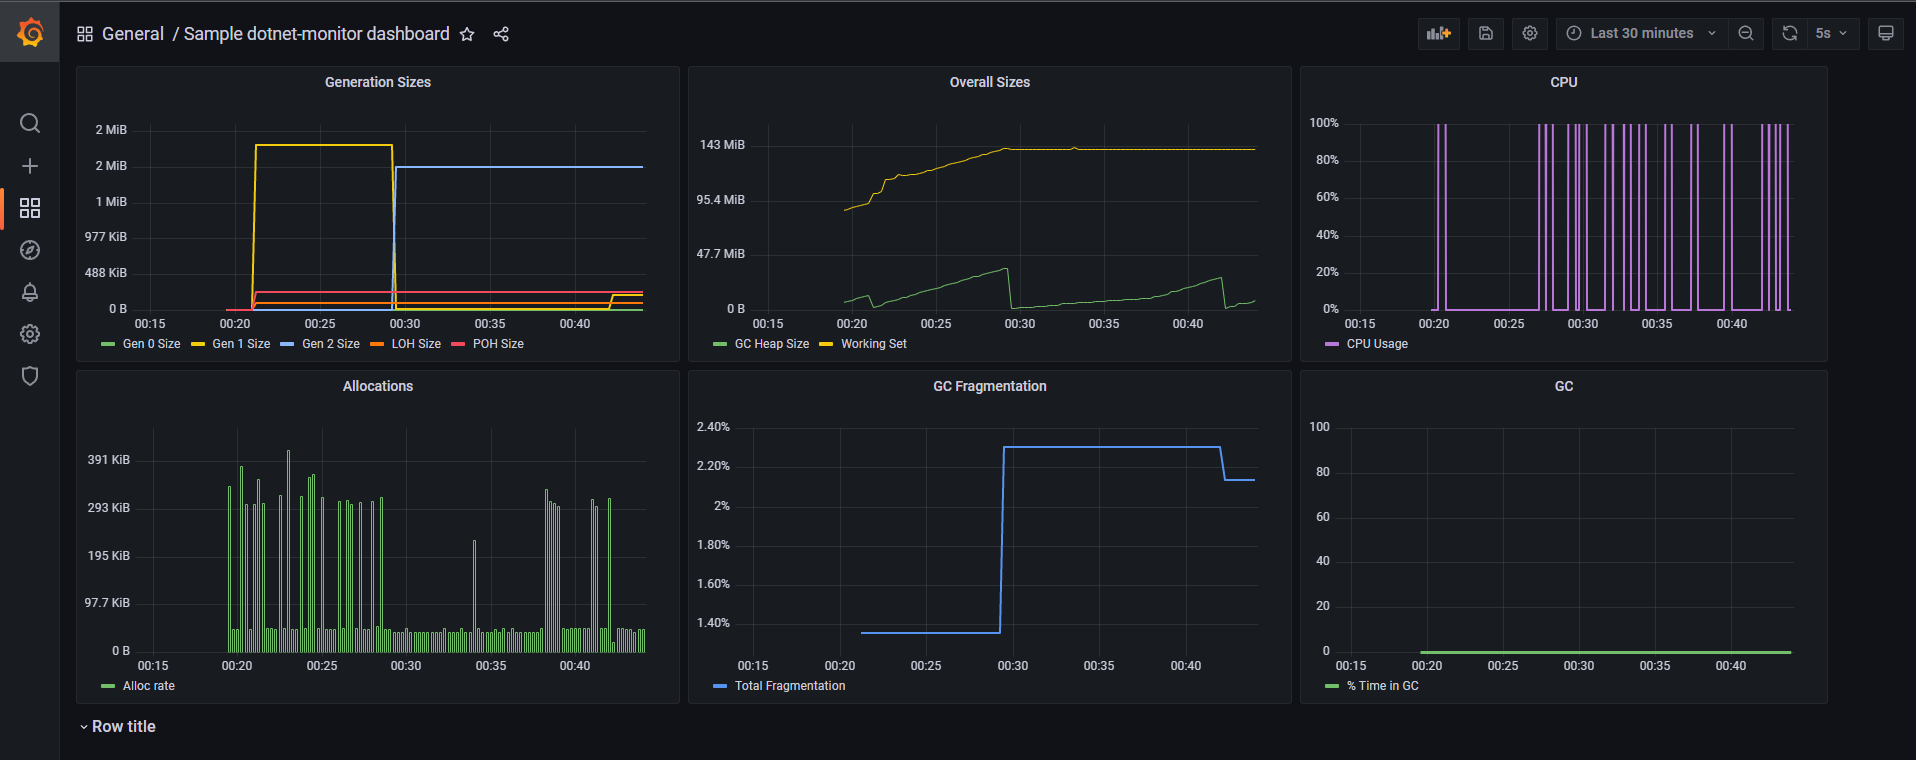
Congratulations, now you have a nice looking dashboard!
summary
Let's review the whole process. There are four containers in total. First, the application of. NET 5, then dotnet monitor collects the indicator information of the application, Prometheus regularly pulls and stores the metrics of dotnet monitor, and finally visualizes it with Grafana.
Original link: https://dotnetos.org/blog/2021-11-22-dotnet-monitor-grafana/