
Author: Xiaolin street corner
https://juejin.cn/post/6942262577460314143
Hello everyone, I'm walking. Today I share a difficult graphic drawing article.
Rough.js[1] is a hand drawn graphics library, which provides some basic graphics rendering capabilities, such as:

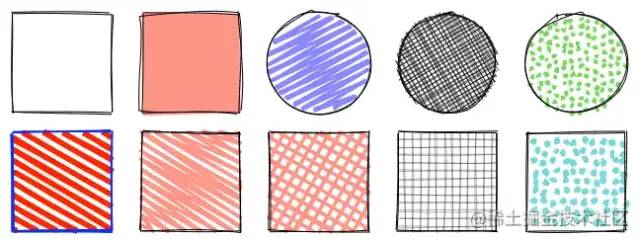
Although the author is a rough man, he has no resistance to such lovely things. The use of this library is very simple and there is nothing to say, but it only has drawing ability and no interaction ability, so the use scene is limited. Let's draw an example graph with it first:
import rough from 'roughjs/bundled/rough.esm.js'

this.rc = rough.canvas(this.$refs.canvas)
this.rc.rectangle(100, 150, 300, 200, {
    fillweight: 0,
    roughness: 3
})
this.rc.circle(195, 220, 40, {
    fill: 'red'
})
this.rc.circle(325, 220, 40, {
    fill: 'red'
})
this.rc.rectangle(225, 270, 80, 30, {
    fill: 'red',
    fillweight: 5
})
this.rc.line(200, 150, 150, 80, { roughness: 5 })
this.rc.line(300, 150, 350, 80, { roughness: 2 })
The effects are as follows:

Isn't it a little stupid? The main content of this article is to take you to manually implement the above graphics, and preview the final effect: lxqnsys.com/#/demo/hand... [2]. Don't say much, see the code.
line segment
Everything is based on line segments, so let's first look at how to draw line segments. If you look at the figure carefully, you will find that the hand drawn line segments are actually composed of two curved line segments. The curve can be drawn using Bezier curve. Here, the cubic Bezier curve is used, so the remaining problem is to find the coordinates of the starting point, the ending point and the two control points. Bezier curves can be tried on this website: cubic Bezier. COM / [3]. First, we add some random values to the starting and ending points of a line segment. For example, the random value is between [- 2,2]. This range can also be associated with the length of the line segment. For example, the longer the line segment, the greater the random value.
// Linear variable curve
_line (x1, y1, x2, y2) {
    let result = []
    // starting point
    result[0] = x1 + this.random(-this.offset, this.offset)
    result[1] = y1 + this.random(-this.offset, this.offset)
    // End
    result[2] = x2 + this.random(-this.offset, this.offset)
    result[3] = y2 + this.random(-this.offset, this.offset)
}
Next, there are two control points. We limit the control points to the rectangle where the line segment is located:
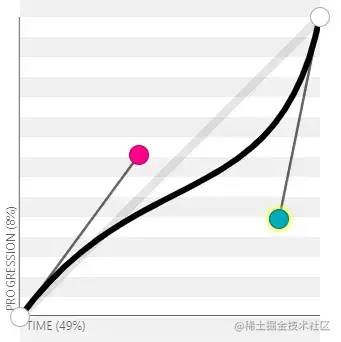
_line (x1, y1, x2, y2) {
    let result = []
    // starting point
    // ...
    // End
    // ...
    // Two control points
    let xo = x2 - x1
    let yo = y2 - y1
    let randomFn = (x) => {
        return x > 0 ? this.random(0, x) : this.random(x, 0)
    }
    result[4] = x1 + randomFn(xo)
    result[5] = y1 + randomFn(yo)
    result[6] = x1 + randomFn(xo)
    result[7] = y1 + randomFn(yo)
    return result
}
Then draw the curve generated above:
// Draw freehand line segments
line (x1, y1, x2, y2) {
 this.drawDoubleLine(x1, y1, x2, y2)
}

// Draw two curves
drawDoubleLine (x1, y1, x2, y2) {
    // Draw the resulting two curves
    let line1 = this._line(x1, y1, x2, y2)
    let line2 = this._line(x1, y1, x2, y2)
    this.drawLine(line1)
    this.drawLine(line2)
}

// Draw a single curve
drawLine (line) {
    this.ctx.beginPath()
    this.ctx.moveTo(line[0], line[1])
    // The first two points of bezierCurveTo method are control points and the third point is the end point
    this.ctx.bezierCurveTo(line[4], line[5], line[6], line[7], line[2], line[3])
    this.ctx.strokeStyle = '#000'
    this.ctx.stroke()
}
The effects are as follows:
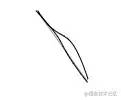
However, if you try several times, you will find that the deviation is too far and the bending degree is too large:
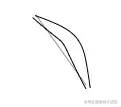
It's completely different from what a person with normal hands can draw. Go to the Bessel curve website above for a few times and you will find that the closer the two control points are to the line segment, the smaller the curve bending degree is:

Therefore, we need to find a point near the line segment as the control point. First, we can randomly a abscissa point, and then we can calculate the ordinate point corresponding to the abscissa on the line segment, and add or subtract a random value from the ordinate point.
_line (x1, y1, x2, y2) {
    let result = []
    // ...
    // Two control points
    let c1 = this.getNearRandomPoint(x1, y1, x2, y2)
    let c2 = this.getNearRandomPoint(x1, y1, x2, y2)
    result[4] = c1[0]
    result[5] = c1[1]
    result[6] = c2[0]
    result[7] = c2[1]
    return result
}

// Calculate a random point near the line segment formed by two points
getNearRandomPoint (x1, y1, x2, y2) {
    let xo, yo, rx, ry
    // Special treatment of line segments perpendicular to x axis
    if (x1 === x2) {
        yo = y2 - y1
        rx = x1 + this.random(-2, 2)// Find a random point near the abscissa
        ry = y1 + yo * this.random(0, 1)// Find a random point on the line segment
        return [rx, ry]
    }
    xo = x2 - x1
    rx = x1 + xo * this.random(0, 1)// Find a random abscissa
    ry = ((rx - x1) * (y2 - y1)) / (x2 - x1) + y1// The linear equation is obtained by two-point formula
    ry += this.random(-2, 2)// Add a random value to the ordinate
    return [rx, ry]
}
Take a look at the effect:
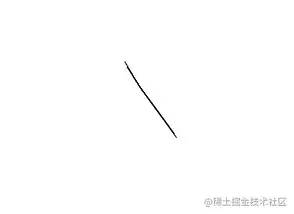
Of course, it's not good enough compared with Rough.js. If you are interested, you can look at the source code by yourself. Anyway, the author can't understand it. There are too many control variables and no comments yet.
Polygon & rectangle
Polygon is to connect multiple points end to end, traverse vertices and call the method of drawing line segments:
// Draw freehand polygons
polygon (points = [], opt = {}) {
    if (points.length < 3) {
        return
    }
    let len = points.length
    for (let i = 0; i < len - 1; i++) {
        this.line(points[i][0], points[i][1], points[i + 1][0], points[i + 1][1])
    }
    // end to end
    this.line(points[len - 1][0], points[len - 1][1], points[0][0], points[0][1])
}
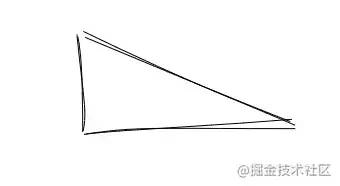
Rectangle is a special case of polygon. All four corners are right angles. Generally, the parameters are the x coordinate, y coordinate, width and height of the top left corner:
// Draw a freehand rectangle
rectangle (x, y, width, height, opt = {}) {
    let points = [
        [x, y],
        [x + width, y],
        [x + width, y + height],
        [x, y + height]
    ]
    this.polygon(points, opt)
}
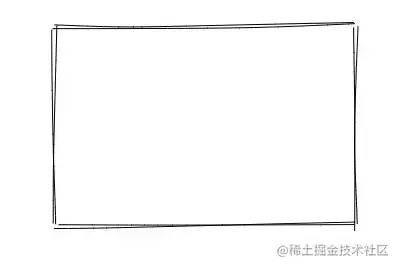
image-20210207161756507.png
circular
How to deal with a circle? First of all, we all know that a circle can be approximated by a polygon. As long as there are enough sides of the polygon, it looks round enough. Since you don't want to be too round, restore it to a polygon. The polygon has been mentioned above. It is easy to restore a circle to a polygon. For example, if we want to convert a circle into a decagonal shape (specifically, you can also associate it with the circumference of the circle), then the radian corresponding to each edge is 2*Math.PI/10, then use Math.cos and Math.sin to calculate the position of vertices, and finally call the method of drawing polygons for drawing:
// Draw a freehand circle
circle (x, y, r) {
    let stepCount = 10
    let step = (2 * Math.PI) / stepCount
    let points = []
    for (let angle = 0; angle < 2 * Math.PI; angle += step) {
        let p = [
            x + r * Math.cos(angle),
            y + r * Math.sin(angle)
        ]
        points.push(p)
    }
    this.polygon(points)
}
The effects are as follows:
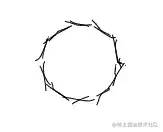
You can see that the effect is very general. Even if the number of edges is a little more, it doesn't look like:
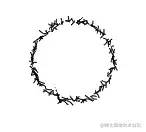
If the normal line segments are directly connected, it will be a serious polygon, and certainly not. Therefore, the core is to turn the line segments into random arcs. First, in order to increase randomness, we add a random increment to the radius of the circle and each vertex:
circle (x, y, r) {
    let stepCount = 10
    let step = (2 * Math.PI) / stepCount
    let points = []
    let rx = r + this.random(-r * 0.05, r * 0.05)
    let ry = r + this.random(-r * 0.05, r * 0.05)
    for (let angle = 0; angle < 2 * Math.PI; angle += step) {
        let p = [
            x + rx * Math.cos(angle) + this.random(-2, 2),
            y + ry * Math.sin(angle) + this.random(-2, 2)
        ]
        points.push(p)
    }
}
The next problem is to calculate the two control points of the Bezier curve. Firstly, because the arc must be convex to the polygon, according to the nature of the Bezier curve, the two control points must be outside the line segment. If I directly use the two endpoints of the line segment itself, I tried it. It is difficult to deal with. Different angles may need special treatment, Therefore, we refer to Rough.js to interval a point:
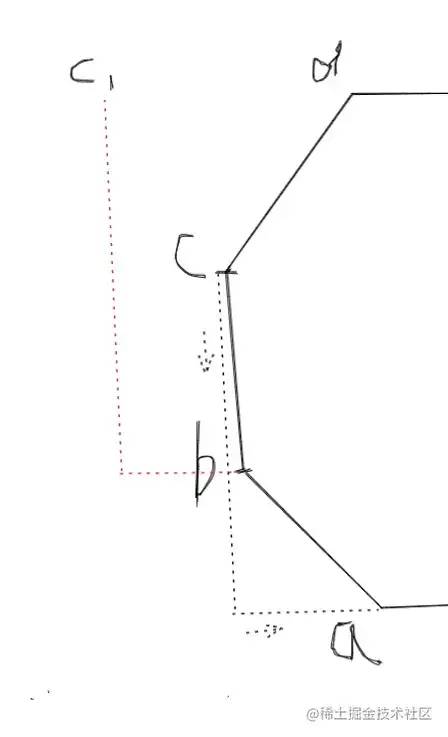
For example, in the polygon in the figure above, we randomly find a line segment bc. For point b, the last point is a, and the next point is c. for point b, add the difference between the abscissa and ordinate of c minus a respectively to get the control point c1. The same is true for other points. The last calculated control points will be outside. Now there is still a control point missing. Let's not leave point c idle, but also add the difference between the front and rear two points:
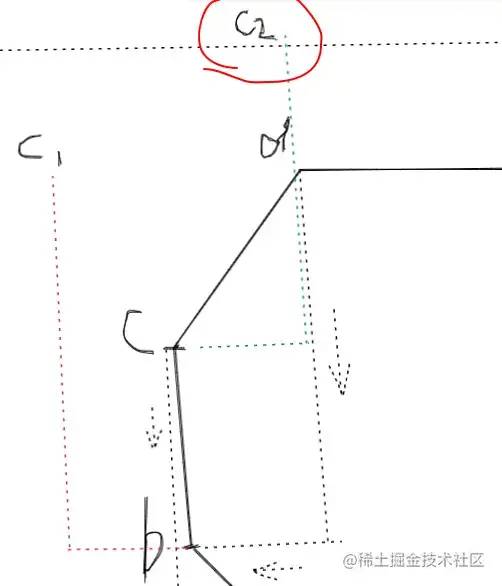
It can be seen that the control points c2 and c1 of point c are on the same side, and the curve drawn in this way is obviously in the same direction:
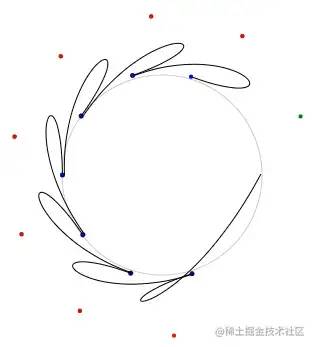
Let's make it symmetrical and subtract the previous point of point c from the next point:
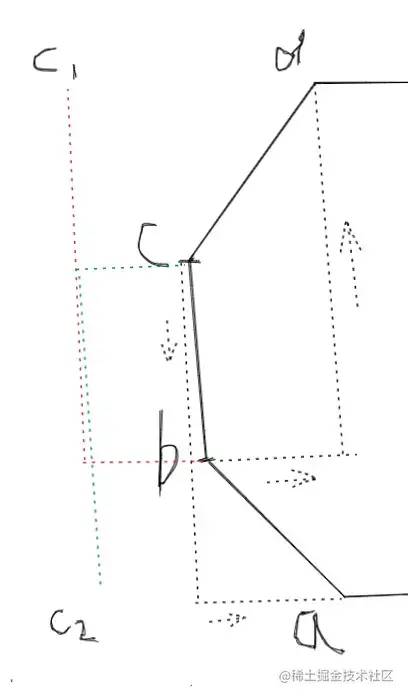
The curve drawn in this way still doesn't work:
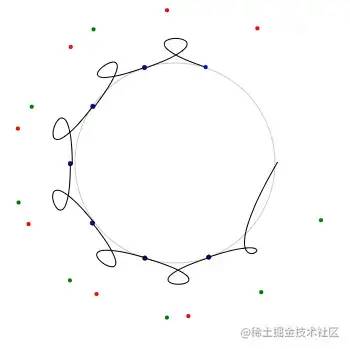
The reason is very simple. The control point is too far away, so we add a little less difference. The final code is as follows:
circle (x, y, r) {
    // ...
    let len = points.length
    this.ctx.beginPath()
    // Move the start point of the path to the first point
    this.ctx.moveTo(points[0][0], points[0][1])
    this.ctx.strokeStyle = '#000'
    for (let i = 1; i + 2 < len; i++) {
        let c1, c2, c3
        let point = points[i]
        // Control point 1
        c1 = [
            point[0] + (points[i + 1][0] - points[i - 1][0]) / 5,
            point[1] + (points[i + 1][1] - points[i - 1][1]) / 5
        ]
        // Control point 2
        c2 = [
            points[i + 1][0] + (point[0] - points[i + 2][0]) / 5,
            points[i + 1][1] + (point[1] - points[i + 2][1]) / 5
        ]
        c3 = [points[i + 1][0], points[i + 1][1]]
        this.ctx.bezierCurveTo(
            c1[0],
            c1[1],
            c2[0],
            c2[1],
            c3[0],
            c3[1]
        )
    }
    this.ctx.stroke()
}
We only add one fifth of the difference. I tried. It's the most natural between 5-7. Rough.js adds one sixth.
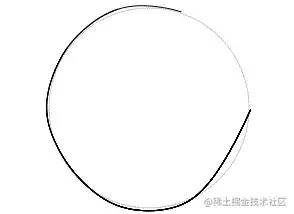
There is no end here. First, there is a gap in the circle. The reason is very simple. The cyclic condition of I + 2 < len causes the last point not to be connected, and the head and tail are not connected. In addition, the first paragraph is very unnatural and too straight. The reason is that the starting point of our path starts from the first point, but the end point of our first curve is the third point, So first move the starting point of the path to the second point:
this.ctx.moveTo(points[1][0], points[1][1])
This makes the gap even larger:
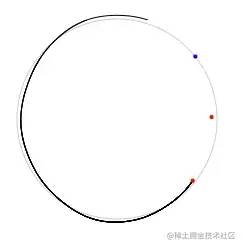
The red one represents the first two points and the blue one represents the last point. In order to connect to the second point, we need to add the first three points in the vertex list to the end of the list:
// Append the first three points to the end of the list
points.push([points[0][0], points[0][1]], [points[1][0], points[1][1]], [points[2][0], points[2][1]])
let len = points.length
this.ctx.beginPath()
// ...
The effects are as follows:
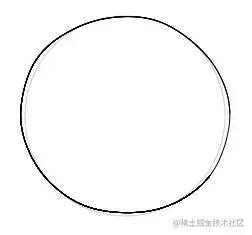
The pink of perfection is as like as two peas. We should not add the second points we can not make it as original as the original ones.
let end = [] // Process the last connection point and make it randomly offset from the original point
let radRandom = step * this.random(0.1, 0.5)// Make this point a little ahead, which means that the painting is too much. You can also use a negative number, which means that it is almost connected, but it is ugly
end[0] = x + rx * Math.cos(step + radRandom)// The last point to connect is actually the second point in the list, so the angle is step instead of 0
end[1] = y + ry * Math.sin(step + radRandom)
points.push(
    [points[0][0], points[0][1]],
    [end[0], end[1]],
    [points[2][0], points[2][1]]
)
let len = points.length
this.ctx.beginPath()
//...
The last point to be optimized is the starting point or the end position. Generally speaking, we draw a circle by hand from the top. Because 0 degree is in the positive axis direction of the x axis, we can move the starting point to the top by subtracting Math.PI/2. Finally, the complete code is as follows:
drawCircle (x, y, r) {
    // Circle to polygon
    let stepCount = 10
    let step = (2 * Math.PI) / stepCount// The angle corresponding to one edge of a polygon
    let startOffset = -Math.PI / 2 + this.random(-Math.PI / 4, Math.PI / 4)// Start offset angle
    let points = []
    let rx = r + this.random(-r * 0.05, r * 0.05)
    let ry = r + this.random(-r * 0.05, r * 0.05)
    for (let angle = startOffset; angle < (2 * Math.PI + startOffset); angle += step) {
        let p = [
            x + rx * Math.cos(angle) + this.random(-2, 2),
            y + ry * Math.sin(angle) + this.random(-2, 2)
        ]
        points.push(p)
    }
    // Line segment variable curve
    let end = [] // Process the last connection point and make it randomly offset from the original point
    let radRandom = step * this.random(0.1, 0.5)
    end[0] = x + rx * Math.cos(startOffset + step + radRandom)
    end[1] = y + ry * Math.sin(startOffset + step + radRandom)
    points.push(
        [points[0][0], points[0][1]],
        [end[0], end[1]],
        [points[2][0], points[2][1]]
    )
    let len = points.length
    this.ctx.beginPath()
    this.ctx.moveTo(points[1][0], points[1][1])
    this.ctx.strokeStyle = '#000'
    for (let i = 1; i + 2 < len; i++) {
        let c1, c2, c3
        let point = points[i]
        let num = 6
        c1 = [
            point[0] + (points[i + 1][0] - points[i - 1][0]) / num,
            point[1] + (points[i + 1][1] - points[i - 1][1]) / num
        ]
        c2 = [
            points[i + 1][0] + (point[0] - points[i + 2][0]) / num,
            points[i + 1][1] + (point[1] - points[i + 2][1]) / num
        ]
        c3 = [points[i + 1][0], points[i + 1][1]]
        this.ctx.bezierCurveTo(c1[0], c1[1], c2[0], c2[1], c3[0], c3[1])
    }
    this.ctx.stroke()
}
The last line can also be drawn twice like the above line segment. The comprehensive effect is as follows:
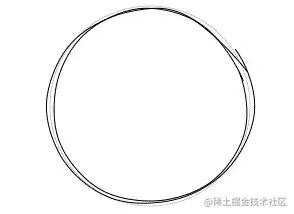
When the circle is finished, the ellipse is similar. After all, the circle is a special case of the ellipse. Incidentally, the approximate circumference formula of the ellipse is as follows:

fill
Style 1
Let's first look at a relatively simple filling method:
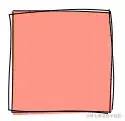
The four edges of the rectangle drawn above are disconnected, and the path is not closed. You cannot directly call the fill method of canvas, so you need to connect the ends of these four curves:
// Draw freehand polygons
polygon (points = [], opt = {}) {
    if (points.length < 3) {
        return
    }
    // Plus filling method
    let lines = this.closeLines(points)
    this.fillLines(lines, opt)

    // Stroke
    let len = points.length
    // ...
}
The closeLines method is used to close vertices into curves:
// Convert the vertices of a polygon into closed segments connected end to end
closeLines (points) {
    let len = points.length
    let lines = []
    let lastPoint = null
    for (let i = 0; i < len - 1; i++) {
        // _ The line method has been implemented above to convert straight line segments into curves
        let arr = this._line(
            points[i][0],
            points[i][1],
            points[i + 1][0],
            points[i + 1][1]
        )
        lines.push([
            lastPoint ? lastPoint[2] : arr[0], // If the previous point exists, the end point of the previous point is used as the starting point of the point
            lastPoint ? lastPoint[3] : arr[1],
            arr[2],
            arr[3],
            arr[4],
            arr[5],
            arr[6],
            arr[7]
        ])
        lastPoint = arr
    }
    // Head tail closure
    let arr = this._line(
        points[len - 1][0],
        points[len - 1][1],
        points[0][0],
        points[0][1]
    )
    lines.push([
        lastPoint ? lastPoint[2] : arr[0],
        lastPoint ? lastPoint[3] : arr[1],
        lines[0][0], // The end point is the starting point of the first segment
        lines[0][1],
        arr[4],
        arr[5],
        arr[6],
        arr[7]
    ])
    return lines
}
As long as the line segments are drawn, the fill method can be called only if the line segments are drawn.
// Fill polygon
fillLines (lines, opt) {
    this.ctx.beginPath()
    this.ctx.fillStyle = opt.fillStyle
    for (let i = 0; i + 1 < lines.length; i++) {
        let line = lines[i]
        if (i === 0) {
            this.ctx.moveTo(line[0], line[1])
        }
        this.ctx.bezierCurveTo(
            line[4],
            line[5],
            line[6],
            line[7],
            line[2],
            line[3]
        )
    }
    this.ctx.fill()
}
The effects are as follows:
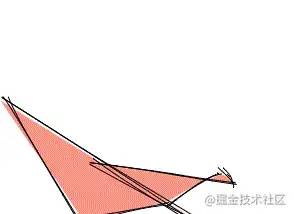
The circle is even simpler. It is almost closed. As long as we remove the special processing logic of the last point:
// Remove the following lines of code and use the original point
let end = []
let radRandom = step * this.random(0.1, 0.5)
end[0] = x + rx * Math.cos(startOffset + step + radRandom)
end[1] = y + ry * Math.sin(startOffset + step + radRandom)
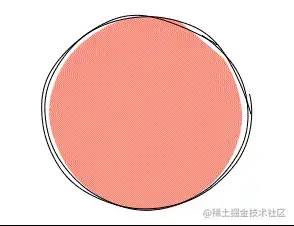
2021-03-19-14-54-42.gif
Style 2
The second filling will be a little more complicated. For example, the simplest filling below is actually some inclined line segments, but the problem is how to determine the endpoints of these line segments. Of course, rectangles can be calculated violently, but what about irregular polygons, so we need to find a general method.
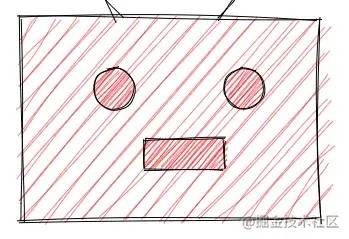
The most violent method of filling is to judge whether each point is inside the polygon, but such calculation is too large. I checked the idea of polygon filling. There are probably two algorithms: scan line filling and seed filling. Scan line filling is more popular, and Rough.js uses this method, so I'll introduce this algorithm next. Scan line filling is very simple, that is, a scan line (horizontal line) starts to scan upward from the bottom of the polygon, then each scan line will have an intersection with the polygon, and the area between the same scan line and each intersection of the polygon is what we want to fill. Then the problem comes, how to determine the intersection and how to judge that the two intersections belong to the interior of the polygon.
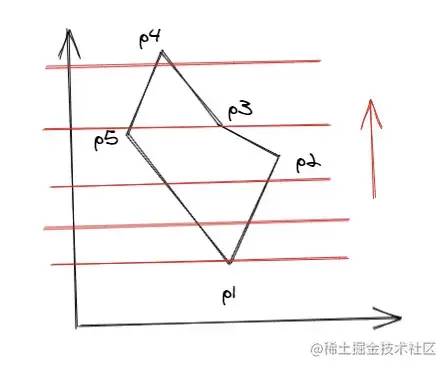
As for the calculation of the intersection, first of all, we know the y coordinate of the intersection, that is, the y coordinate of the scan line. Then we only need to find x and know the coordinates of the two endpoints of the line segment, so we can find the linear equation and then calculate it. However, there is a simpler method, that is, we use the correlation of the edges, that is, we know a point on the line segment, The adjacent points can be easily calculated according to this point. The following is the derivation process:
// Set linear equation
y = kx + b
// Set two points: c(x3, y3), y coordinate of point d as y coordinate of point c + 1, d (x4, y3 + 1), then X4 is required
y3 = kx3 + b// 1
y3 + 1 = kX4 + b// 2
// Replace equation 1 with equation 2
kx3 + b + 1 = kX4 + b
kx3 + 1 = kX4// Appointment b
X4 = x3 + 1 / k// Divide k on both sides at the same time
// Therefore, the y coordinate + 1 and the x coordinate are the x coordinate of the previous point plus the reciprocal of the slope of the straight line
// The line segment of the polygon has two known points. Assuming a (x1, y1) and b (x2, y2), the slope k is as follows:
k = (y2 - y1) /
// The reciprocal of the slope is
1/k = (x2 - x1) / (y2 - y1)
In this way, we can calculate all points on the line segment one by one from one end of the line segment. The detailed algorithm introduction and derivation process can be seen in this PPT: wenku.baidu.com/view/4ee141... [4]. Next, let's directly look at the implementation process of the algorithm. First briefly introduce some nouns: 1. Edge table ET, edge table ET, an array, which stores the information of all edges of the polygon. The information saved by each edge includes: the maximum value ymax and minimum value ymin of the edge y, the x value xi of the lowest point of the edge, and the reciprocal dx of the slope of the edge. The edges are sorted incrementally by ymin. If ymin is the same, xi is incremented. If xi is the same, you can only see ymax. If ymax is still the same, it means that the two edges coincide. If they do not coincide, they are sorted incrementally by yamx. 2. The active edge table AET is also an array, which stores the edge information intersecting with the current scan line. It will change with the scan line. Delete the disjoint and add the new intersection. The edges in the table are sorted in xi increments. For example, the following polygon ET table order is:
// ET
[p1p5, p1p2, p5p4, p2p3, p4p3]
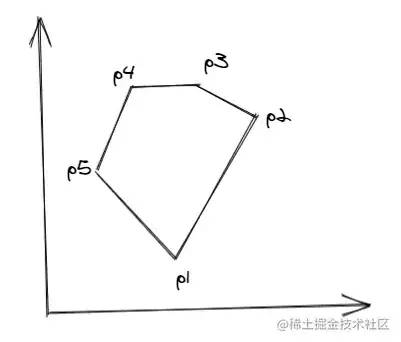
The following are the specific algorithm steps: 1. Create the ET table edgeTable according to the vertex data of the polygon and sort it in the above order; 2. Create an empty AET table activeEdgeTable; 3. Start scanning. Y of the scan line = y value of the lowest point of the polygon, that is, activeEdgeTable[0].ymin; 4. Repeat the following steps until both the ET table and the AET table are empty: (1) take out the edge intersecting the current scan line from the ET table, add it to the AET table, and sort it in the same order as mentioned above; (2) take out the Xi value of the edge information in the AET table in pairs and fill in between each pair (3) delete the last edge currently scanned from the AET table, i.e. Y > = ymax (4) Update Xi of the remaining edge information in the AET table, i.e. xi = xi + dx (5). It is not difficult to update y of the scan line, i.e. y = y + 1. Next, convert it into code and create the following edge table et:
// Create sort edge table ET
createEdgeTable (points) {
    // Side table ET
    let edgeTable = []
    // Copy the first point to the end of the line to close the polygon
    let _points = points.concat([[points[0][0], points[0][1]]])
    let len = _points.length
    for (let i = 0; i < len - 1; i++) {
        let p1 = _points[i]
        let p2 = _points[i + 1]
        // Filter out the line segments parallel to the x axis. See the PPT link above for details
        if (p1[1] !== p2[1]) {
            let ymin = Math.min(p1[1], p2[1])
            edgeTable.push({
                ymin,
                ymax: Math.max(p1[1], p2[1]),
                xi: ymin === p1[1] ? p1[0] : p2[0], // x value of the lowest vertex
                dx: (p2[0] - p1[0]) / (p2[1] - p1[1]) // Reciprocal of the slope of the line segment
            })
        }
    }
    // Sort edge tables
    edgeTable.sort((e1, e2) => {
        // Sort by ymin increment
        if (e1.ymin < e2.ymin) {
            return -1
        }
        if (e1.ymin > e2.ymin) {
            return 1
        }
        // If ymin is the same, press xi to increase
        if (e1.xi < e2.xi) {
            return -1
        }
        if (e1.xi > e2.xi) {
            return 1
        }
        // xi is the same, you can only see ymax
        // ymax is also the same, indicating that the two edges coincide
        if (e1.ymax === e2.ymax) {
            return 0
        }
        // If not, sort by yamx increment
        if (e1.ymax < e2.ymax) {
            return -1
        }
        if (e1.ymax > e2.ymax) {
            return 1
        }
    })
    return edgeTable
}
Next, scan:
scanLines (points) {
    if (points.length < 3) {
        return []
    }
    let lines = []
    // Create sort edge table ET
    let edgeTable = this.createEdgeTable(points)
    // Active edge table AET
    let activeEdgeTable = []
    // Start scanning, starting at the lowest point of the polygon
    let y = edgeTable[0].ymin
    // The end of the loop is that both tables are empty
    while (edgeTable.length > 0 || activeEdgeTable.length > 0) {
        // Add the edge of the current scan line from the ET table to the AET table
        if (edgeTable.length > 0) {
            // Add the edge intersecting the scan line in the current ET table to the AET table
            for (let i = 0; i < edgeTable.length; i++) {
                // If the interval between scanning lines is increased, the line segment with small height difference may be directly skipped by the whole, resulting in dead cycle. This situation needs to be considered
                if (edgeTable[i].ymin <= y && edgeTable[i].ymax >= y || edgeTable[i].ymax < y) {
                    let removed = edgeTable.splice(i, 1)
                    activeEdgeTable.push(...removed)
                    i--
                }
            }
        }
        // Delete y=ymax record from AET table
        activeEdgeTable = activeEdgeTable.filter((item) => {
            return y < item.ymax
        })
        // Sort by xi small to large
        activeEdgeTable.sort((e1, e2) => {
            if (e1.xi < e2.xi) {
                return -1
            } else if (e1.xi > e2.xi) {
                return 1
            } else {
                return 0
            }
        })
        // If there are active edges, the area between them is filled
        if (activeEdgeTable.length > 1) {
            // Take two edges at a time to fill
            for (let i = 0; i + 1 < activeEdgeTable.length; i += 2) {
                lines.push([
                    [Math.round(activeEdgeTable[i].xi), y],
                    [Math.round(activeEdgeTable[i + 1].xi), y]
                ])
            }
        }
        // Update xi of active edge
        activeEdgeTable.forEach((item) => {
            item.xi += item.dx
        })
        // Update scan line y
        y += 1
    }
    return lines
}
The code is actually the translation of the above algorithm process. It is not difficult to understand the algorithm code. Call the method in the polygon method:
// Draw freehand polygons
polygon (points = [], opt = {}) {
    if (points.length < 3) {
        return
    }
    // Plus filling method
    let lines = this.scanLines(points)
    lines.forEach((line) => {
        this.drawDoubleLine(line[0][0], line[0][1], line[1][0], line[1][1], {
            color: opt.fillStyle
        })
    })

    // Stroke
    let len = points.length
    // ...
}
Take a look at the final filling effect:
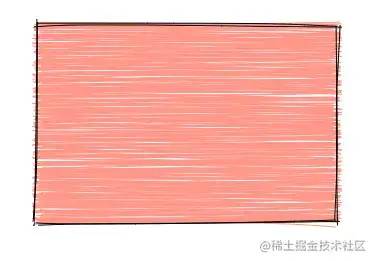
The effect has come out, but it's too dense, because our scanning line adds 1 every time. Let's try adding more:
scanLines (points) {
    // ...

    // Let's add 10 to the scan line at a time
    let gap = 10
    // Update xi of active edge
    activeEdgeTable.forEach((item) => {
        item.xi += item.dx * gap// Why should the reciprocal of the slope be multiplied by 10? You can see the derivation above
    })
    // Update scan line y
    y += gap

    // ...
}
By the way, thicken the width of the line segment. The effect is as follows:

You can also connect the beginning and end of the line segment alternately into a stroke effect:
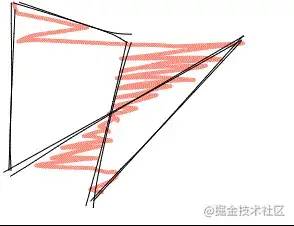
The specific implementation can be seen in the source code. Next, let's look at the last problem, which is to tilt the filling line a little. At present, it is horizontal. If the filling line wants to be tilted, we can first rotate the figure at a certain angle so that the scanned line is still horizontal, and then rotate the figure and the filling line back to get the tilted line.
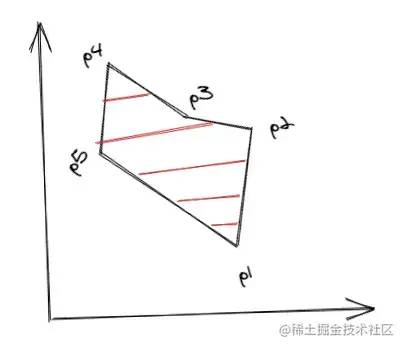
The figure above shows that the graphics are scanned after counterclockwise rotation, and the figure below shows that the graphics and fill lines are rotated back clockwise.
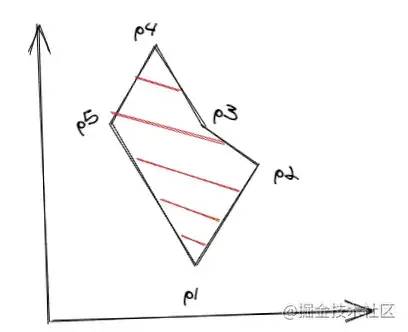
Graph rotation is the rotation of each vertex, so the problem becomes to find the position of a point after rotating the specified angle. Let's deduce it below.
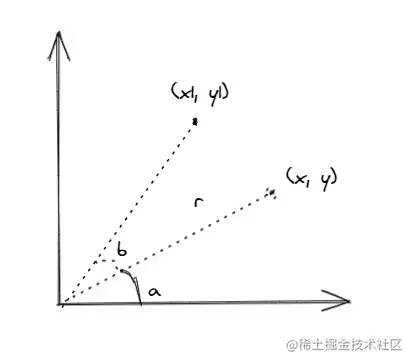
In the above figure, the original angle of point (x,y) is a and the length of line segment is r. calculate the coordinates (x1,y1) after rotation angle b:
x = Math.cos(a) * r// 1
y = Math.sin(a) * r// 2

x1 = Math.cos(a + b) * r
y1 = Math.sin(a + b) * r

// Expand cos(a+b) and sin(a+b)
x1 = (Math.cos(a) * Math.cos(b) - Math.sin(a) * Math.sin(b)) * r// 3
y1 = (Math.sin(a) * Math.cos(b) + Math.cos(a) * Math.sin(b)) * r// 4

// Substitute 1 and 2 into 3 and 4
Math.cos(a) = x / r
Math.sin(a) = y / r
x1 = ((x / r) * Math.cos(b) - (y / r) * Math.sin(b)) * r
y1 = ((y / r) * Math.cos(b) + (x / r) * Math.sin(b)) * r
// About r
x1 = x * Math.cos(b) - y * Math.sin(b)
y1 = y * Math.cos(b) + x * Math.sin(b)
Thus, the function of finding the coordinates of a point after rotating the specified angle can be obtained:
getRotatedPos (x, y, rad) {
    return [
        x: x * Math.cos(rad) - y * Math.sin(rad),
        y: y * Math.cos(rad) + x * Math.sin(rad)
    ]
}
With this function, we can rotate the polygon:
// Draw freehand polygons
polygon (points = [], opt = {}) {
    if (points.length < 3) {
        return
    }
    // Rotate polygon before scanning
    let _points = this.rotatePoints(points, opt.rotate)
    let lines = this.scanLines(_points)
    // After scanning the line segment, we rotate the opposite angle
    lines = this.rotateLines(lines, -opt.rotate)
    lines.forEach((line) => {
        this.drawDoubleLine(line[0][0], line[0][1], line[1][0], line[1][1], {
            color: opt.fillStyle
        })
    })

    // Stroke
    let len = points.length
    // ...
}

// Rotate vertex list
rotatePoints (points, rotate) {
    return points.map((item) => {
        return this.getRotatedPos(item[0], item[1], rotate)
    })
}

// Rotate segment list
rotateLines (lines, rotate) {
    return lines.map((line) => {
        return [
            this.getRotatedPos(line[0][0], line[0][1], rotate),
            this.getRotatedPos(line[1][0], line[1][1], rotate)
        ]
    })
}
The effects are as follows:
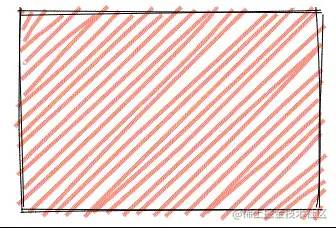
The same is true for circles. After converting to polygons, rotate first, then scan and then rotate back:
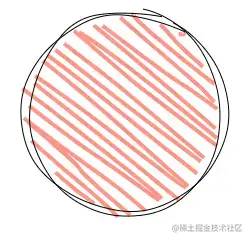
summary
This paper introduces several implementation methods of hand drawing style of simple graphics, which involves simple mathematical knowledge and region filling algorithm. If there is an unreasonable or better implementation method, please discuss it in the message area. The complete example code is: github.com/wanglin2/ha... [5]. Thanks for reading, see you next time ~ reference article:
- https://github.com/rough-stuff/rough
- https://wenku.baidu.com/view/4ee141347c1cfad6195fa7c9.html
- https://blog.csdn.net/orbit/article/details/7368996
- https://blog.csdn.net/wodownload2/article/details/52154207
- https://blog.csdn.net/keneyr/article/details/83747501
- http://www.twinklingstar.cn/2013/325/region-polygon-fill-scan-line/
reference material
[1]
https://roughjs.com/
[2]
http://lxqnsys.com/#/demo/handPaintedStyle
[3]
https://cubic-bezier.com
[4]
https://wenku.baidu.com/view/4ee141347c1cfad6195fa7c9.html
[5]
https://github.com/wanglin2/handPaintedStyle