ID3 decision tree algorithm
background knowledge
ID3 algorithm was first proposed by J. Ross Quinlan at the University of Sydney in 1975. The core of the algorithm is "information entropy". By calculating the information gain of each attribute, ID3 algorithm considers that the attribute with high information gain is a good attribute. Each division selects the attribute with the highest information gain as the division standard, and repeats this process until a decision tree that can perfectly classify training samples is generated.
Decision tree is used to classify data to achieve the purpose of prediction. The decision tree method first forms a decision tree according to the training set data. If the tree can not give correct classification to all objects, select some exceptions to the training set data and repeat the process until a correct decision set is formed. Decision tree represents the tree structure of decision set.
The decision tree consists of decision nodes, branches and leaves. The top node in the decision tree is the root node, and each branch is a new decision node or a leaf of the tree. Each decision node represents a problem or decision, which usually corresponds to the attributes of the object to be classified. Each leaf node represents a possible classification result. In the process of traversing from top to bottom along the decision tree, a test will be encountered at each node. Different test outputs of problems on each node will lead to different branches, and finally reach a leaf node. This process is the process of classification using the decision tree and using several variables to judge the category.
data description
The sample data used has certain requirements. ID3 is:
- Description - attributes - attributes with the same value must describe each example and have a fixed number of values.
- Predefined class instance properties must have been defined, that is, they are not learning ID3.
- Discrete classes - classes must be sharp and sharp. The decomposition of continuous classes into fuzzy categories (e.g. metals are "hard, difficult, flexible, gentle and soft") is unreliable.
- Enough examples - because inductive generalizations are used (i.e. undetectable), enough test cases must be selected to distinguish effective patterns and eliminate the influence of special coincidence factors.
ID3 determines which attributes are the best. A statistical feature, called information gain, uses entropy to get a given attribute to measure the training examples. The information with the highest information gain (information is the most beneficial classification) is selected. In order to clarify the gain, we first borrow a definition from information theory, called entropy. Each attribute has an entropy.
summary
ID3 decision tree is a very important structure used to deal with classification problems. It looks like a nested N-level IF... ELSE structure, but its judgment standard is no longer a relational expression, but the information gain of the corresponding module. It selects a branch from the root node through the size of the information gain, just like entering the statement of an IF structure, through the attribute value Different values enter the statement of the new IF structure until it reaches the leaf node and finds the "classification" label to which it belongs.
Its flowchart is a multi fork tree that cannot guarantee balance. Each parent node is a judgment module. Through judgment, the current vector will enter one of its child nodes. This child node is the judgment module or termination module (leaf node). If and only if this vector reaches the leaf node, it will find its "classification" label.
ID3 decision tree can form a permanent "tree" through a fixed training set. This course tree can be saved and applied to different test sets. The only requirement is that the test set and training set need to be structurally equivalent. This training process is the process of creating rules according to the training set, which is also the process of machine learning.
realization
data conversion
Watermelon dataset.txt:
Turquoise curling, turbid sound, clear depression, hard and smooth
Dark curled, dull, clear, sunken, hard and slippery
Black curl, turbid sound, clear depression, hard and smooth
Turquoise curled, dull, clear, sunken, hard and smooth
Light white curled, turbid sound, clear depression, hard and smooth
Turquoise slightly curled, turbid, clear, slightly concave, soft and sticky
Dark, slightly curled, turbid, noisy, slightly pasted, slightly concave, soft and sticky
Dark, slightly curled, turbid, clear, slightly concave, hard and smooth
Dark, slightly curled, dull, slightly pasted, slightly concave, hard and smooth
Green, hard, crisp, clear, flat, soft and sticky
Light white hard crisp fuzzy flat hard smooth no
Light white curled turbid sound fuzzy flat soft sticky no
Turquoise slightly curled, turbid, noisy, slightly pasted, concave, hard and slippery or not
Light white, slightly curled, dull, slightly pasted, sunken, hard and slippery or not
Dark, slightly curled, turbid, clear, slightly concave, soft and sticky
Light white curled turbid sound fuzzy flat hard smooth no
Green curled up, dull, slightly pasted, slightly concave, hard and slippery
To convert a txt document to csv: txt to csv
Import package
import numpy as np
import pandas as pd
import sklearn.tree as st
import math
import matplotlib
import os
import matplotlib.pyplot as plt
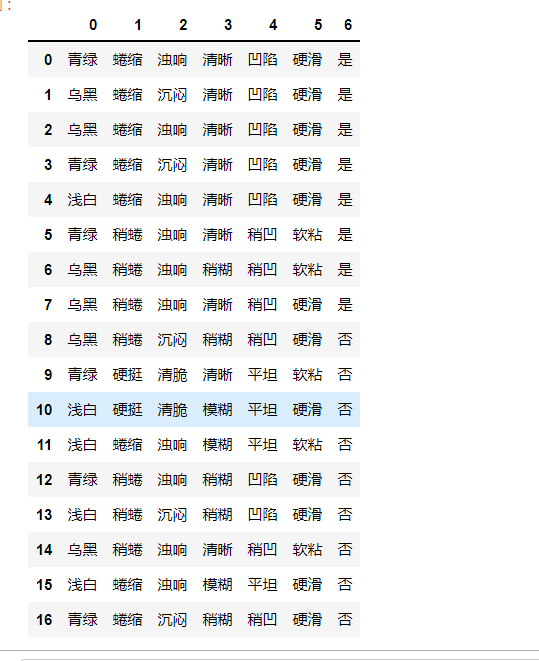
data = pd.read_csv('F:/Watermelon dataset.csv',header=None)
data
entropy
def calcEntropy(dataSet):
    mD = len(dataSet)
    dataLabelList = [x[-1] for x in dataSet]
    dataLabelSet = set(dataLabelList)
    ent = 0
    for label in dataLabelSet:
        mDv = dataLabelList.count(label)
        prop = float(mDv) / mD
        ent = ent - prop * np.math.log(prop, 2)

    return ent
Split dataset
# Index - the index of the feature to split
# Feature - the feature to split
# Return value - a set in which the feature of the index in the dataSet is feature and the index column is removed
def splitDataSet(dataSet, index, feature):
    splitedDataSet = []
    mD = len(dataSet)
    for data in dataSet:
        if(data[index] == feature):
            sliceTmp = data[:index]
            sliceTmp.extend(data[index + 1:])
            splitedDataSet.append(sliceTmp)
    return splitedDataSet
Select the optimal feature
# Return value - the subscript of the best feature
def chooseBestFeature(dataSet):
    entD = calcEntropy(dataSet)
    mD = len(dataSet)
    featureNumber = len(dataSet[0]) - 1
    maxGain = -100
    maxIndex = -1
    for i in range(featureNumber):
        entDCopy = entD
        featureI = [x[i] for x in dataSet]
        featureSet = set(featureI)
        for feature in featureSet:
            splitedDataSet = splitDataSet(dataSet, i, feature)  # Split dataset
            mDv = len(splitedDataSet)
            entDCopy = entDCopy - float(mDv) / mD * calcEntropy(splitedDataSet)
        if(maxIndex == -1):
            maxGain = entDCopy
            maxIndex = i
        elif(maxGain < entDCopy):
            maxGain = entDCopy
            maxIndex = i

    return maxIndex
Find most as labels
# Return value - label
def mainLabel(labelList):
    labelRec = labelList[0]
    maxLabelCount = -1
    labelSet = set(labelList)
    for label in labelSet:
        if(labelList.count(label) > maxLabelCount):
            maxLabelCount = labelList.count(label)
            labelRec = label
    return labelRec
Spanning tree
def createFullDecisionTree(dataSet, featureNames, featureNamesSet, labelListParent):
    labelList = [x[-1] for x in dataSet]
    if(len(dataSet) == 0):
        return mainLabel(labelListParent)
    elif(len(dataSet[0]) == 1): #There are no separable properties
        return mainLabel(labelList)  #Select the most label as the label of the dataset
    elif(labelList.count(labelList[0]) == len(labelList)): # All belong to the same Label
        return labelList[0]

    bestFeatureIndex = chooseBestFeature(dataSet)
    bestFeatureName = featureNames.pop(bestFeatureIndex)
    myTree = {bestFeatureName: {}}
    featureList = featureNamesSet.pop(bestFeatureIndex)
    featureSet = set(featureList)
    for feature in featureSet:
        featureNamesNext = featureNames[:]
        featureNamesSetNext = featureNamesSet[:][:]
        splitedDataSet = splitDataSet(dataSet, bestFeatureIndex, feature)
        myTree[bestFeatureName][feature] = createFullDecisionTree(splitedDataSet, featureNamesNext, featureNamesSetNext, labelList)
    return myTree
initialization
# Return value
# dataSet dataset
# featureNames label
# featureNamesSet column label
def readWatermelonDataSet():
    dataSet = data.values.tolist()
    featureNames =['color and lustre', 'Root', 'Knock', 'texture', 'Umbilicus', 'Tactile sensation']
    #Get featureNamesSet
    featureNamesSet = []
    for i in range(len(dataSet[0]) - 1):
        col = [x[i] for x in dataSet]
        colSet = set(col)
        featureNamesSet.append(list(colSet))

    return dataSet, featureNames, featureNamesSet
Drawing
# Can display Chinese
matplotlib.rcParams['font.sans-serif'] = ['SimHei']
matplotlib.rcParams['font.serif'] = ['SimHei']

# Bifurcation node, that is, decision node
decisionNode = dict(boxstyle="sawtooth", fc="0.8")

# Leaf node
leafNode = dict(boxstyle="round4", fc="0.8")

# Arrow style
arrow_args = dict(arrowstyle="<-")


def plotNode(nodeTxt, centerPt, parentPt, nodeType):
    """
    Draw a node
    :param nodeTxt: Text information describing the node
    :param centerPt: Coordinates of text
    :param parentPt: The coordinates of the point, which also refers to the coordinates of the parent node
    :param nodeType: Node type,It is divided into leaf node and decision node
    :return:
    """
    createPlot.ax1.annotate(nodeTxt, xy=parentPt, xycoords='axes fraction',
                            xytext=centerPt, textcoords='axes fraction',
                            va="center", ha="center", bbox=nodeType, arrowprops=arrow_args)


def getNumLeafs(myTree):
    """
    Gets the number of leaf nodes
    :param myTree:
    :return:
    """
    # Count the total number of leaf nodes
    numLeafs = 0

    # Get the current first key, that is, the root node
    firstStr = list(myTree.keys())[0]

    # Get the content corresponding to the first key
    secondDict = myTree[firstStr]

    # Recursively traversing leaf nodes
    for key in secondDict.keys():
        # If the key corresponds to a dictionary, it is called recursively
        if type(secondDict[key]).__name__ == 'dict':
            numLeafs += getNumLeafs(secondDict[key])
        # If not, it means that it is a leaf node at this time
        else:
            numLeafs += 1
    return numLeafs


def getTreeDepth(myTree):
    """
    Number of depth layers obtained
    :param myTree:
    :return:
    """
    # Used to save the maximum number of layers
    maxDepth = 0

    # Get root node
    firstStr = list(myTree.keys())[0]

    # Get the content corresponding to the key
    secondDic = myTree[firstStr]

    # Traverse all child nodes
    for key in secondDic.keys():
        # If the node is a dictionary, it is called recursively
        if type(secondDic[key]).__name__ == 'dict':
            # Depth of child node plus 1
            thisDepth = 1 + getTreeDepth(secondDic[key])

        # This indicates that this is a leaf node
        else:
            thisDepth = 1

        # Replace maximum layers
        if thisDepth > maxDepth:
            maxDepth = thisDepth

    return maxDepth


def plotMidText(cntrPt, parentPt, txtString):
    """
    Calculate the middle position between the parent node and the child node, and fill in the information
    :param cntrPt: Child node coordinates
    :param parentPt: Parent node coordinates
    :param txtString: Filled text information
    :return:
    """
    # Calculate the middle position of the x-axis
    xMid = (parentPt[0]-cntrPt[0])/2.0 + cntrPt[0]
    # Calculate the middle position of the y-axis
    yMid = (parentPt[1]-cntrPt[1])/2.0 + cntrPt[1]
    # Draw
    createPlot.ax1.text(xMid, yMid, txtString)


def plotTree(myTree, parentPt, nodeTxt):
    """
    Draw all nodes of the tree and draw recursively
    :param myTree: tree
    :param parentPt: Coordinates of the parent node
    :param nodeTxt: Text information of the node
    :return:
    """
    # Calculate the number of leaf nodes
    numLeafs = getNumLeafs(myTree=myTree)

    # Calculate the depth of the tree
    depth = getTreeDepth(myTree=myTree)

    # Get the information content of the root node
    firstStr = list(myTree.keys())[0]

    # Calculate the middle coordinates of the current root node in all child nodes, that is, the offset of the current X-axis plus the calculated center position of the root node as the x-axis (for example, the first time: the initial x-offset is: - 1/2W, the calculated center position of the root node is: (1+W)/2W, add to get: 1 / 2), and the current Y-axis offset is the y-axis
    cntrPt = (plotTree.xOff + (1.0 + float(numLeafs))/2.0/plotTree.totalW, plotTree.yOff)

    # Draw the connection between the node and the parent node
    plotMidText(cntrPt, parentPt, nodeTxt)

    # Draw the node
    plotNode(firstStr, cntrPt, parentPt, decisionNode)

    # Get the subtree corresponding to the current root node
    secondDict = myTree[firstStr]

    # Calculate the new y-axis offset and move down 1/D, that is, the drawing y-axis of the next layer
    plotTree.yOff = plotTree.yOff - 1.0/plotTree.totalD

    # Loop through all key s
    for key in secondDict.keys():
        # If the current key is a dictionary and there are subtrees, it will be traversed recursively
        if isinstance(secondDict[key], dict):
            plotTree(secondDict[key], cntrPt, str(key))
        else:
            # Calculate the new X-axis offset, that is, the x-axis coordinate drawn by the next leaf moves 1/W to the right
            plotTree.xOff = plotTree.xOff + 1.0/plotTree.totalW
            # Open the annotation to observe the coordinate changes of leaf nodes
            # print((plotTree.xOff, plotTree.yOff), secondDict[key])
            # Draw leaf node
            plotNode(secondDict[key], (plotTree.xOff, plotTree.yOff), cntrPt, leafNode)
            # Draw the content of the middle line between the leaf node and the parent node
            plotMidText((plotTree.xOff, plotTree.yOff), cntrPt, str(key))

    # Before returning to recursion, you need to increase the offset of the y-axis and move it up by 1/D, that is, return to draw the y-axis of the previous layer
    plotTree.yOff = plotTree.yOff + 1.0/plotTree.totalD


def createPlot(inTree):
    """
    Decision tree to be drawn
    :param inTree: Decision tree dictionary
    :return:
    """
    # Create an image
    fig = plt.figure(1, facecolor='white')
    fig.clf()
    axprops = dict(xticks=[], yticks=[])
    createPlot.ax1 = plt.subplot(111, frameon=False, **axprops)
    # Calculate the total width of the decision tree
    plotTree.totalW = float(getNumLeafs(inTree))
    # Calculate the total depth of the decision tree
    plotTree.totalD = float(getTreeDepth(inTree))
    # The initial x-axis offset, that is - 1/2W, moves 1/W to the right each time, that is, the x coordinates drawn by the first leaf node are: 1/2W, the second: 3/2W, the third: 5/2W, and the last: (W-1)/2W
    plotTree.xOff = -0.5/plotTree.totalW
    # The initial y-axis offset, moving down or up 1/D each time
    plotTree.yOff = 1.0
    # Call the function to draw the node image
    plotTree(inTree, (0.5, 1.0), '')
    # draw
    plt.show()
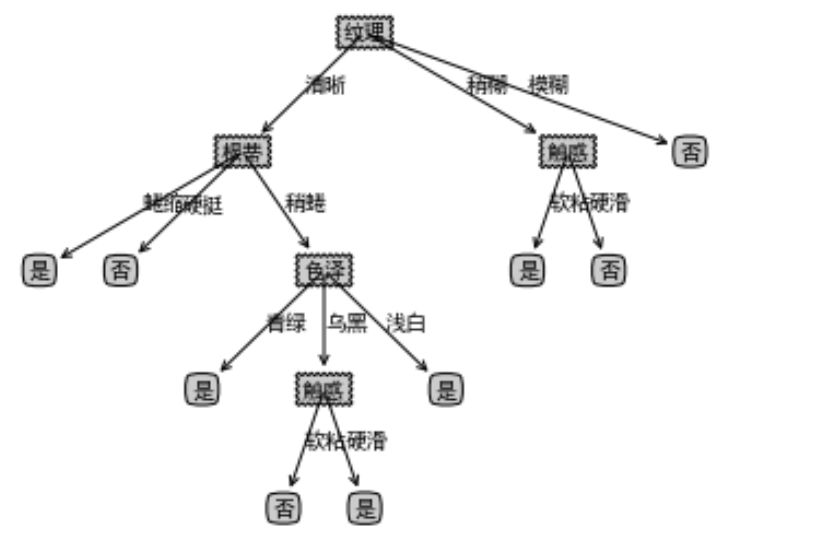
result
dataSet, featureNames, featureNamesSet=readWatermelonDataSet()
testTree= createFullDecisionTree(dataSet, featureNames, featureNamesSet,featureNames)
createPlot(testTree)