- w/uptime View System Load
- Cat/proc/cpuinfo View cpu Number
- Vmstat monitoring system status, usage vmstat 1, key columns: r, b, swpd, si, so, bi, bo, us, wa
- top Views Process Usage Resources
- Top-c displays detailed process information
- Top-bn1 static display of all processes
- q exits, number 1 shows all core cpu s, capital M sorted by memory usage
- The capital letter P is sorted by cpu usage
Viewing System Load Using w Command
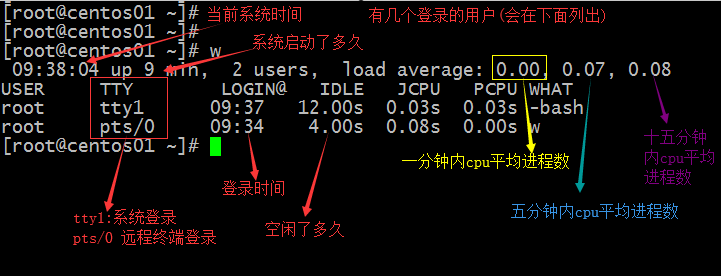
Among them, the load mainly depends on the average number of cpu processes in a minute. If the cpu does not exceed the number of cpu cores, the cpu will be healthy, exceeding the higher load.
[root@centos01 ~]# cat /proc/cpuinfo
processor       : 0  # Total cpu Number: 0 + 1
vendor_id       : GenuineIntel
cpu family      : 6
...

[root@centos01 ~]# uptime  # Similar to w, no user list is displayed
 10:19:04 up 50 min,  2 users,  load average: 0.00, 0.01, 0.05
Monitoring system status with vmstat
procs displays information about the process.
r(run): Represents the number of processes running or waiting for cpu time slices.
b(block): Represents the number of processes waiting for resources, which refer to I/O, memory, etc.
Memory displays information about memory.
swpd: Represents the amount of memory switched to the swap partition in KB.
Free: Represents the current amount of free memory in KB.
buff: Represents the size of the buffer (to be written to disk) in KB.
Cache: Represents the size of the cache (read from disk) in KB.
swap displays the memory conversion.
si: Represents the amount of data written to memory by the swap partition in KB.
so: Represents the amount of data written to the swap partition by memory in KB.
io displays the status of disk usage.
bi: Represents the amount of data read from a block device (read disk), in KB.
bo: Represents the amount of data written from a block device (write disk), in KB.
system shows the number of interruptions occurring during the acquisition interval.
In: Represents the number of terminals per second observed in a given interval of time.
cs: Represents the number of context switches per second.
The CPU displays the status of CPU usage.
us: Displays the percentage of CPU time spent under the user.
sy: Displays the percentage of time the system spends on the CPU.
id: Represents the percentage of time the CPU is idle.
wa: Represents the percentage of CPU time spent waiting for I/O.
st: Represents the percentage of stolen CPU s (generally 0, no attention).
[root@centos01 ~]# vmstat
procs -----------memory---------- ---swap-- -----io---- -system-- ------cpu-----
 r  b   swpd   free   buff  cache   si   so    bi    bo   in   cs us sy id wa st
 2  0      0 771828    692  82664    0    0    29     2   28   40  0  1 99  0  0
[root@centos01 ~]# vmstat 1  # Print current system information every 1 second, ctrl+c exits
procs -----------memory---------- ---swap-- -----io---- -system-- ------cpu-----
 r  b   swpd   free   buff  cache   si   so    bi    bo   in   cs us sy id wa st
 2  0      0 771796    692  82696    0    0    29     2   27   40  0  1 99  0  0
 0  0      0 771772    692  82696    0    0     0     0   18   21  0  0 100  0  0
 0  0      0 771772    692  82696    0    0     0     0   18   13  0  0 100  0  0
 0  0      0 771772    692  82696    0    0     0     0   16   15  0  0 100  0  0
 0  0      0 771772    692  82696    0    0     0     0   17   12  0  1 99  0  0
 0  0      0 771772    692  82696    0    0     0     0   19   17  0  0 100  0  0
 0  0      0 771772    692  82696    0    0     0     0   23   14  0  1 99  0  0
 0  0      0 771772    692  82696    0    0     0     0   16   15  0  0 100  0  0
 0  0      0 771772    692  82696    0    0     0     0   16   12  0  0 100  0  0
 0  0      0 771772    692  82696    0    0     0     0   18   18  0  1 99  0  0
 0  0      0 771772    692  82696    0    0     0     0   17   13  0  0 100  0  0
 0  0      0 771772    692  82696    0    0     0     0   12   10  0  0 100  0  0
 0  0      0 771772    692  82696    0    0     0     0   18   17  0  0 100  0  0
 0  0      0 771772    692  82696    0    0     0     8   17   19  0  0 100  0  0
 0  0      0 771772    692  82696    0    0     0     0   18   17  0  0 100  0  0
^C
[root@centos01 ~]# vmstat 1 5 # Print the current system information every 1 second and quit five times
procs -----------memory---------- ---swap-- -----io---- -system-- ------cpu-----
 r  b   swpd   free   buff  cache   si   so    bi    bo   in   cs us sy id wa st
 2  0      0 771796    692  82696    0    0    28     2   27   39  0  1 99  0  0
 0  0      0 771772    692  82696    0    0     0     0   28   36  0  1 99  0  0
 0  0      0 771772    692  82696    0    0     0     0   13   12  0  0 100  0  0
 0  0      0 771772    692  82696    0    0     0     0   23   19  0  0 100  0  0
 0  0      0 771772    692  82696    0    0     0     0   14   12  0  0 100  0  0
Display system resources occupied by processes with top command
[root@centos01 ~]# top # Refresh data every 3 seconds
top - 10:58:26 up  1:30,  2 users,  load average: 0.00, 0.01, 0.05
Tasks: 208 total,   2 running, 206 sleeping,   0 stopped,   0 zombie
%Cpu(s):  0.0 us,  0.3 sy,  0.0 ni, 99.3 id,  0.0 wa,  0.0 hi,  0.3 si,  0.0 st
KiB Mem:   1010860 total,   240064 used,   770796 free,      692 buffers
KiB Swap:  4194300 total,        0 used,  4194300 free.    82968 cached Mem

  PID USER      PR  NI    VIRT    RES    SHR S %CPU %MEM     TIME+ COMMAND
    1 root      20   0   49972   6420   3736 S  0.0  0.6   0:02.18 systemd
    2 root      20   0       0      0      0 S  0.0  0.0   0:00.01 kthreadd
    3 root      20   0       0      0      0 S  0.0  0.0   0:00.05 ksoftirqd/0
    5 root       0 -20       0      0      0 S  0.0  0.0   0:00.00 kworker/0:0H
    6 root      20   0       0      0      0 S  0.0  0.0   0:00.42 kworker/u128:0
    7 root      rt   0       0      0      0 S  0.0  0.0   0:00.00 migration/0

[root@centos01 ~]# top -bn1 | head -n 15  # Top-bn1 Statically Prints All Processes
top - 11:11:49 up  1:43,  2 users,  load average: 0.00, 0.01, 0.05
Tasks: 209 total,   3 running, 206 sleeping,   0 stopped,   0 zombie
%Cpu(s):  0.1 us,  0.3 sy,  0.0 ni, 99.4 id,  0.2 wa,  0.0 hi,  0.1 si,  0.0 st
KiB Mem:   1010860 total,   240056 used,   770804 free,      692 buffers
KiB Swap:  4194300 total,        0 used,  4194300 free.    83020 cached Mem

  PID USER      PR  NI    VIRT    RES    SHR S %CPU %MEM     TIME+ COMMAND
    1 root      20   0   49972   6420   3736 S  0.0  0.6   0:02.22 systemd
    2 root      20   0       0      0      0 S  0.0  0.0   0:00.01 kthreadd
    3 root      20   0       0      0      0 S  0.0  0.0   0:00.05 ksoftirqd/0
    5 root       0 -20       0      0      0 S  0.0  0.0   0:00.00 kworker/0:0H
    6 root      20   0       0      0      0 S  0.0  0.0   0:00.48 kworker/u128:0
    7 root      rt   0       0      0      0 S  0.0  0.0   0:00.00 migration/0
    8 root      20   0       0      0      0 S  0.0  0.0   0:00.00 rcu_bh
    9 root      20   0       0      0      0 S  0.0  0.0   0:00.00 rcuob/0
Monitoring system status using sar command
- Sar-n DEV network card traffic
- Sar-q system load
- SAR-b Disk Read-Write
- Sar-f/var/log/sa/saxx historical file
- Install Yum install-y sysstat
[root@centos01 ~]# sar # Just installed, no historical data file yet
Cannot open /var/log/sa/sa24: No such file or directory
[root@centos01 ~]# date
Wed Oct 24 11:18:14 CST 2018
[root@centos01 ~]# sar -n DEV 1 5  # Over hundreds of thousands of rxpck/s may be problematic
Linux 3.10.0-123.el7.x86_64 (centos01)  10/24/2018      _x86_64_        (1 CPU)

11:18:25 AM     IFACE   rxpck/s   txpck/s    rxkB/s    txkB/s   rxcmp/s   txcmp/s  rxmcst/s
11:18:26 AM eno16777736      1.00      1.00      0.06      0.18      0.00      0.00      0.00
11:18:26 AM        lo      0.00      0.00      0.00      0.00      0.00      0.00      0.00

11:18:26 AM     IFACE   rxpck/s   txpck/s    rxkB/s    txkB/s   rxcmp/s   txcmp/s  rxmcst/s
11:18:27 AM eno16777736      1.00      1.00      0.06      0.38      0.00      0.00      0.00
11:18:27 AM        lo      0.00      0.00      0.00      0.00      0.00      0.00      0.00

11:18:27 AM     IFACE   rxpck/s   txpck/s    rxkB/s    txkB/s   rxcmp/s   txcmp/s  rxmcst/s
11:18:28 AM eno16777736      1.00      1.00      0.06      0.38      0.00      0.00      0.00
11:18:28 AM        lo      0.00      0.00      0.00      0.00      0.00      0.00      0.00

11:18:28 AM     IFACE   rxpck/s   txpck/s    rxkB/s    txkB/s   rxcmp/s   txcmp/s  rxmcst/s
11:18:29 AM eno16777736      1.01      1.01      0.06      0.38      0.00      0.00      0.00
11:18:29 AM        lo      0.00      0.00      0.00      0.00      0.00      0.00      0.00

11:18:29 AM     IFACE   rxpck/s   txpck/s    rxkB/s    txkB/s   rxcmp/s   txcmp/s  rxmcst/s
11:18:30 AM eno16777736      1.00      1.00      0.06      0.38      0.00      0.00      0.00
11:18:30 AM        lo      0.00      0.00      0.00      0.00      0.00      0.00      0.00

Average:        IFACE   rxpck/s   txpck/s    rxkB/s    txkB/s   rxcmp/s   txcmp/s  rxmcst/s
Average:    eno16777736      1.00      1.00      0.06      0.34      0.00      0.00      0.00
Average:           lo      0.00      0.00      0.00      0.00      0.00      0.00      0.00
[root@centos01 ~]# ls /var/log/sa/
sa24
[root@centos01 ~]# sar
Linux 3.10.0-123.el7.x86_64 (centos01)  10/24/2018      _x86_64_        (1 CPU)
[root@centos01 ~]#
[root@centos01 ~]# sar -n DEV -f /var/log/sa/sa24
Linux 3.10.0-123.el7.x86_64 (centos01)  10/24/2018      _x86_64_        (1 CPU)
[root@centos01 ~]# sar -q 1 3
Linux 3.10.0-123.el7.x86_64 (centos01)  10/24/2018      _x86_64_        (1 CPU)

11:26:41 AM   runq-sz  plist-sz   ldavg-1   ldavg-5  ldavg-15   blocked
11:26:42 AM         1       225      0.00      0.04      0.07         0
11:26:43 AM         1       225      0.00      0.04      0.07         0
11:26:44 AM         1       225      0.00      0.04      0.07         0
Average:            1       225      0.00      0.04      0.07         0
[root@centos01 ~]# sar -b
Linux 3.10.0-123.el7.x86_64 (centos01)  10/24/2018      _x86_64_        (1 CPU)
[root@centos01 ~]# sar -b 1 5
Linux 3.10.0-123.el7.x86_64 (centos01)  10/24/2018      _x86_64_        (1 CPU)

11:27:43 AM       tps      rtps      wtps   bread/s   bwrtn/s
11:27:44 AM      0.00      0.00      0.00      0.00      0.00
11:27:45 AM      0.00      0.00      0.00      0.00      0.00
11:27:46 AM      2.00      0.00      2.00      0.00      3.00
11:27:47 AM      0.00      0.00      0.00      0.00      0.00
11:27:48 AM      0.00      0.00      0.00      0.00      0.00
Average:         0.40      0.00      0.40      0.00      0.60
Using nload to view network card traffic
- Install Yum install-y nload
[root@centos01 ~]# nload

Device eno16777736 [192.168.77.134] (1/2):
================================================================
Incoming:


                                            Curr: 944.00 Bit/s
                                            Avg: 1.09 kBit/s
                                            Min: 944.00 Bit/s
                                            Max: 2.99 kBit/s
                                            Ttl: 11.57 MByte
Outgoing:


                                            Curr: 7.73 kBit/s
                                            Avg: 7.73 kBit/s
                                            Min: 4.13 kBit/s
                                            Max: 8.99 kBit/s
                                            Ttl: 451.85 kByte