In jQuery, implement a line chart, and [front end statistics chart] echarts implement a single line chart
https://www.jianshu.com/p/0354a4f8c563.
Now to achieve this, Vue + eckarts implements a line chart and opens the previous mint project:
1: install echarts in the project
cnpm install echarts --s

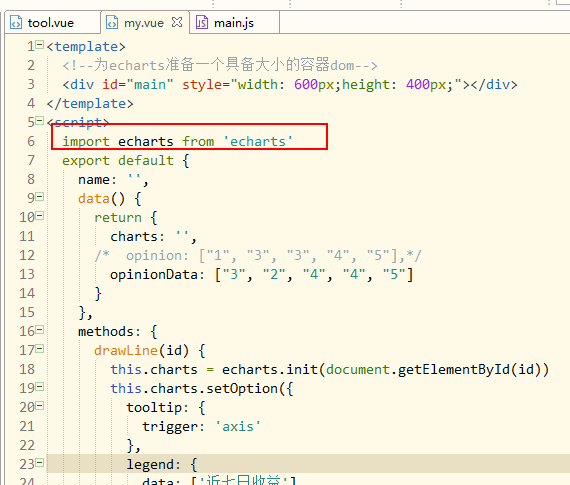
2: introduce where charts are needed
import echarts from 'echarts'

3: open my.vue
Continue to write the code as follows:
<template>
	<!--by echarts Prepare a container of size dom-->
	<div id="main" style="width: 600px;height: 400px;"></div>
</template>
<script>
	import echarts from 'echarts'
	export default {
		name: '',
		data() {
			return {
				charts: '',
			/*	opinion: ["1", "3", "3", "4", "5"],*/
				opinionData: ["3", "2", "4", "4", "5"]
			}
		},
		methods: {
			drawLine(id) {
				this.charts = echarts.init(document.getElementById(id))
				this.charts.setOption({
					tooltip: {
						trigger: 'axis'
					},
					legend: {
						data: ['Income in the past seven days']
					},
					grid: {
						left: '3%',
						right: '4%',
						bottom: '3%',
						containLabel: true
					},

					toolbox: {
						feature: {
							saveAsImage: {}
						}
					},
					xAxis: {
						type: 'category',
						boundaryGap: false,
					data: ["1","2","3","4","5"]

					},
					yAxis: {
						type: 'value'
					},

					series: [{
						name: 'Income in the past seven days',
						type: 'line',
						stack: 'total',
						data: this.opinionData
					}]
				})
			}
		},
		//call
		mounted() {
			this.$nextTick(function() {
				this.drawLine('main')
			})
		}
	}
</script>
<style scoped>
	* {
		margin: 0;
		padding: 0;
		list-style: none;
	}
</style>
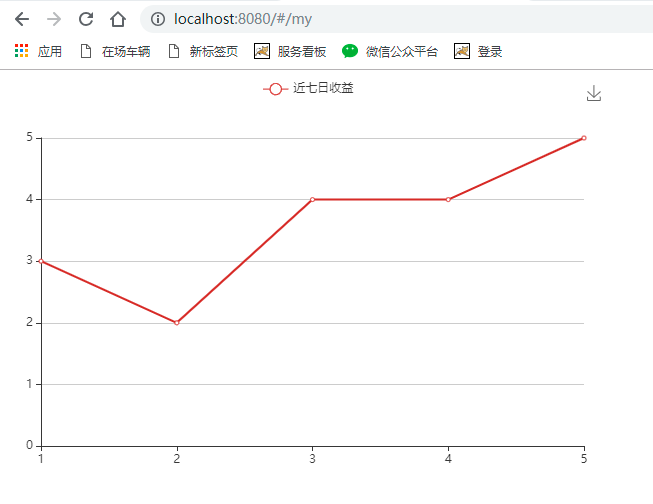
At this time, you can see that the loaded line chart can be improved later.
Original author: qiche girl technology blog: https://www.jianshu.com/u/05f416aefbe1
Post-90s front-end sister, love programming, love operation, literature and code fly together, charm and wisdom coexist.
Pay attention to the public address of "programming micro magazine", reply to "receive resources" in WeChat backstage, get IT resource 300G dry goods.
