At present, Tencent's Real time tracking of epidemic situation The web page can see the real-time data of new coronavirus, and the visual display is also very clear. But every time you open it, you can only see the data of that day, so you want to save the data of every day. After being saved, pyechart also made a map of the epidemic situation. Record the key points for reference.
Using Chrome browser, open Real time tracking of epidemic situation On the web page, click F12, open Developer Tools, click page refresh again, and the Script to track the data is as follows:
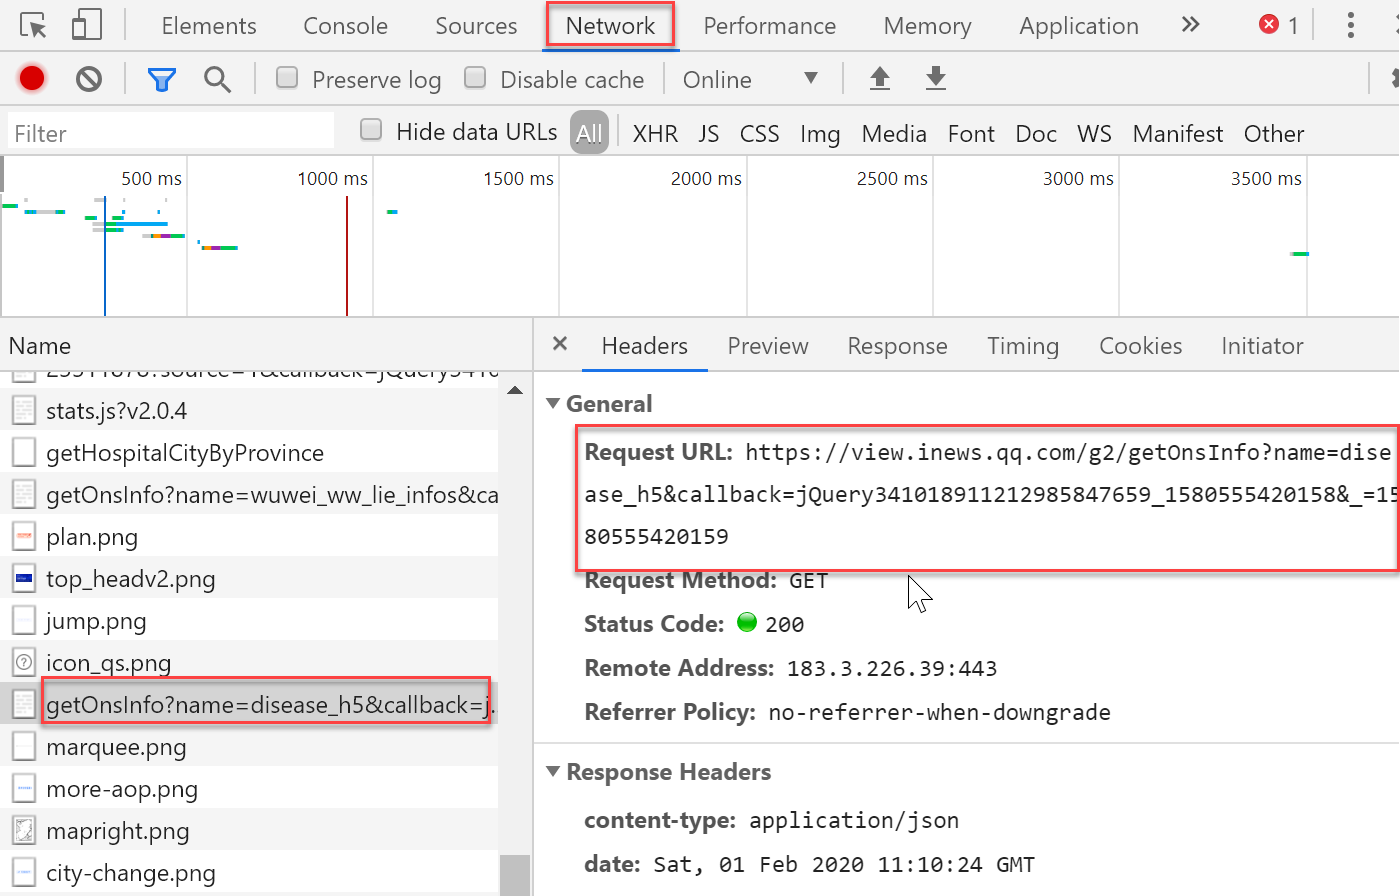
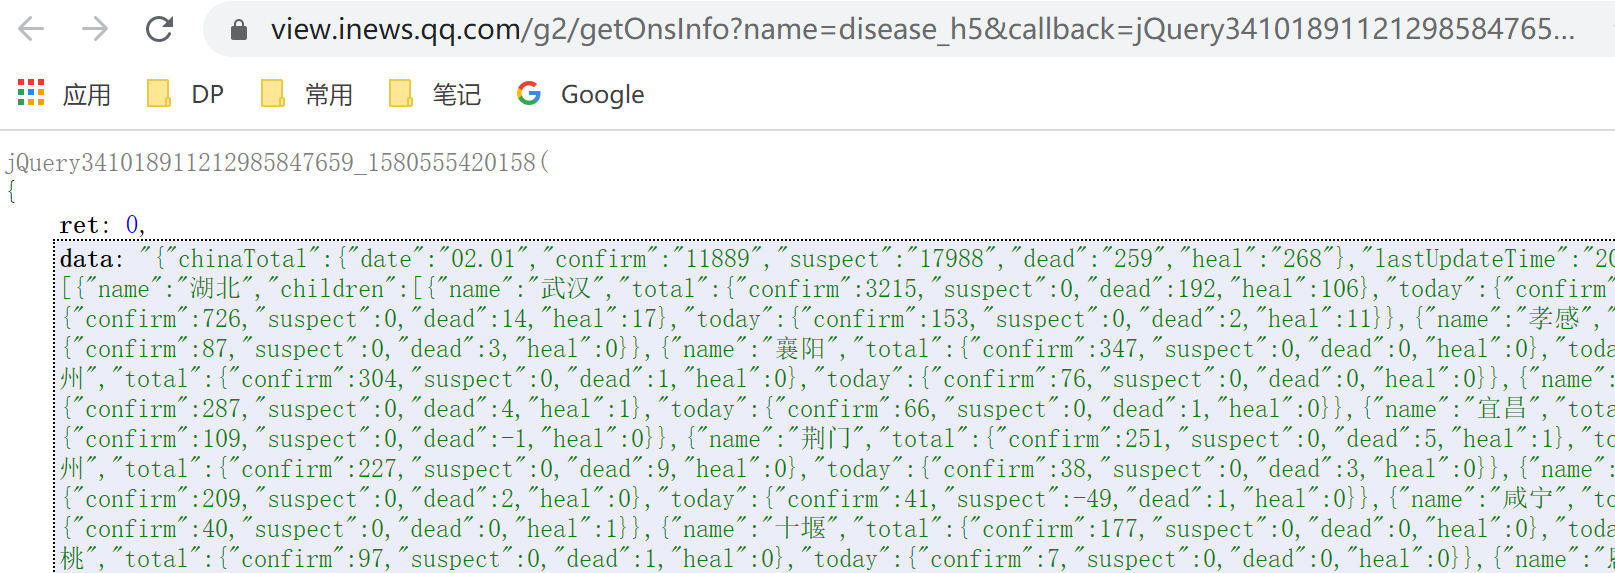
Response returns data in application / JSON format. Double click getonsinfo * * on the left, and chrome will open a new page to display the latest condition data:
In the call parameter:
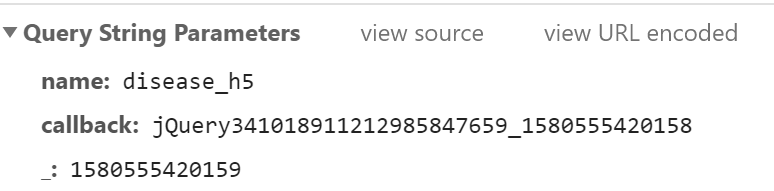
The callback parameter should be a time stamp based on the millisecond level. Remove this callback parameter to get the latest infection data.
For the returned json data, we can save it as a json file and analyze the data structure. The process of analysis will not be expanded here.
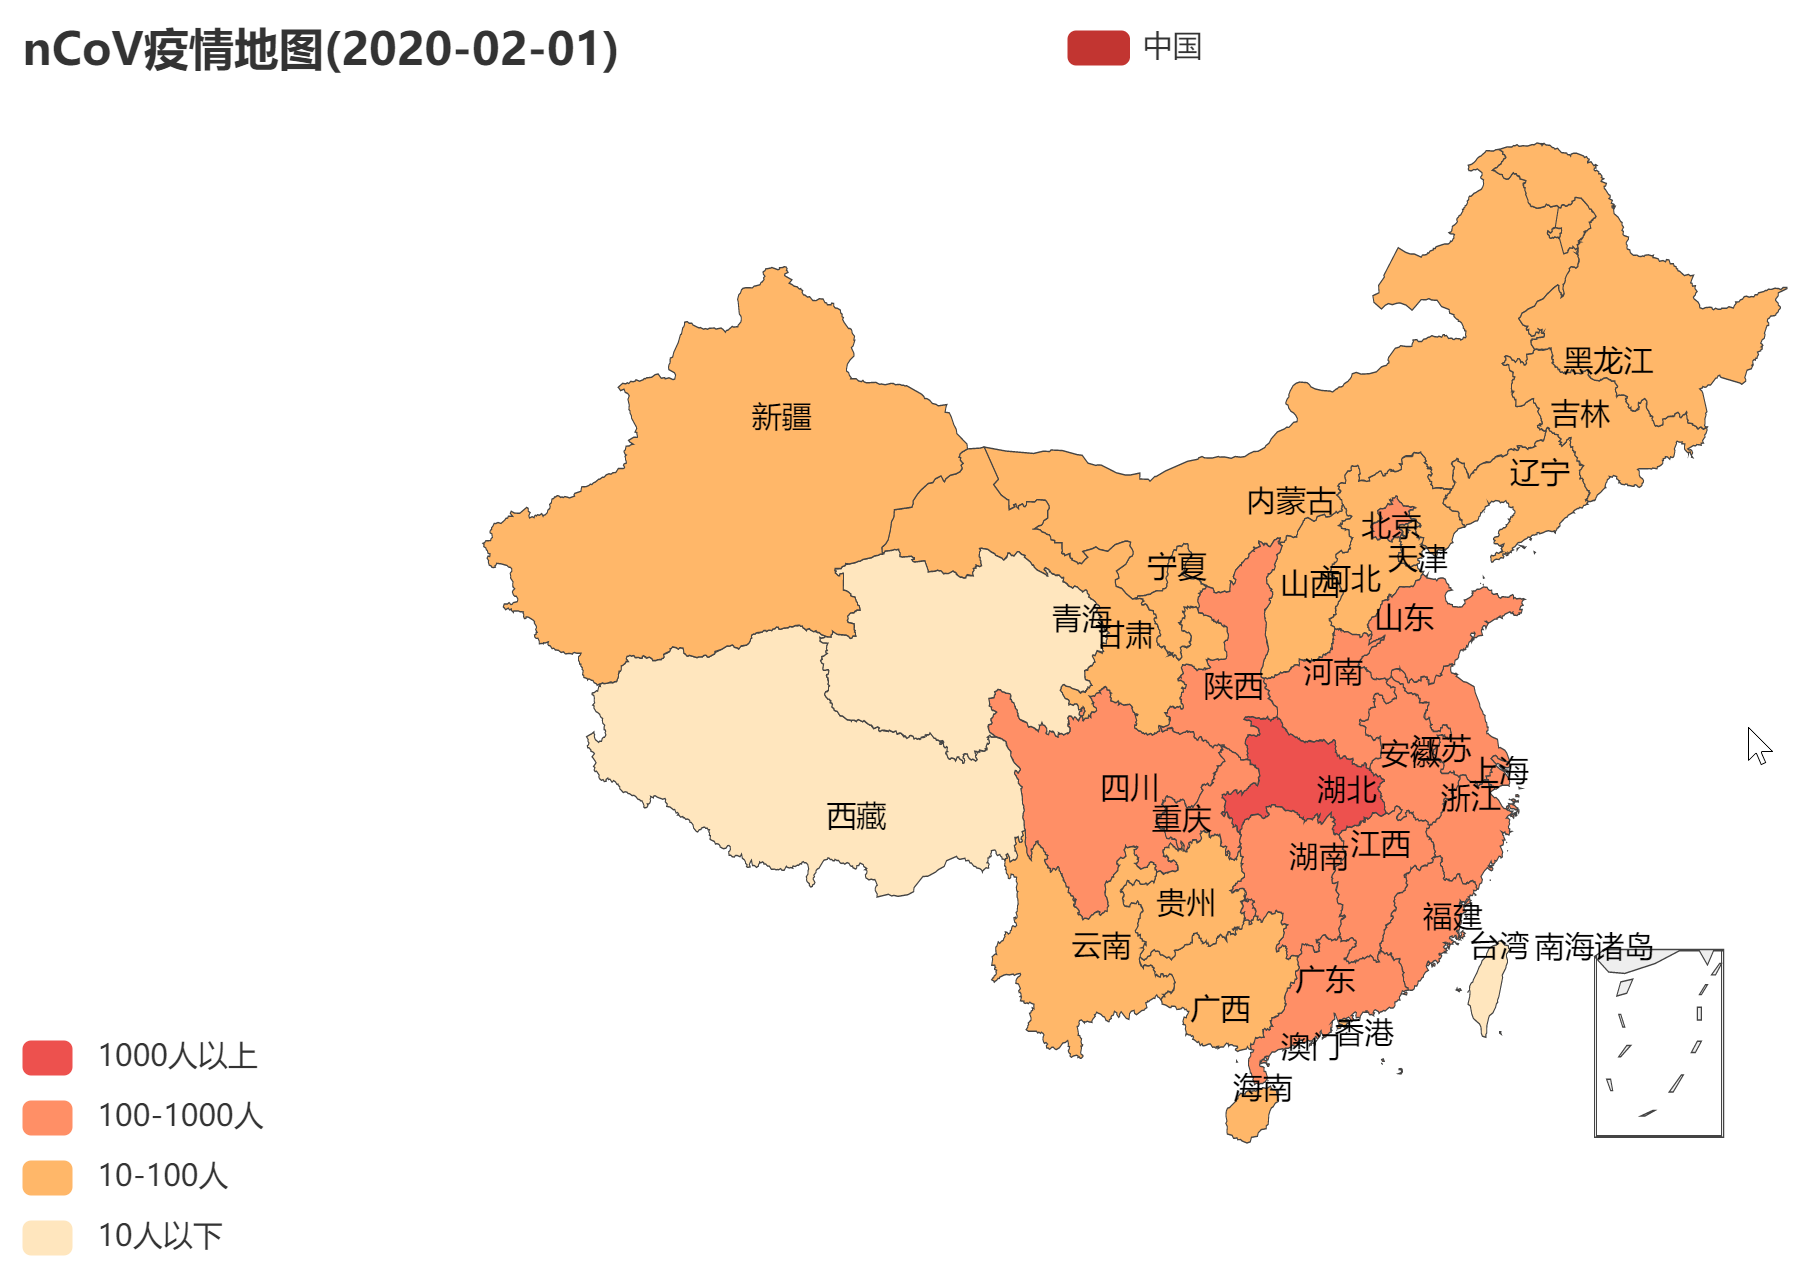
According to my own purpose, I use the pandas module to save the data to Excel. Through the pyecharts module, I save the visual map as html file. The code is relatively intuitive. The main processing process is to flatten the data with multiple levels to get a two-dimensional data. The data shown in the map shows the data of confirmed cases.
import requests
import json
import pandas as pd
import os
import datetime

from pyecharts import options as opts
from pyecharts.charts import *
from pyecharts.globals import ThemeType

cities = []

def get_ncov_data() -> str:
    url = 'https://view.inews.qq.com/g2/getOnsInfo?name=disease_h5'
    data = requests.get(url).json()['data']

    return data


def flatten_ncov_data() -> list:
    all = json.loads(get_ncov_data())
    date = all['chinaTotal']['date']

    # Level 1: Country
    china = all['areaTree'][0]['children']  # get China data

    # Level 2: provinces
    for province in china:
        province_ncov = province['children']

        # Third floor: City / district
        for city in province_ncov:
            # Output format
            city_ncov = {
                'date': date,
                'Province': province['name'],
                'city': city['name'],
                'New confirmation': city['today']['confirm'],
                'New cure': city['today']['heal'],
                'New death': city['today']['dead'],
                'Cumulative acknowledgement': city['total']['confirm'],
                'Cumulative cure': city['total']['heal'],
                'Cumulative death': city['total']['dead']
            }

            cities.append(city_ncov)

if __name__ == "__main__":
    flatten_ncov_data()
    df = pd.DataFrame(cities)

    # Export Excel
    path = os.path.dirname(os.path.abspath(__file__))
    output_file = os.path.join(path, 'output.xlsx')

    df.to_excel(output_file)

    # Using pyecharts to visualize map
    map = Map()
    map.add(
        "China",      # map name
        [list(z) for z in zip(list(df["Province"]), list(df['Cumulative acknowledgement']))],
        "china",
        is_map_symbol_show=False
    )

    map.set_global_opts(
        title_opts=opts.TitleOpts(
            title="nCoV Epidemic map(" + str(datetime.date.today()) + ")"
        ),
        visualmap_opts=opts.VisualMapOpts(
            max_=10000,
            is_piecewise=True,
            pieces=[
                {"min": 0, "max": 10, "label": "10 Below human", "color": "#FFE6BE"},
                {"min": 10, "max": 100, "label": "10-100 people", "color": "#FFB769"},
                {"min": 100, "max": 1000, "label": "100-1000 people", "color": "#FF8F66"},
                {"min": 1000, "max": 10000, "label": "1000 Above human", "color": "#ED514E"}
            ]))

    map.render()
The effect of map display is as follows, the same color as the legend of Tencent epidemic map.