Preface
With the popularization and development of industrial Internet of Things and Internet technology, the way of artificial filling has been gradually replaced by mechanical equipment.Industrial manufacturers are increasingly demanding higher standards and stringent requirements for equipment in order to reduce misoperation, improve equipment safety and pursue high efficiency.At the same time, after the machine production, it still needs to follow the standard management of the whole project process. How to implement the management and handover is also a serious challenge.Therefore, a set of visual interfaces for managing the process should also be developed throughout the production process.
In the control of industrial process, the control system is based on the proportion of error, integral and differential of real-time data collected by the controlled object compared with the given value, referred to as PID control system.PID control production environment has the characteristics of strong adaptability, strong robustness and easy use.Feeding system involves ultra-high pressure technology, which is widely used in pipeline system. It can realize semi-automatic or automatic feeding operation of equipment, solve the problems of inaccurate measurement of traditional feeding methods, work environmental pollution and high labor intensity of workers, so as to achieve efficient pipeline processing.Combined with PID and automated deployment, it can supply and demand power, machinery, metallurgy, chemical industry, food, textile and other industries or civil industries.Hightopo's HT for Web products provide rich 2D configuration. This article helps us understand how to use HT to achieve a visual PID control of the feed system by setting up a 2D scene of the hazardous waste feed system and displaying the data interface.
Effect Preview
Preview of project address: http://www.hightopo.com/demo/PID-feed-system/
Overall collaboration scenarios
Grab Operations Scene
Feeding Scene
Code Construction
Set up scenes
This article mainly implements 2D scenarios, and we need to use the related api of the topology components to build the basic scenarios:
// Data container for accessing data node Node
dataModel = new ht.DataModel();
// Topology Component
graphView = new ht.graph.GraphView(dataModel);
// Add Components to body
graphView.addToDOM();
The above code adds components to the body using the addToDOM() method, HT components are generally embedded in containers such as BorderPane, SplitView, and TabView, while the outermost HT components require the user to manually add the bottom div elements returned by getView() to the DOM elements of the page. Note here that when the size of the parent container changes, if the parent container isThese HT predefined container components, such as BorderPane and SplittView, automatically and recursively call the invalidate function of the child component to notify updates.However, if the parent container is a native html element, the HT component is not aware that updates are required, so the outermost HT component generally needs to listen for window size change events and call the outermost component invalidate() function to update.
For the convenience of outermost components loading full windows, all components of HT have the addToDOM() function, which has the following implementation logic, where iv() is short for invalidate():
addToDom = function(){
    var self = this,
        // Get the underlying div of the component
        view = self.getView(),
        style = view.style;
    // Add component bottom div to body
    document.body.appendChild(view);
    // The position of all components is set to absolute by default
    style.left = '0';
    style.right = '0';
    style.top = '0';
    style.bottom = '0';
    // Window resizes, call refresh function
    window.addEventListener('resize',function(){
        self.iv();
    }, false);
}
Reset the view default method:
// Disable panning by mouse dragging
graphView.setPannable(false);
// Disable box checking on Topology
graphView.setRectSelectable(false);
// Disable the Move Filter function
graphView.setMovableFunc(()=>{false});
Creating a 2D graphic on a 2D editor generates a JSON file, which needs to be deserialized to introduce a generated scene:
ht.Default.xhrLoad('displays/industry/PID-Feeding system.json',function(text){
    // Resolve to JSON Object
    var json = ht.Default.parse(text);
    // Deserialize to Scene
    dataModel.deserialize(json);
})
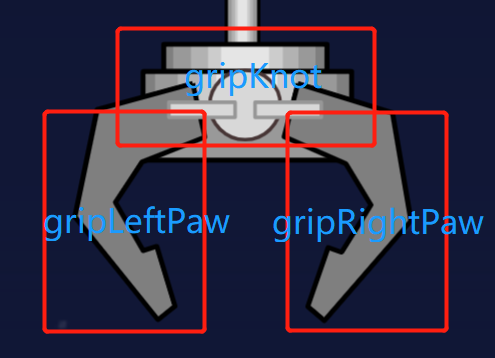
In HT, data type objects are automatically constructed with an ID attribute internally, which can be obtained and set by data.getId() and data.setId(id). Data objects are not allowed to modify the ID value after they are added to the DataModel. Data objects can be quickly found by dataModel.getDataById(id).However, it is generally recommended that ID attributes be automatically assigned by HT, and the only indication of user business meaning can be found on tag attributes. Any dynamic change of tag value is allowed through the Data#setTag (tag) function. Data objects can be found through DataModel#getDataByTag(tag), and deletion of Data objects through DataModel#removeDataByTag (tag) is supported.Here we get the Data object in code through the dataModel.getDataByTag (tag) function by setting the tag property of the Data object in JSON:
{
    "c": "ht.Node",
    "i": 407,
    "p": {
        "displayName": "Knot of the grip",
        "parent": {
            "__i": 403
        },
        "tag": "gripKnot",
        "image": "symbols/symbol factory/Waste disposal/Knot of the grip.json",
        "position": {
            "x": -569.62125,
            "y": -117.05025
        },
        "width": 50,
        "height": 25
    },
    "s": {
        "select.width": 0
    }
}
var gripRightPaw = dataModel.getDataByTag('gripRightPaw');
var girpLeftPaw = dataModel.getDataByTag('grapLeftPaw');
var gripKnot = dataModel.getDataByTag('gripKnot');
Expand Animation
HT encapsulates the **ht.Default.startAnim()** function for animation, obtains the animation duration by setting a duration, the animation properties in the action function for execution, and the callback function after finishFunc animation execution. This case contains eight animations, including self-driven and asynchronous animations.The following is an example of the eighth animation (circulating water flow) to understand the HT built-in animation effect:
// Circulating water flow
function animation() {
    var lineJson = {};
    var name = '';
    var speed = 20,
        lastTime = Date.now();
    // Cycle to get water flow tag and set initialization shape.dash.offset to 0
    for (var i = 1; i <= 9; i++ ) {
        if (i != 8) {
            name = 'line'+i;
            lineJson[name] = 0;
        }
    }
    ht.Default.startAnim({
        duration: 5000,
        action: function () {
            var time = Date.now(),
               deltaTime = (time - lastTime) / 1000;
            for (var tags in lineJson) {
                if (tags.split('e')[1] % 2) {
                    lineJson[tags] += deltaTime * speed;
                } else {
                    lineJson[tags] -= deltaTime * speed;
                }
                var lines = dataModel.getDataByTag(tags);
                lines.setStyle('shape.dash.offset',lineJson[tags]);
            }
            lastTime = time
        },
        finishFunc: function () {
            animation();
            // TODO... You can also call the next animation asynchronously here
        }
    })
}
This example first dynamically obtains a Data node from the created circulating water flow (bound tag tag) through a for loop and dataModel. getDataByTag, determines the direction of the water flow by the number carried by the tag name, and finally sets the offset distance of the dashed line part using Data.setStyle (which can be abbreviated as Data.s).
For example, if lineJson[tags] += value (fixed value), the number of primitives decreases when the user enlarges the view, and the action function in anim is called several times more, so the flow rate increases and the reduction is the same.Therefore, the solution of value = speed * deltaTime is used to solve the problem of inconsistent playback speed of views with different zoom scaling. The specific principle is as follows:
// global
var lastTime = Date.now();
// distance
var distance = 0;
// speed
var speed = 20;
// action
ht.Default.startAnim({
    duration:5000,
    action:function(){
        var time = Date.now();
        var deltaTime = (time - lastTime) / 1000;
        distance += speed * deltaTime;
        lastTime = time;
    },
    finishFunc:function(){//TODO}
})
(ht implementation animation can be driven not only by startAnim, but also by addScheduleTask on schedule with the following code:
dataModel.addScheleTask({
    // Scheduling interval
    interval,
    // Schedule actions before start
    beforeAction(){},
    // Schedule Tasks
    action(){},
    // Action after dispatch ends
    afterAction(){}
})
You can also use callLater, the ht built-in function encapsulates a lot of interesting and practical APIs about animation, and is interested in going to the official website. https://www.hightopo.com ) Understand and learn, or apply online for a framework trial package.If you want to know more about HT encapsulated animations for action, you can refer to https://www.cnblogs.com/xhload3d/p/9222549.html And other articles.
Operable
Of course, HT also draws on the natural benefits of subscription-publishing mode, driving data to change views and providing a more intuitive sense of the data-view binding process.Following are two types of HT to provide an operational interface, the first is to create a panel component, HT provides a series of generic panel components including formPane, borderPane, TablePane, etc. Here we take formPane as an example, first introduce ht-form.js in the index.html main page, which encapsulates the api of the formPane panel, and the related pseudocode is as follows:
// Create panel object
var fp = new ht.widget.FormPane();
fp.setWidth(200);
fp.setHeight(100);
// Panel row height
fp.setRowHeight(30);
fp.setPadding(16);
// Node can set properties directly in style after setting the class name, which means fp.getView() is a common DOM node
fp.getView().className = 'main';
// Adding text and progress bars through the addRow method
fp.addRow([{
    id:'text',
    element:'Current Speed === 20',
    align:'center'
}],[0.1]);
fp.addRow([{
    id:'speed',
    // Progress bar
    slider:{
        min:0,
        max:100,
        // Current Progress Value
        value:20,
        step:1,
        // Trigger function when value changes
        onValueChanged(){
            var speed = fp.v('speed');
            fp.v('text','Current Speed === ' + speed);
        }
    }
}],[0.1]);
document.body.appendChild(fp.getView());
At this point, we can simply bind the data view by pointing the previously defined speed at fp.v('speed'):
function animation(fp){
    var lineJson = {};
    var name = '';
    var lastTime = Date.now();
    var speed;
    for (var i = 1; i <= 9; i++ ) {
        if (i != 8) {
            name = 'line'+i;
            lineJson[name] = 0;
        }
    }
    ht.Default.startAnim({
        duration: 5000,
        action: function () {
            speed = fp.v('speed');
            var time = Date.now(),
                deltaTime = (time - lastTime) / 1000;
            for (var tags in lineJson) {
                if (tags.split('e')[1] % 2) {
                    lineJson[tags] += deltaTime * speed;
                } else {
                    lineJson[tags] -= deltaTime * speed;
                }
                var lines = dataModel.getDataByTag(tags);
                lines.setStyle('shape.dash.offset',lineJson[tags]);
            }
            lastTime = time;
        },
        finishFunc: function () {
            animation(fp);
        }
    })
}
The other is through the vector graphics library of HT, which uses the graphical description of points, lines or polygons to solve the distortion of png, jpg format pictures in the zooming process.Vector graphics can be created either by writing code in regular editors such as webstorm or webstorm, or directly by HT-2D editors. Graphics can be easily created without operation code. Some students who have studied 3dmax or CAD mapping should be familiar with this.With the continuous improvement of the editor, there are already many excellent icons and component cases inside. Here you can directly refer to some small cases. First you need to create a drawing, then pull a homemade icon directly. The effects like legend are drawn by lines, you can see the effects directly by changing the text part.
Key or functional components, icons show the display interface, functional components support triggering of events, first pull the slider icon inside the control, then pull the slider component into the component bar, set a series of parameters such as maximum, minimum and default values of the control.
You can see that there are two values we are about to change, one is slider, the other is text value, default 20. We bind unique labels to these two Data objects, sliderValue and textValue, to change the value of the text first by the current value of the progress bar:
var sliderValue = dataModel.getDataByTag('sliderValue');
var textValue = dataModel.getDataByTag('textValue');
// value change trigger event
sliderValue.a('ht.onChange',function(){
  textValue.a('textValue',sliderValue.a('ht.value'));
})
Then animation gets the current value of the progress bar and points to speed:
function animation(data) {
    var lineJson = {};
    var name = '';
    var lastTime = Date.now();
    var speed;
    for (var i = 1; i <= 9; i++ ) {
        if (i != 8) {
            name = 'line'+i;
            lineJson[name] = 0;
        }
    }
    ht.Default.startAnim({
        duration: 5000,
        action: function () {
            speed = data.a('ht.value');
            var time = Date.now(),
                deltaTime = (time - lastTime) / 1000;
            for (var tags in lineJson) {
                if (tags.split('e')[1] % 2) {
                    lineJson[tags] += deltaTime * speed;
                } else {
                    lineJson[tags] -= deltaTime * speed;
                }
                var lines = dataModel.getDataByTag(tags);
                lines.setStyle('shape.dash.offset',lineJson[tags]);
            }
            lastTime = time;
        },
        finishFunc: function () {
            animation(data);
        }
    })
}
You can also customize multiple slider s to control different animations, depending on your needs.
Not limited to 2D visualization, there are many cases of visualization simulation of 3D-related production environments, as follows:
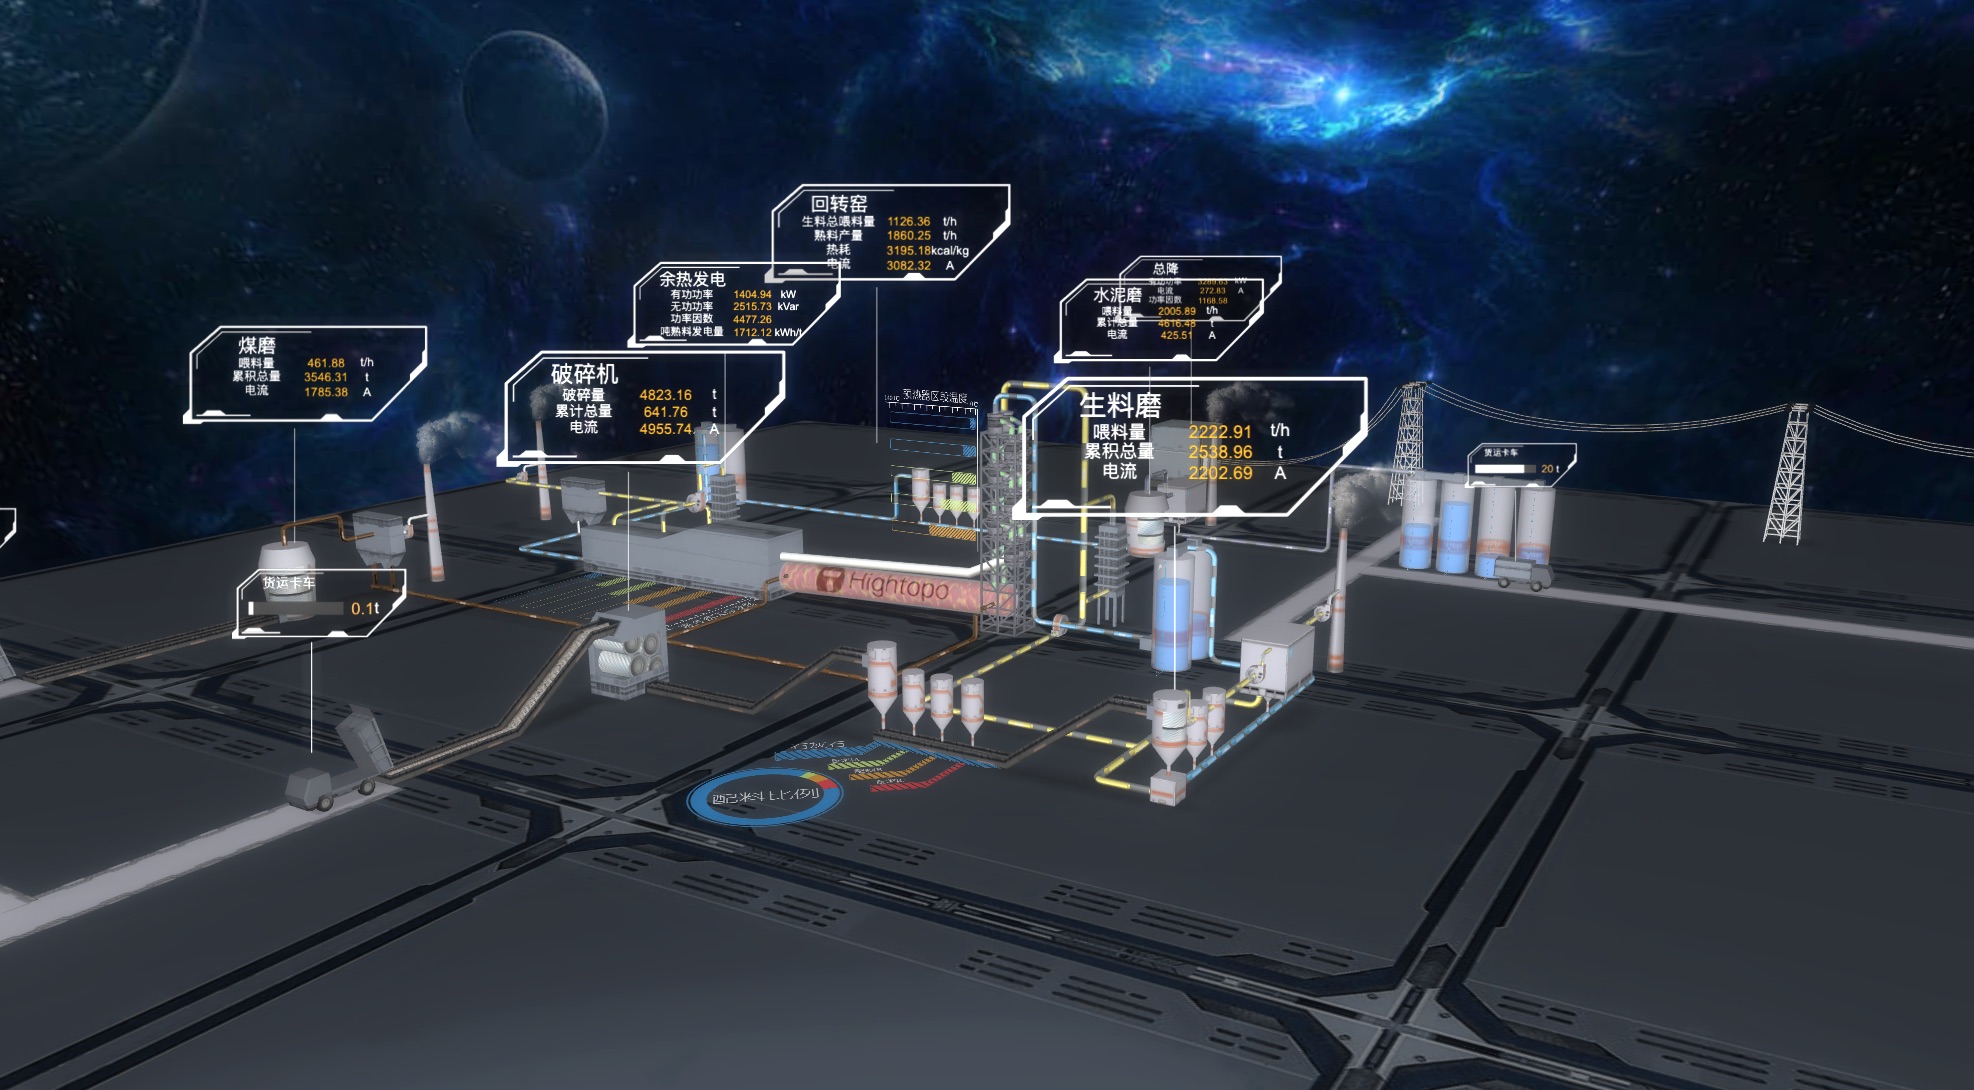
Process flow of 3D cement plant: http://www.hightopo.com/demo/CementFactory/
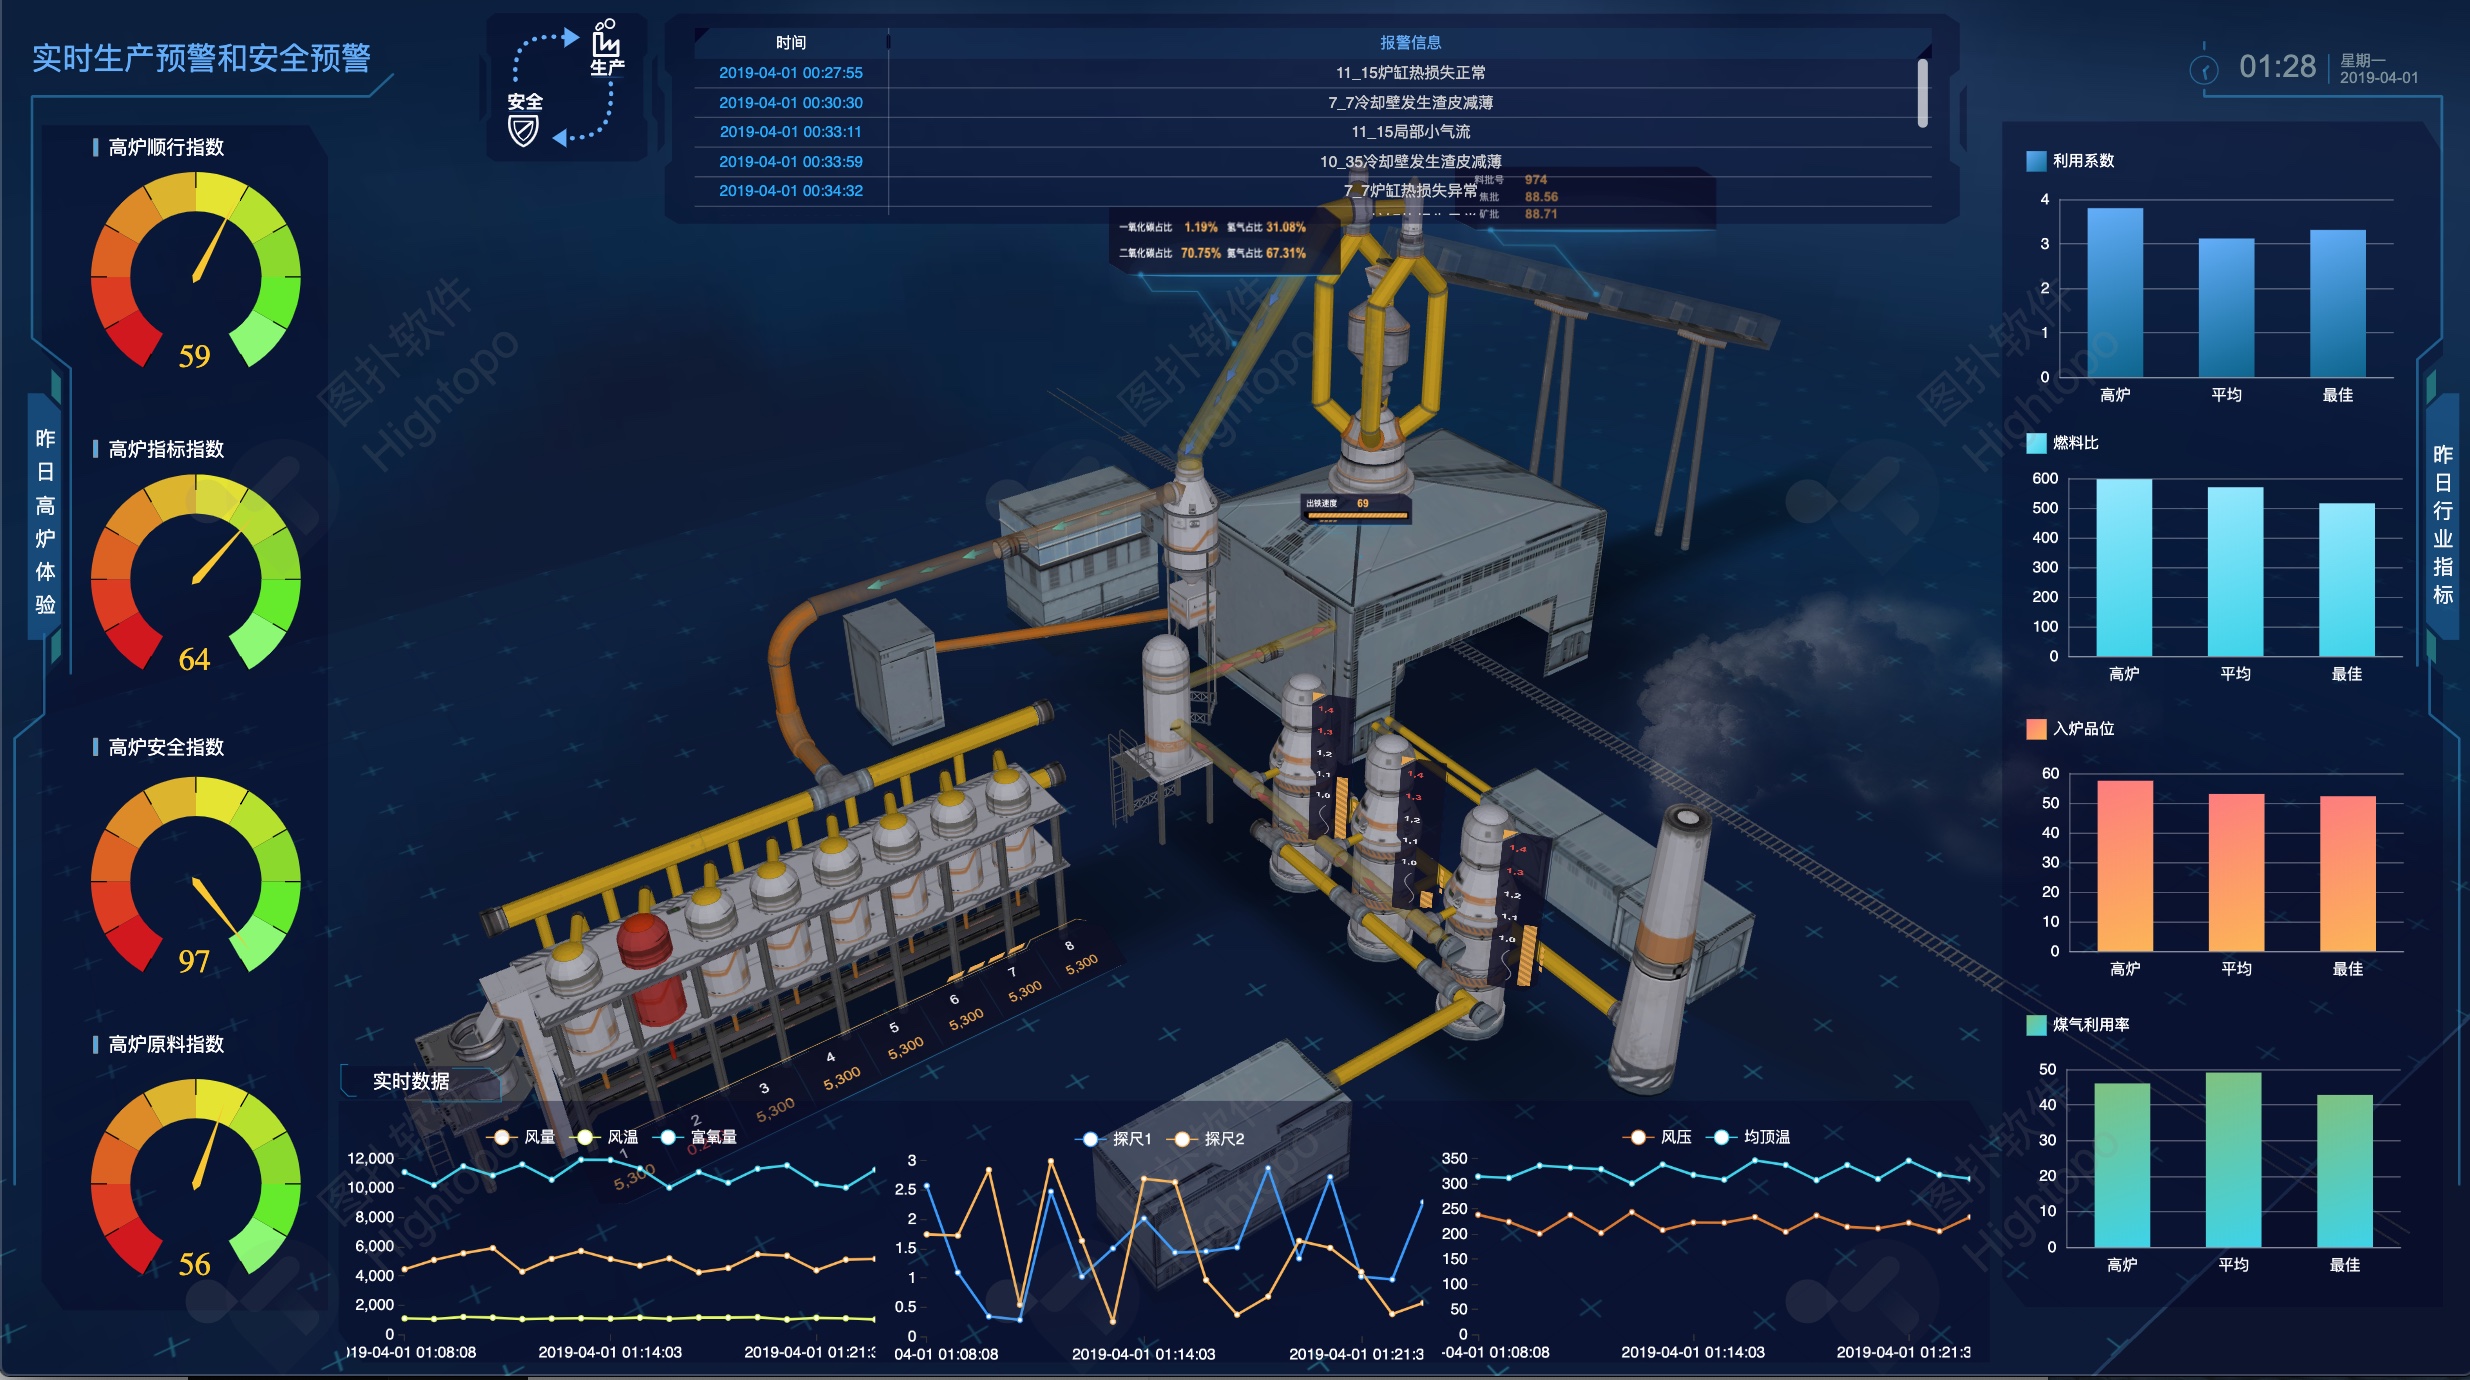
3D BF ironmaking industrial process: http://www.hightopo.com/demo/large-screen-puddling/
summary
The maintenance of the visualization system greatly saves the cost of human resources and time, and also presents a complete set of process flow through rich 2D configuration.The development of information network is the trend of industrial 4.0, and the integration of industrial control and data visualization is also the core of industrial Internet. This can help to build a visualized operation and maintenance system of representative industrial process standards in the industrial field through a series of simple and clear animations and real-time data feedback.Of course, HT is constantly improving by itself, not only has 2D configuration that users can easily use, but also has many interesting and fun ways to build 3D configuration for users!
In 2019, we have also updated hundreds of 2D/3D visualization case sets for the industrial Internet, where you can find many novel examples and discover different industrial Internet: https://mp.weixin.qq.com/s/ZbhB6LO2kBRPrRIfHlKGQA
You can also see more cases and effects: https://www.hightopo.com/demos/index.html