Visual dynamic analysis of national epidemic situation - [force plan]
50 meters of gas field -- new open source project
- Visual dynamic analysis of national epidemic situation - [force plan]
- @[toc]
- Preface
- 1. text
- 1. The first step is to obtain data
- 2. The second step is to obtain longitude and latitude
- 3. The third step is visual analysis
- 4. Step 4 data storage
- 5. Step 5 data rendering
- ==I hope the epidemic will come to an end as soon as possible, wear masks, protect myself, protect others and contribute to the society. = =
Preface
Recently, we are all concerned about how long the epidemic can be won. Today, let's take you to the "national epidemic visualization dynamic analysis"
The full text is under the clove doctor's data, increases the peripheral city's epidemic situation.
Today, we provide you with the progress related to various epidemics through visualization, hoping to help you better understand the current situation of the epidemic.
First, let's look at the finished product drawing:
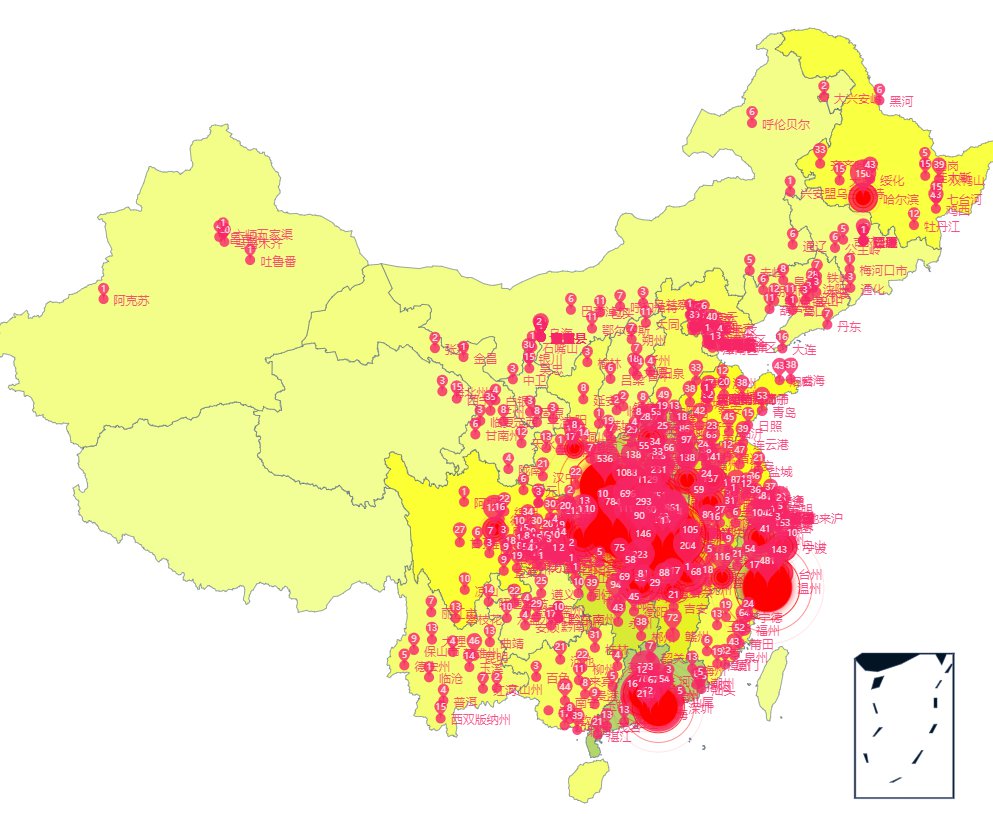
The big picture is a bit messy. Let's zoom in a little
1. I will display different colors according to different provinces and people in China, and mouse movement will show the current epidemic situation.
The color of each region can be modified on the left: there are two arrows up and down to pull up and down to select the region, as shown below:
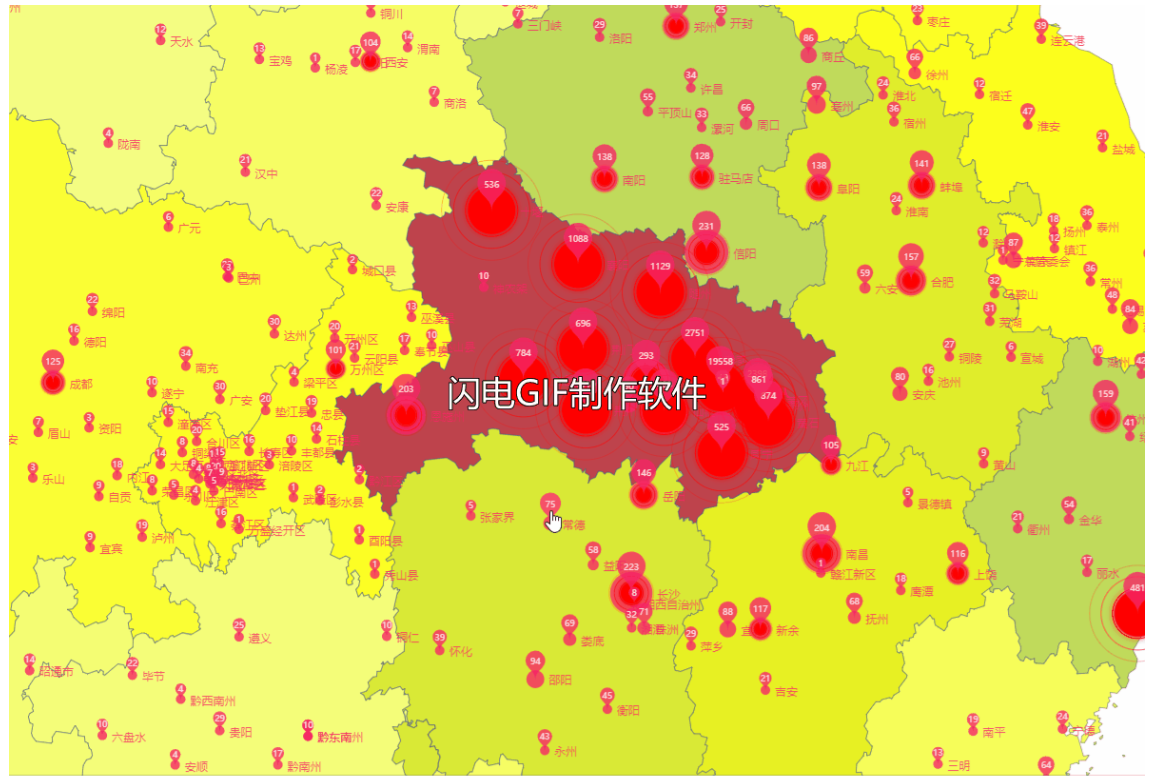
2. When the map is enlarged, you can see more details,
For example, if the number reaches 100 and the current position is set, the alarm will be added. Of course, as the number increases, the number of points in the position will be larger and the bubble will rise more.
The enlarged effect is as follows:
This blog only introduces ideas, project open source - CSDN force plan
1. text
1. The first step is to obtain data
The latest and most comprehensive API [open source] is attached below
HttpClient httpClient = new HttpClient { BaseAddress = new Uri("https://view.inews.qq.com/") };
HttpResponseMessage httpResponseMessage = httpClient.GetAsync("g2/getOnsInfo?name=disease_h5").GetAwaiter().GetResult();
var result = httpResponseMessage.Content.ReadAsStringAsync().GetAwaiter().GetResult();
nCoVData data = JsonConvert.DeserializeObject<nCoVData>(result);
nCoVDataDetail nCoVDataDetail = JsonConvert.DeserializeObject<nCoVDataDetail>(data.Data);
Parse json into c ා.
nCoVDataDetail.AreaTree #Province Information
There are a lot of pictures not shown
public class AreaTree
{
    public AreaTree()
    {
        this.Today = new Today();
        this.Total = new Overview();
        this.Children = new List<Children>();
    }
       //Country name
    public string Name { get; set; }
        //Today's changes
    public Today Today { get; set; }
        //Total quantity
    public Overview Total { get; set; }
        //Province or municipality directly under the central government
    public List<Children> Children { get; set; }
}
public class Children
{
     //Name of province or municipality directly under the central government
    public string Name { get; set; }

    // Today's change
    public Today Today { get; set; }
    // Statistics
    public Overview Total { get; set; }
        //A district under a province or municipality
    public List<Children> children { get; set; }
}
The template is similar to the above
.
.
2. The second step is to obtain longitude and latitude
Using Baidu map API to get location information
private static mapv3 GetHttpRequest(string areaAddress)
{
    HttpClient httpClient = new HttpClient { BaseAddress = new Uri("http://api.map.baidu.com/") };
    HttpResponseMessage httpResponseMessage = httpClient.GetAsync("geocoding/v3/?address=" + areaAddress + "&output=json&ak=Your key").GetAwaiter().GetResult();
    var result = httpResponseMessage.Content.ReadAsStringAsync().GetAwaiter().GetResult();
    mapv3 data = JsonConvert.DeserializeObject<mapv3>(result);
    return data;
}
Baidu map API development document: https://lbsyun.baidu.com/
Baidu map register your access application key
mapv3 model, here I only introduce the longitude and latitude used
public class mapv3
{
    public int status { get; set; }

    public result result { get; set; }
}
Status returned as status 0 success, others failed
Look at result.
public class result
{
    public location location { get; set; }

    public int precise { get; set; }

    public int confidence { get; set; }

    public int comprehension { get; set; }

    public string level { get; set; }
}
Others are not introduced. Please refer to the official website for details. Only location is introduced here.
public class location
{
    public double lng { get; set; }

    public double lat { get; set; }

}
So that's the latitude and longitude
.
.
3. The third step is visual analysis
Sorting data corresponds to the data format of echarts
Ecarts longitude and latitude format:
{
	"Position": [longitude, latitude]
}
The latitude and longitude address needs array access.
private static Dictionary<string, double[]> dic = new Dictionary<string, double[]>();
I use dictionary to identify whether it already exists, facilitate query and reduce waste of resources.
Here is the overall format:
private static void GetPositionOfJson(IList<AreaTree> areaTrees)
{
    // Considering the query cost
    echartsModels = new List<EchartsModel>();
    echartsMapModels = new List<EchartsMapModel>();
    pronvincedic =new List<EchartsModel>();
    EchartsModel echartsModel = new EchartsModel();
    EchartsMapModel echartsMapModel = new EchartsMapModel();
    foreach (var country in areaTrees)
    {
        var CountryName = country.Name;
        if (CountryName != "China")
        {
            //only china
            continue;
        }
        var provinceRank = "province";
        foreach (var province in country.Children)
        {
            if (province.Name == "Beijing" || province.Name == "Tianjin" || province.Name == "Shanghai" || province.Name == "Chongqing")
            {
                provinceRank = "city";
            }
            var provinceName = province.Name + provinceRank;

            //Join the statistics because of Tibet
            if (!dic.Keys.Contains(province.Name))
            {
                var fullName = provinceName + province.Name;
                mapv3 mapv3 = GetHttpRequest(fullName);
                if (mapv3.status == 0)
                {
                    var location = mapv3.result.location;
                    double[] d = new double[] { location.lng, location.lat };
                    dic.Add(province.Name, d);
                }
            }
            EchartsModel echartsModelPClone = (EchartsModel)echartsModel.clone();
            echartsModelPClone.name = province.Name;
            echartsModelPClone.value = province.Total.Confirm;
            pronvincedic.Add(echartsModelPClone);


            //colour
            EchartsMapModel echartsMapModelClone = (EchartsMapModel)echartsMapModel.clone();
            echartsMapModelClone.name = province.Name;
            //Total number of infections
            EchartsModel InfectSum = (EchartsModel)echartsModel.clone();
            InfectSum.name = "Number of infected persons";
            InfectSum.value = province.Total.Confirm;
            //Cure number
            EchartsModel CureSum = (EchartsModel)echartsModel.clone();
            CureSum.name = "Cure number";
            CureSum.value = province.Total.Heal;
            //Heavy death toll
            EchartsModel HeadSum = (EchartsModel)echartsModel.clone();
            HeadSum.name = "death toll";
            HeadSum.value = province.Total.Dead;
            List<EchartsModel> echartsModelMapList = new List<EchartsModel>();
            echartsModelMapList.Add(InfectSum);
            echartsModelMapList.Add(CureSum);
            echartsModelMapList.Add(HeadSum);
            echartsMapModelClone.value = echartsModelMapList;
            echartsMapModels.Add(echartsMapModelClone);
            foreach (var city in province.children)
            {
                if (!dic.Keys.Contains(city.Name))
                {
                    var fullName = provinceName + city.Name;
                    mapv3 mapv3 = GetHttpRequest(fullName);
                    if (mapv3.status == 0)
                    {
                        var location = mapv3.result.location;
                        double[] d = new double[] { location.lng, location.lat  };
                        dic.Add(city.Name, d);
                    }
                }
                //The following parts need to be optimized
                EchartsModel echartsModelClone= (EchartsModel)echartsModel.clone();
                echartsModelClone.name = city.Name;
                echartsModelClone.value = city.Total.Confirm;
                echartsModels.Add(echartsModelClone);
            }
        }
    }
}
Analysis:
Add the following latitude and longitude:
foreach (var city in province.children)
{
    if (!dic.Keys.Contains(city.Name))
    {
        var fullName = provinceName + city.Name;
        mapv3 mapv3 = GetHttpRequest(fullName);
        if (mapv3.status == 0)
        {
            var location = mapv3.result.location;
            double[] d = new double[] { location.lng, location.lat  };
            dic.Add(city.Name, d);
        }
    }
    //The following parts need to be optimized
    EchartsModel echartsModelClone= (EchartsModel)echartsModel.clone();
    echartsModelClone.name = city.Name;
    echartsModelClone.value = city.Total.Confirm;
    echartsModels.Add(echartsModelClone);
}
Judge that it does not exist, and query through Baidu.
EchartsModel is a scatter format that passes through the echarts model.
The format of echarts is {name:"",value: ""}, with scattered numbers and names.
Because there are too many created cities in each city, I use the method of cloning.
There is a place to introduce:
if (province.Name == "Beijing" || province.Name == "Tianjin" || province.Name == "Shanghai" || province.Name == "Chongqing")
{
    provinceRank = "city";
}
As these are municipalities directly under the central government, they can be directly positioned through the city
If you add provinces, it's not accurate
.
.
4. Step 4 data storage
Save the latitude and longitude in the dictionary. It takes a long time to query each time you restart
Solution: the query data is saved in json format, stored locally and read first after restart.
The data must be updated dynamically in order to initialize at startup, so the data should be updated every 1h.
timer.LoadMap();
//Initialization
timer.getData(null,null);
//Every hour
System.Timers.Timer  timerOneHour= new System.Timers.Timer(60 * 60 * 1000);
timerOneHour.Elapsed += new System.Timers.ElapsedEventHandler(timer.getData);
timerOneHour.AutoReset = true;
.
.
5. Step 5 data rendering
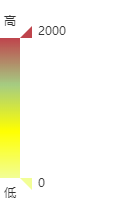
Color and size
visualMap: {
    show: true,
    min: 0,
    max: 2000,
    left: 'left',
    top: 'bottom',
    text: ['high', 'low'], // Text, default to numeric text
    calculable: true,
    seriesIndex: [1],
    pieces: [{
    }],
    inRange: {
        color: ["#F2FE96",'#FFFF00', '#A5CC82',"#BF444C"], // Green to yellow to red
    }
}
Set the number range of provinces as 0-2000, and the color changes in this range:
color: ["#F2FE96",'#FFFF00', '#A5CC82',"#BF444C"]
Scatter and bubble size:
symbolSize: function (val) {
    num = val[2] / 5;
    num = num > 50 ? 50 : num;
    num = num < 10 ? 10 : num;
    return num;
}
Maximum 50, minimum 10.
Here is how to display the danger flag if value > 100.
{
    name: 'item>100',
    type: 'effectScatter',
    coordinateSystem: 'geo',
    data: convertData(data.sort(function (a, b) {
        return b.value - a.value;
    }).filter(function (item) {
        return item.value >= 100
    })
    )
    ,
    symbolSize: function (val) {
        num = (val[2] / 10);
        num = num > 50 ? 50 : num
        if (val[2] == 0) {
            num = 0;
        }
        return num;
    },
    showEffectOn: 'render',
    rippleEffect: {
        brushType: 'stroke'
    },
    hoverAnimation: true,
    label: {
        normal: {
            formatter: '{b}',
            position: 'right',
            show: false
        }
    },
    itemStyle: {
        normal: {
            color: 'red',
            shadowBlur: 10,
            shadowColor: 'red'
        }
    },
    zlevel: 1
}
.
.
I hope the epidemic will come to an end as soon as possible, wear masks, protect myself, protect others and contribute to the society.
Code cloud open source address: https://gitee.com/xingly-cn/wuhan
Welcome to join in the improvement and contribute to the community!

