In time series reconstruction, because A-G filtering and D-L filtering must be used in the experiment, these two classical methods are difficult to implement in python and there are few data, so we can only use the functions encapsulated by TIMESAT software. In this process, we have encountered many pits and problems... Record.
The normal operation process can refer to the article TIMSAT fitting LST data , NDVI is handled similarly.
1. The first is the download and installation of TIMESAT. Based on MATLAB2018b environment, the overall process refers to the articles of qingdeng often accompanied by the old Buddha Time series filtering software TIMESAT.
Since the cracking installation of MATLAB uses the iso image file, the installation logic of the two iso files is the same as inserting the CD. Installing with disk1 will lead to half of the installation, prompting the need to insert disk2.
Finally, the virtual optical drive software DAEMON-TOOLS is used to install normally. Refer to the article Instructions for using MATLAB installation files in iso format for Windows
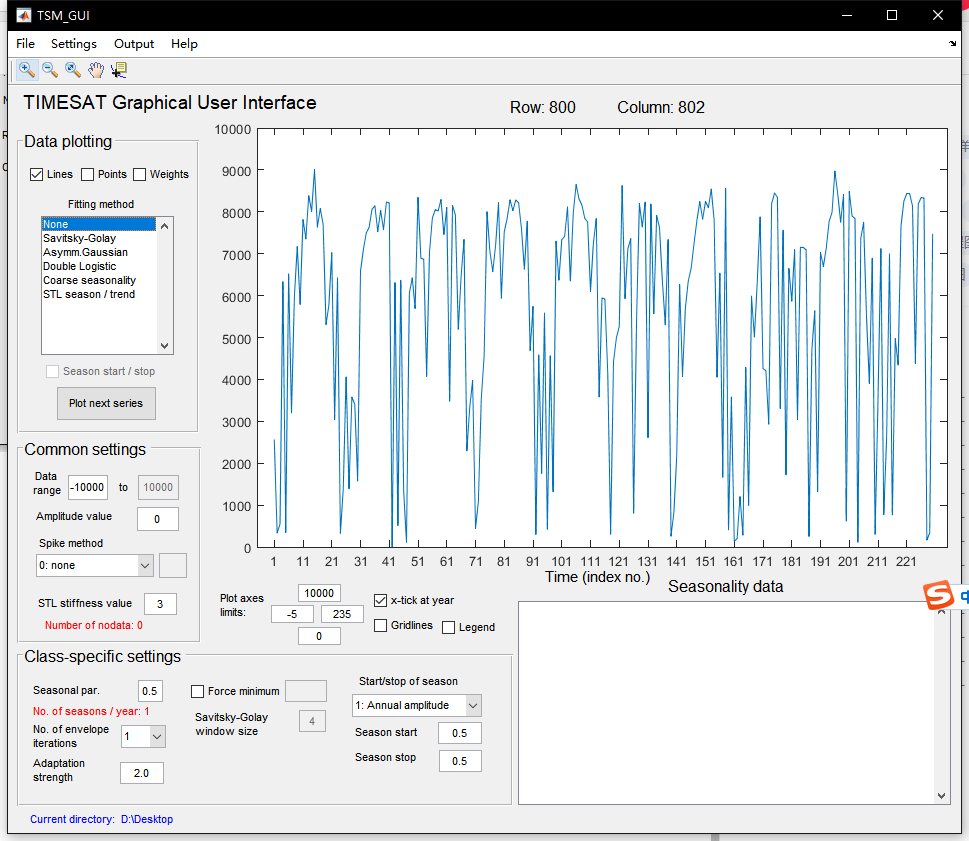
2. After successfully opening the TIMESAT software, the interface is as follows:
Where TSM_ imageview can load single or multiple images to preview their effects. No of rows in image represents the number of rows and columns represents the number of columns of the image, and only single band images can be input. After correct input, click Draw to load a single image.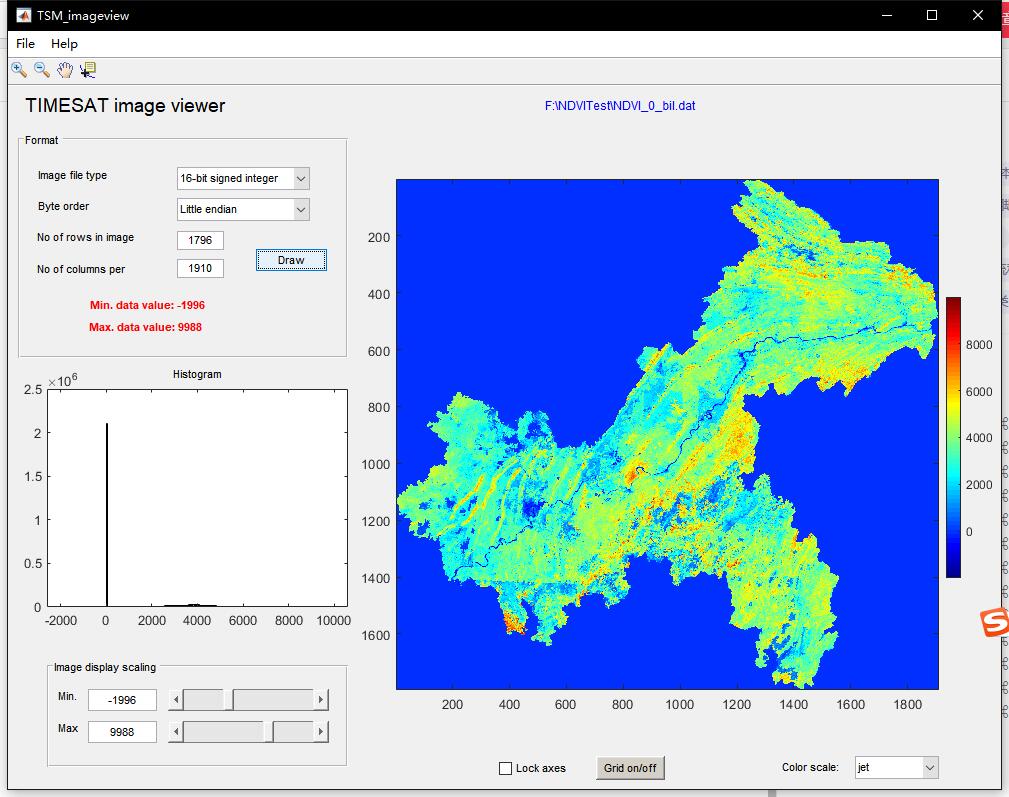
However, if the number of rows and columns is wrong or there is a problem with the format and coding method of the image itself, the image loading error will be caused. Due to the strict requirements of TIMESAT for the image format, many TIF format images processed by Python can be loaded and displayed correctly in ENVI5.3, but they are displayed as garbled or misaligned in TIMESAT.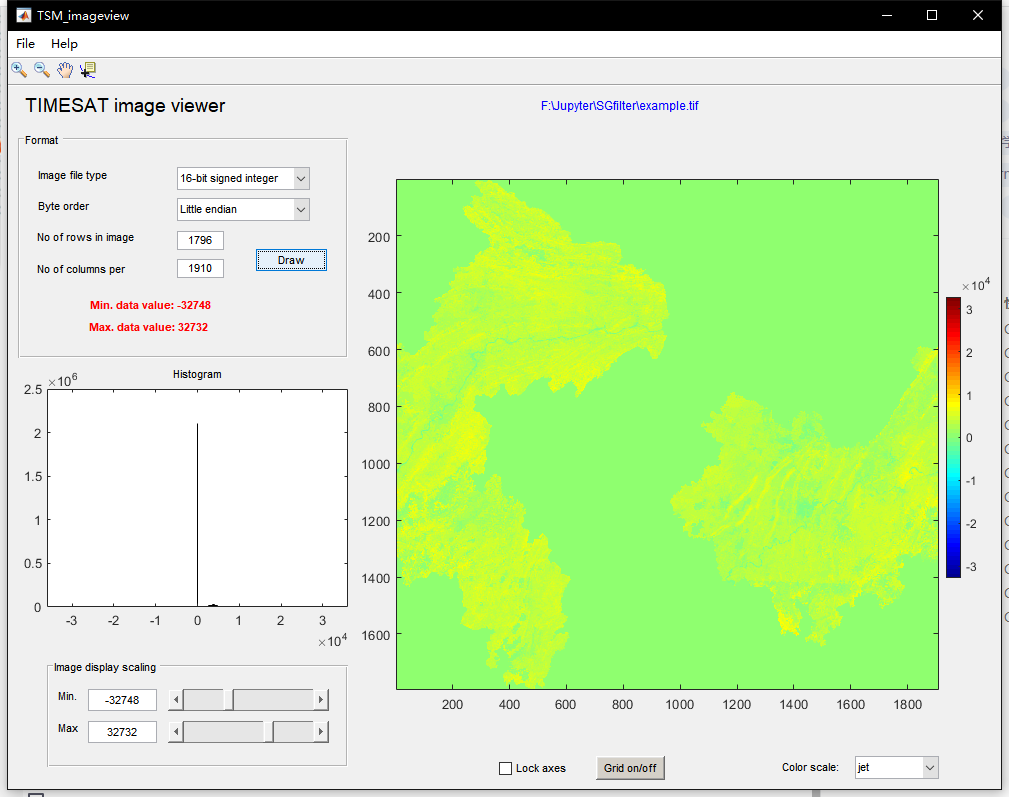
3. Batch output TIF format image in Python and format conversion in ENVI:
Since my images have been processed in python, they need to be stored in TIF format files in the form of arrays. If conventional image processing libraries such as Opencv are used to read and store them, the images will be saved as RGB three channel gray images instead of single channel gray images, and the projection information will also be lost, which can not be recognized by TIMESAT at at all.
Therefore, only the GIS related library gdal can be used here to read the original TIF file and write relevant bands. Refer to the article Reading and writing remote sensing image files in Python , here, the number of bands is limited to 1, and batch output to the target folder. There are also many problems in the installation and use of gdal library. You need the version adapted to the system to import normally.
#Save the single band tif file. In the next step, format conversion needs to be done in ENVI. References to other related libraries are not listed here
from osgeo import gdal
def FileSave():

    lists = list(range(230))
    def read(i):
        despath = 'test/NDVI_%d.tif'%i
        outpath = 'NDVI/NDVI_%d.tif'%i
        dataset = gdal.Open(despath)
        if dataset == None:
            print(despath + "The file cannot be opened")
        im_width = dataset.RasterXSize # Number of columns in grid matrix
        im_height = dataset.RasterYSize # Number of rows of grid matrix
        im_bands = dataset.RasterCount # Band number
        im_geotrans = dataset.GetGeoTransform() # Get affine matrix information
        im_pro = dataset.GetProjection()
        im_data = dataset.ReadAsArray(0, 0, im_width, im_height) # get data

        driver = gdal.GetDriverByName("GTiff")
        datatype = gdal.GDT_Int16#TIMESAT needs to specify a usigned8 bit or signed16 bit bitmap
        dataset = driver.Create(outpath , im_width, im_height, 1, datatype,
        options=["INTERLEAVE=BAND"])
        if (dataset != None and im_geotrans != None and im_pro != None):
            dataset.SetGeoTransform(im_geotrans) # Write affine transformation parameters
            dataset.SetProjection(im_pro) # Write projection

        dataset.GetRasterBand(1).WriteArray(im_data[0])
        del dataset

    """Multi process read write method"""
    start = time.time()
    pool = ThreadPool()
    results = pool.map(read, lists)
    pool.close()
    pool.join()
    end = time.time()
    print("Total time{}second".format((end - start)))
The output single band TIF image can be read by ENVI, but still can not be recognized by TIMESAT. It is necessary to use the batch processing plug-in ENVI Raster Processing Batch Tools in ENVI to uniformly convert it to dat format. Refer to the article for specific operation TIMSAT fitting LST data , plug-in download address ENVI extension tool.
Open all files to be processed in ENVI5.3 64 bit version, convert them into. dat files using Convert Interleave Batch format, and finally they can be recognized in TIMESAT.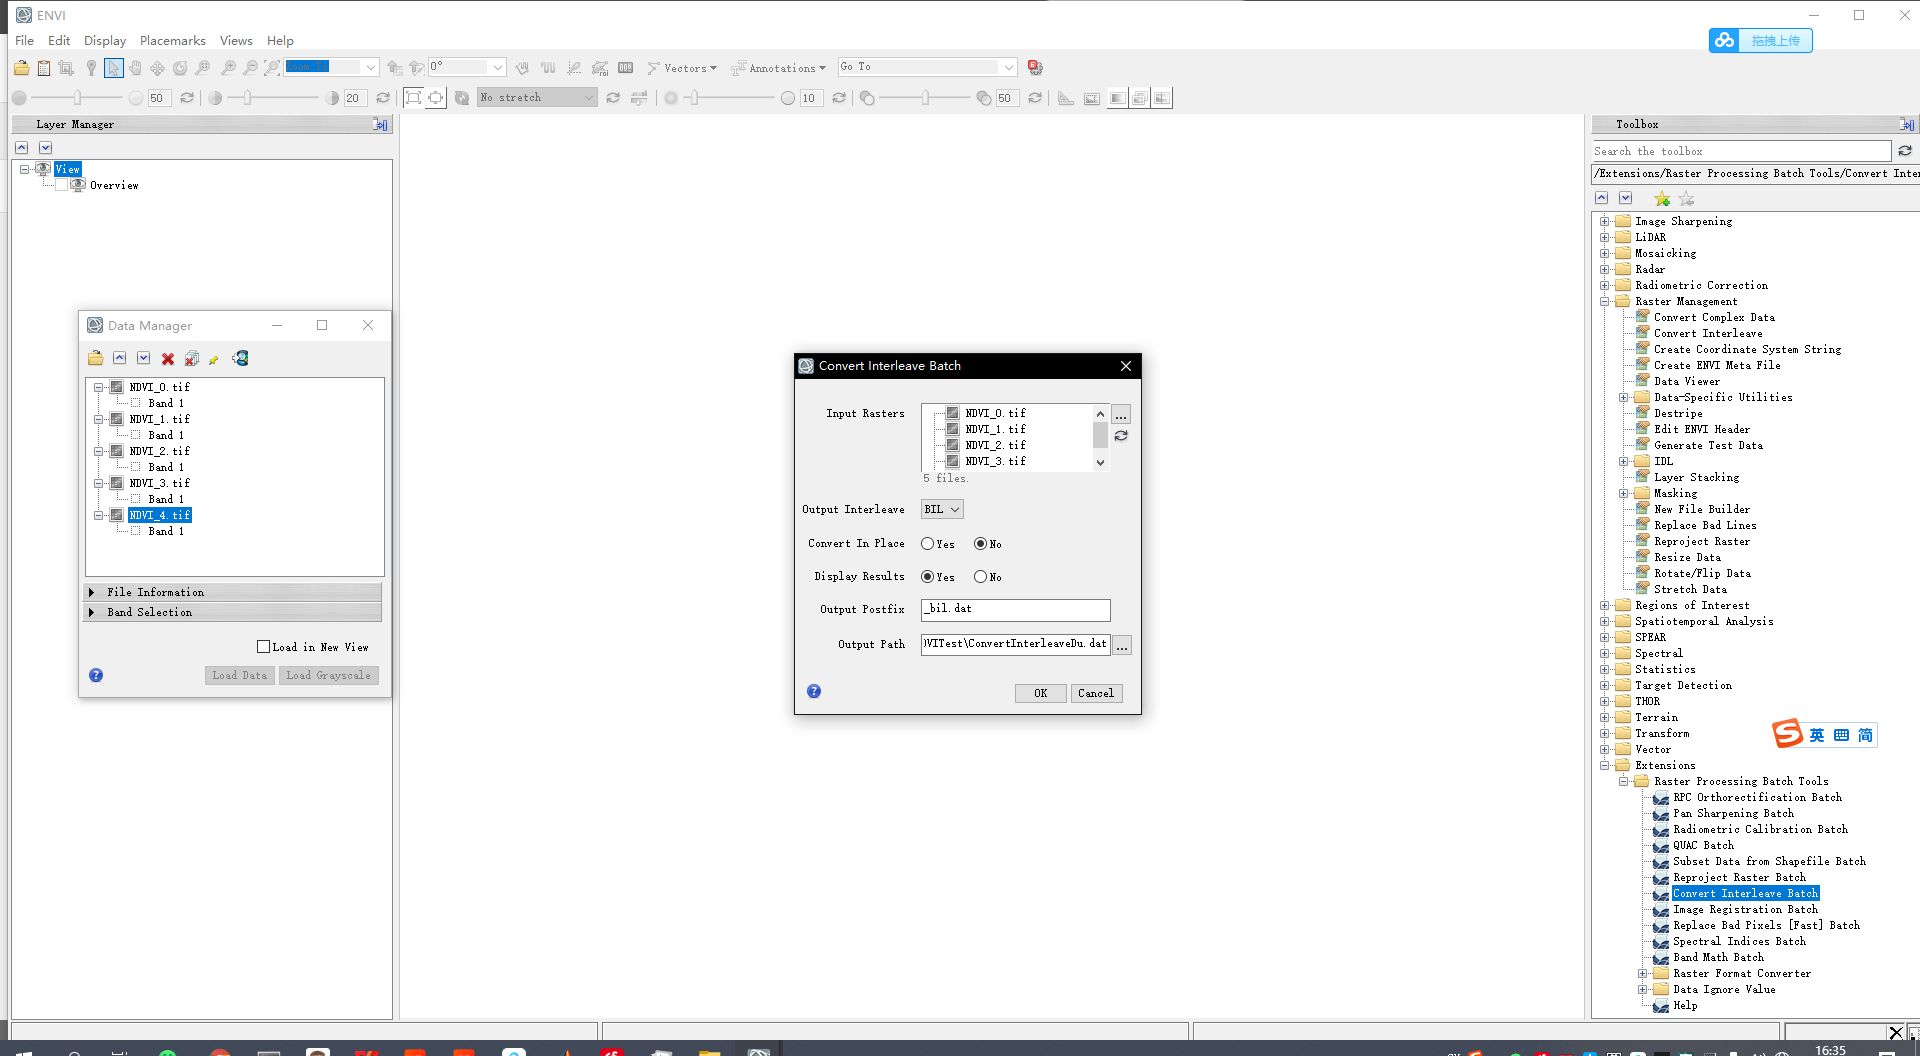
4. Time series image input and processing:
TSM is mainly used to process time series in TIMESAT_ GUI function, you need to input a list file to represent all time series images. This file is in txt format. The first line writes the total number of files, and the rest lines the addresses of all files.
In the input setting, No of years represents the number of images in a year, and the latter represents the total number of years. Other parameters are consistent with the number of image rows and columns and digits mentioned above, but the area to be processed needs to be limited in Rows to process. Only a small area of 800-805 is processed here. If not limited, it may lead to excessive calculation and program crash.
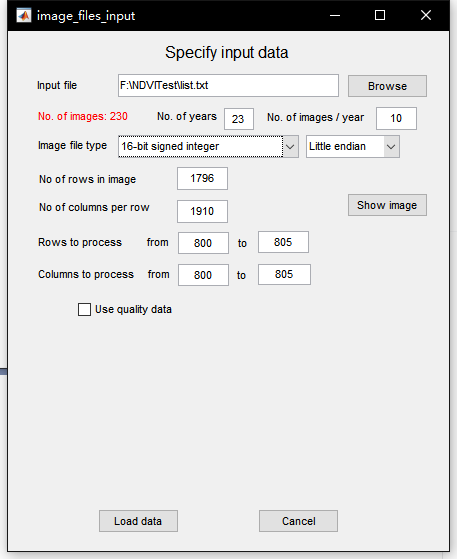
After the data is loaded, the time series will be displayed on the interface. In the filtering method column, you can select the relevant filtering function. With Output, you can Output the time series of a pixel to a txt file. Finally, you can read it in python using numpy.
log = np.loadtxt("logistic.txt")
log = log/10000
raw = ndvi[800][802]

pic = {
    'raw':raw,
    'log':log
}
pic = pd.DataFrame(pic)
pic.plot()